Texas Manufacturing Outlook Survey

Texas factory output growth slows further
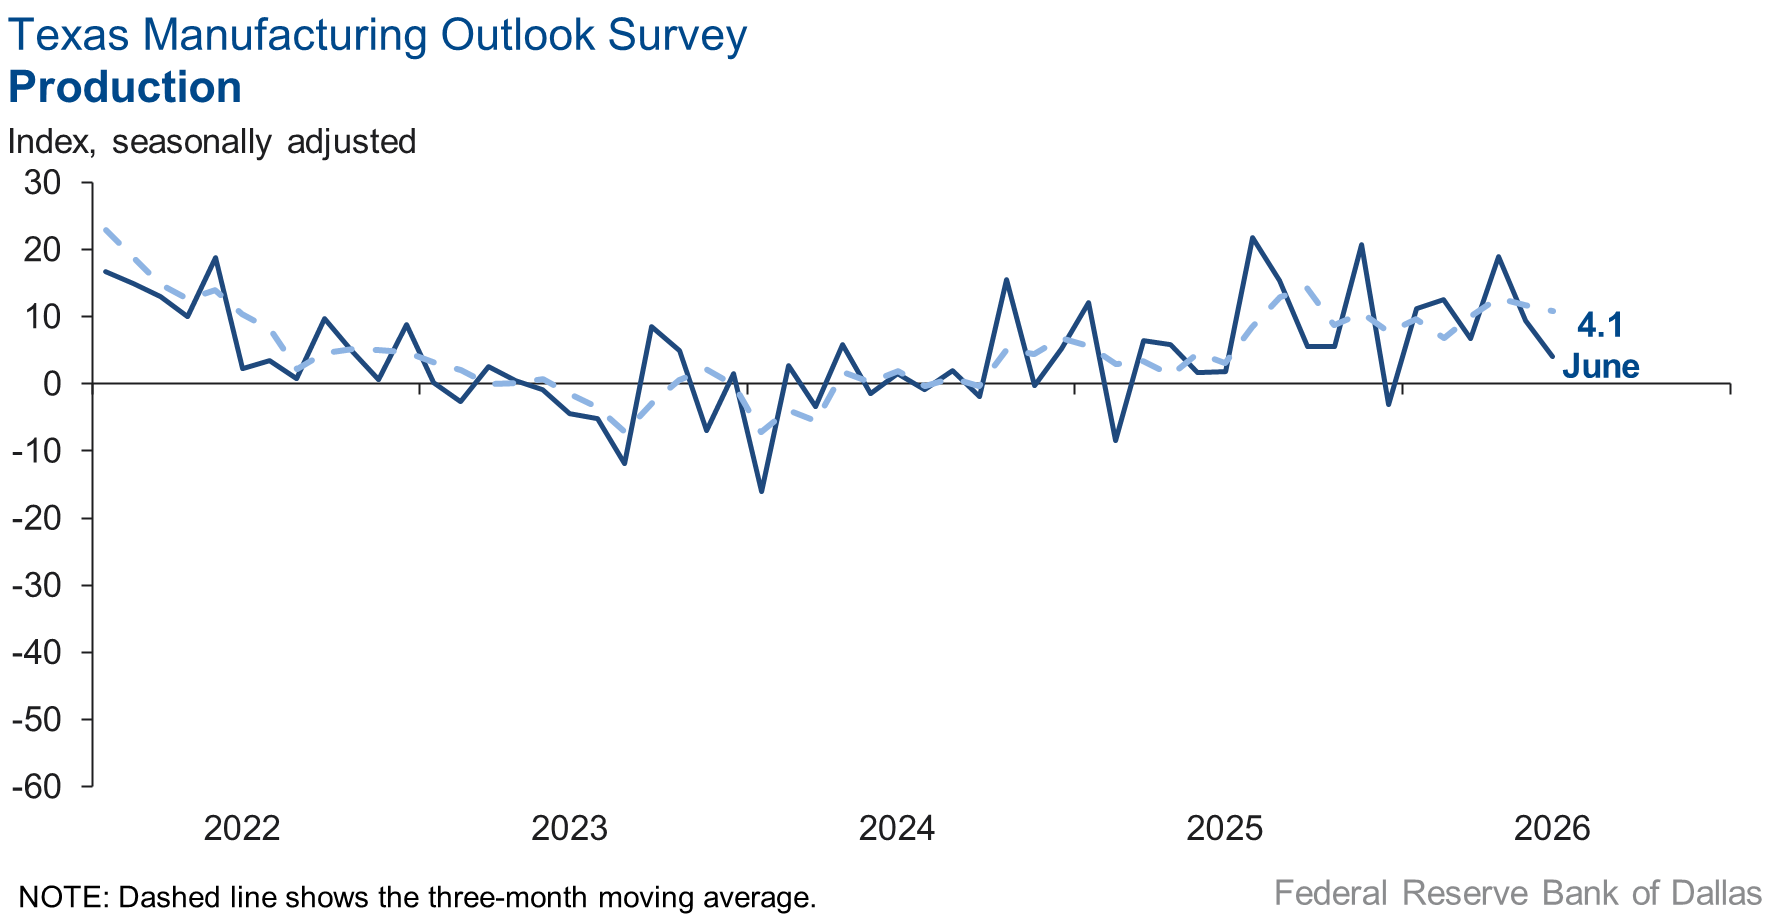
Texas manufacturing output growth decelerated in June, according to business executives responding to the Texas Manufacturing Outlook Survey. The production index, a key measure of state manufacturing conditions, fell five points to 4.1, a reading suggestive of a below-average pace of output expansion.
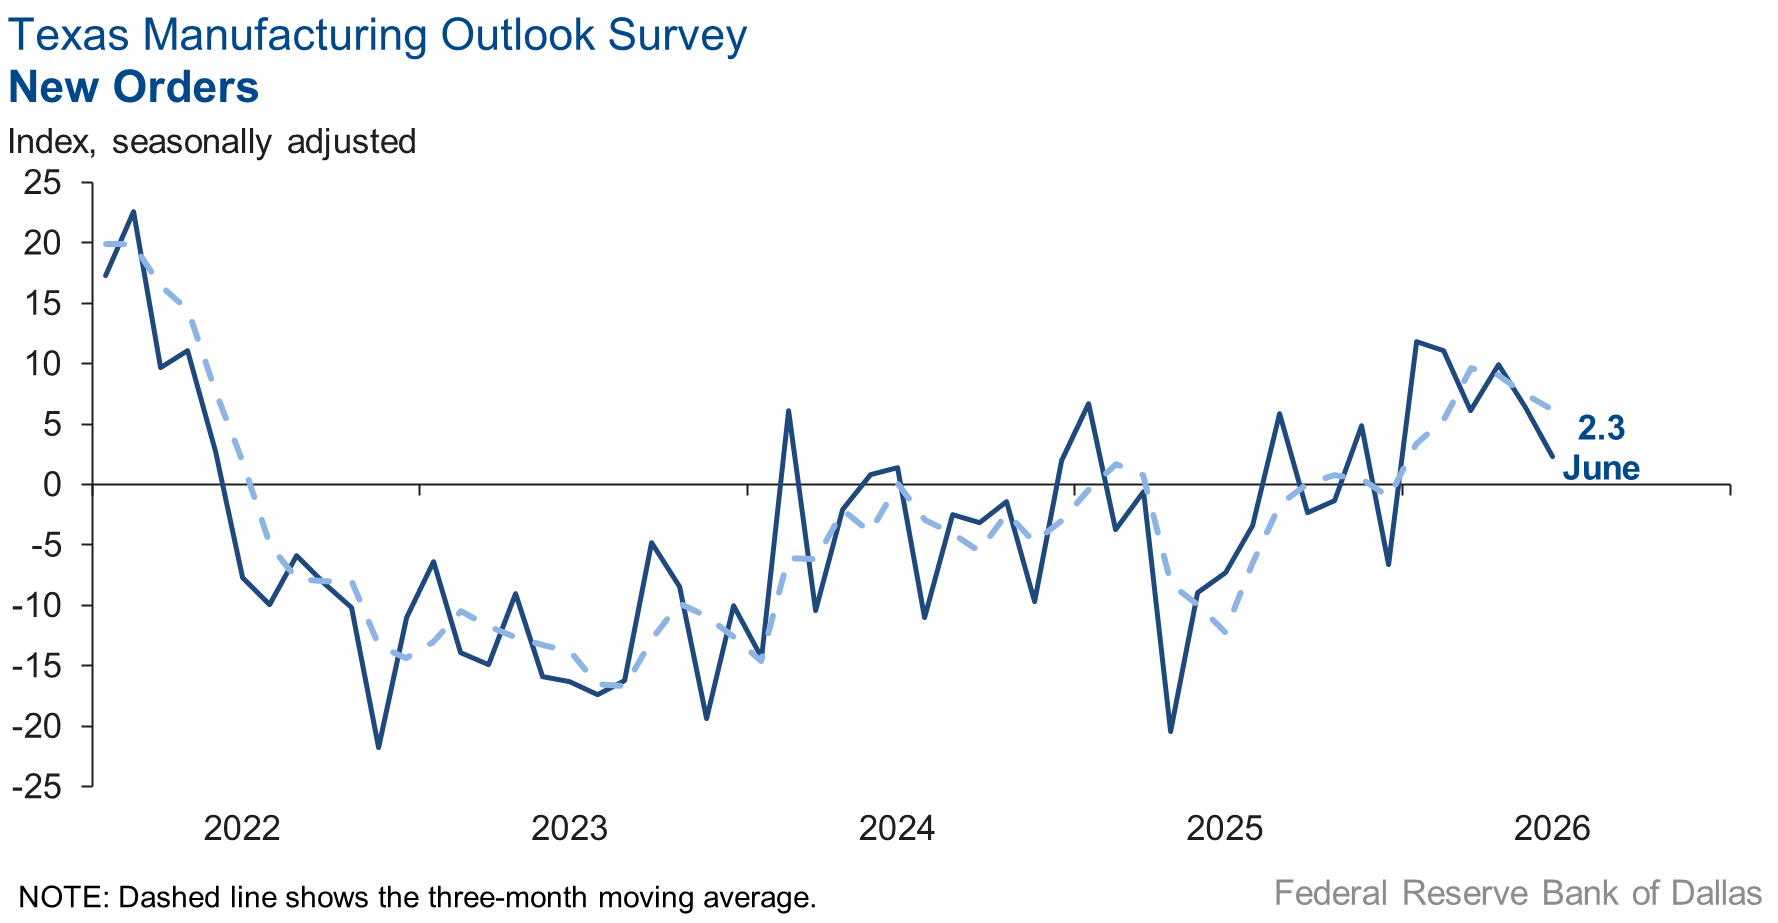
Other measures of manufacturing activity remained positive but showed signs of slower growth in demand. The capacity utilization index ticked up two points to 7.3, and the shipments index was unchanged at 7.1. However, the new orders index fell further, to 2.3 from 6.4.
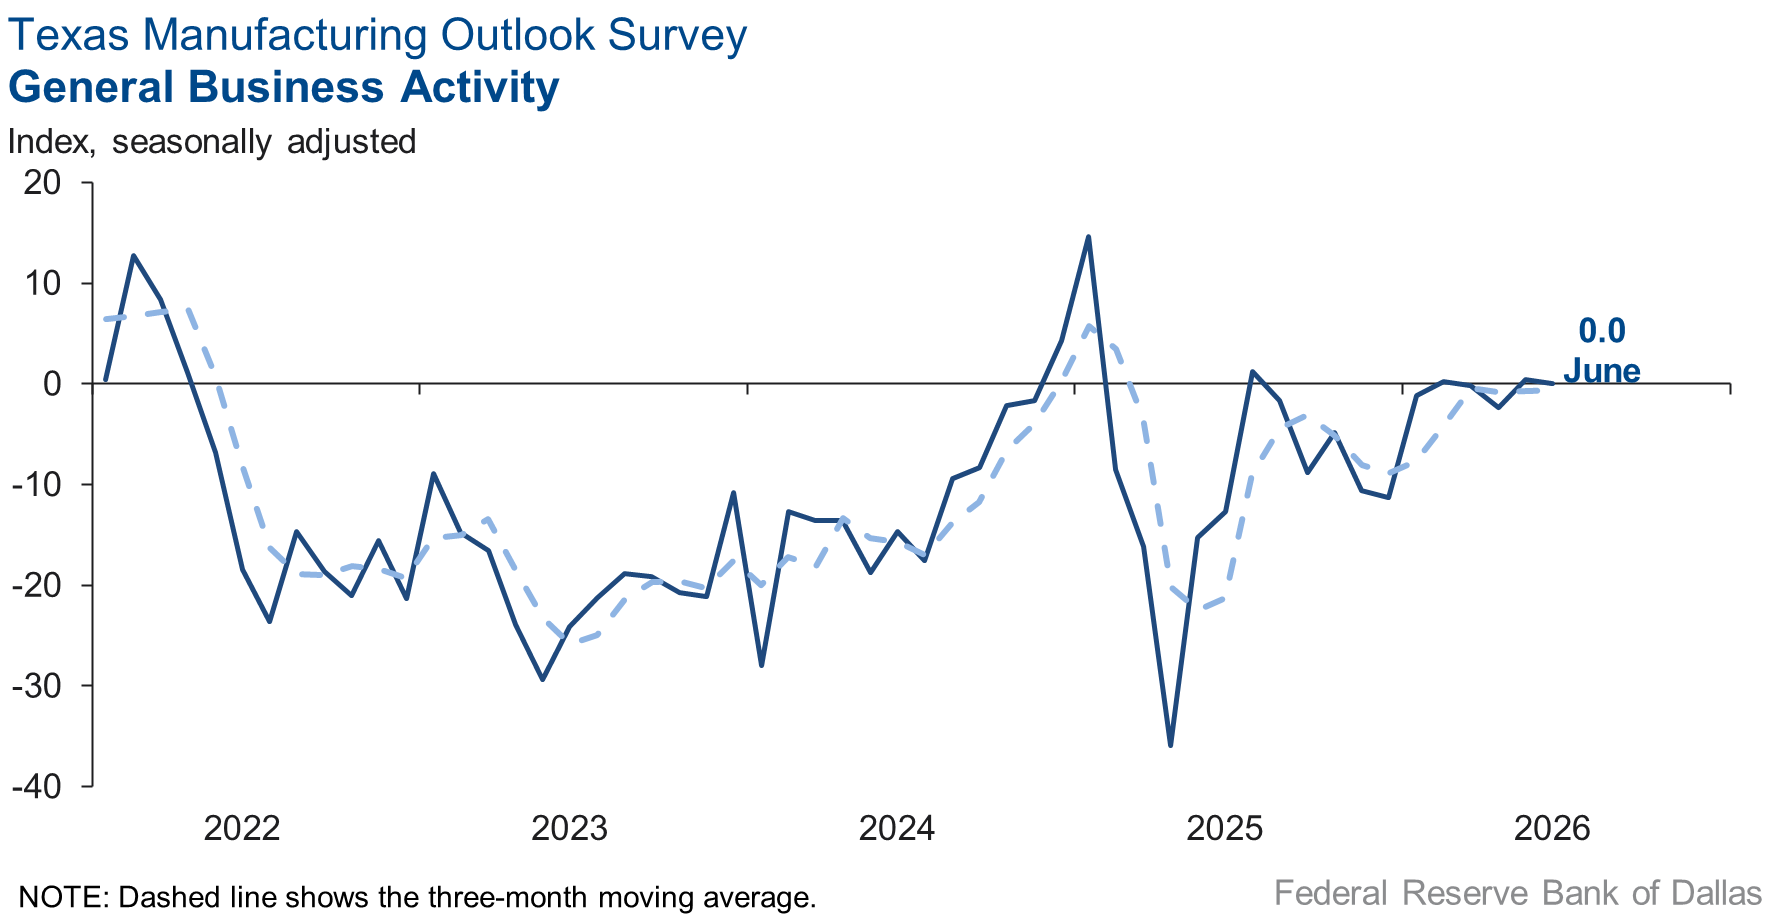
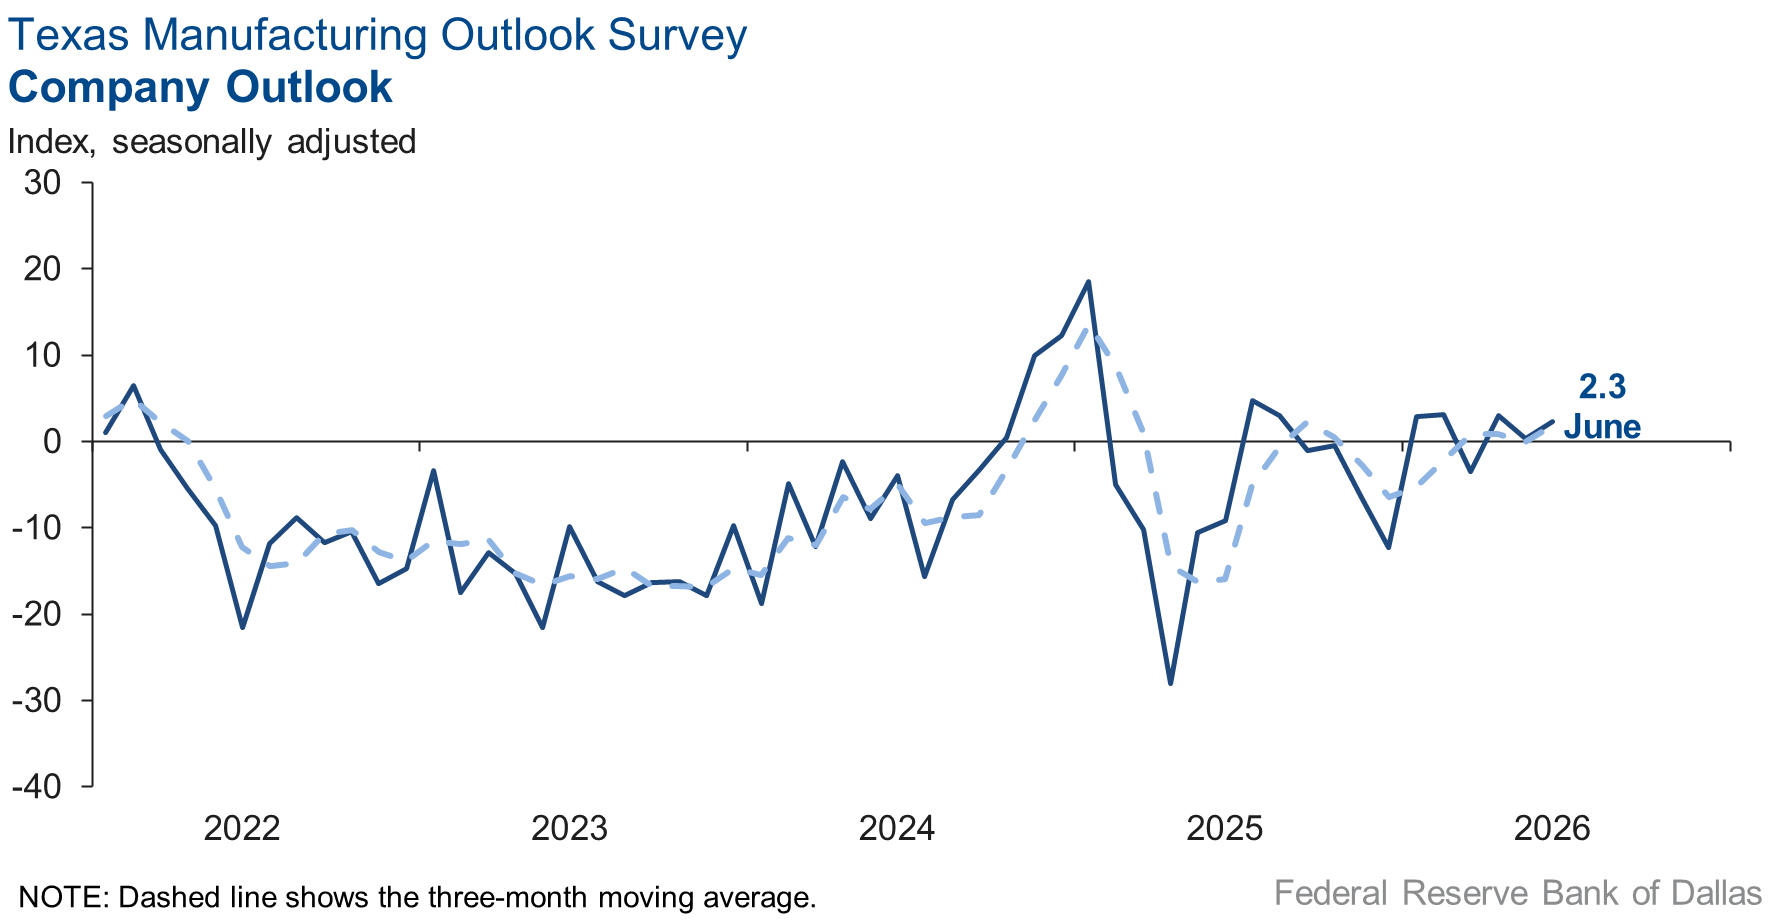
Perceptions of broader business conditions were fairly stable in June. The general business activity index was flat, with the zero reading indicating no change in activity from May. The company outlook index increased to 2.3 from 0.3, signaling a slight improvement in outlooks. The outlook uncertainty index fell eight points to 10.9.
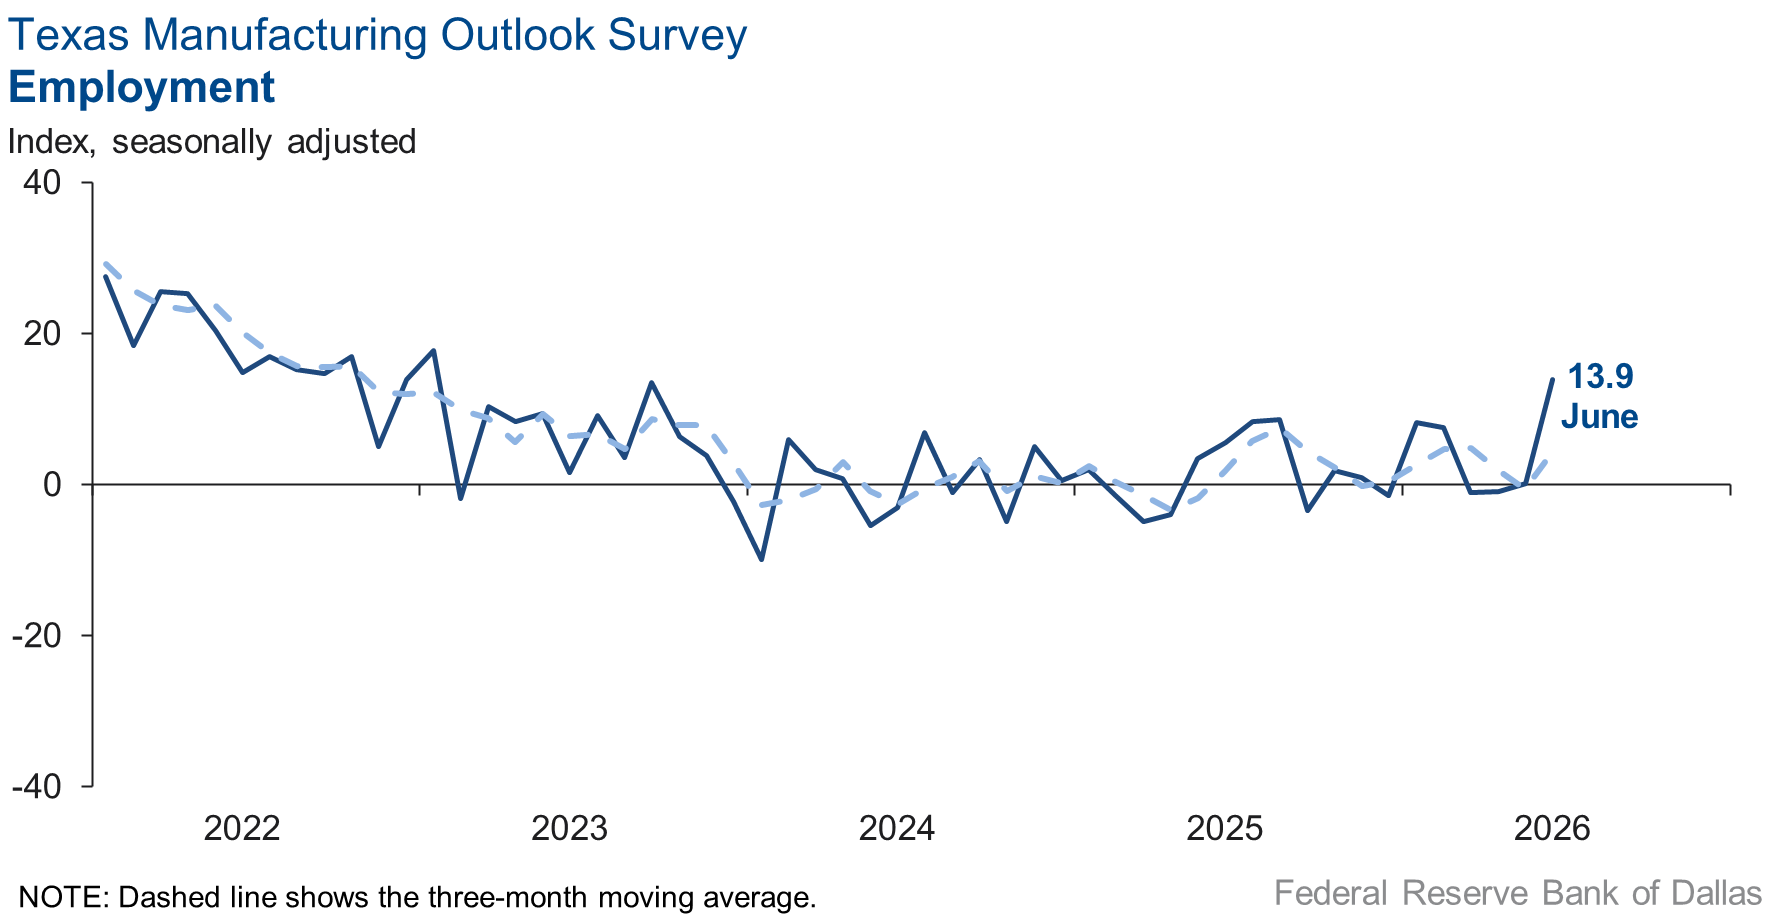
Employment growth resumed in June, and work hours rose. The employment index moved up to 13.9 from 0.2. The hours worked index increased four points to 5.9.
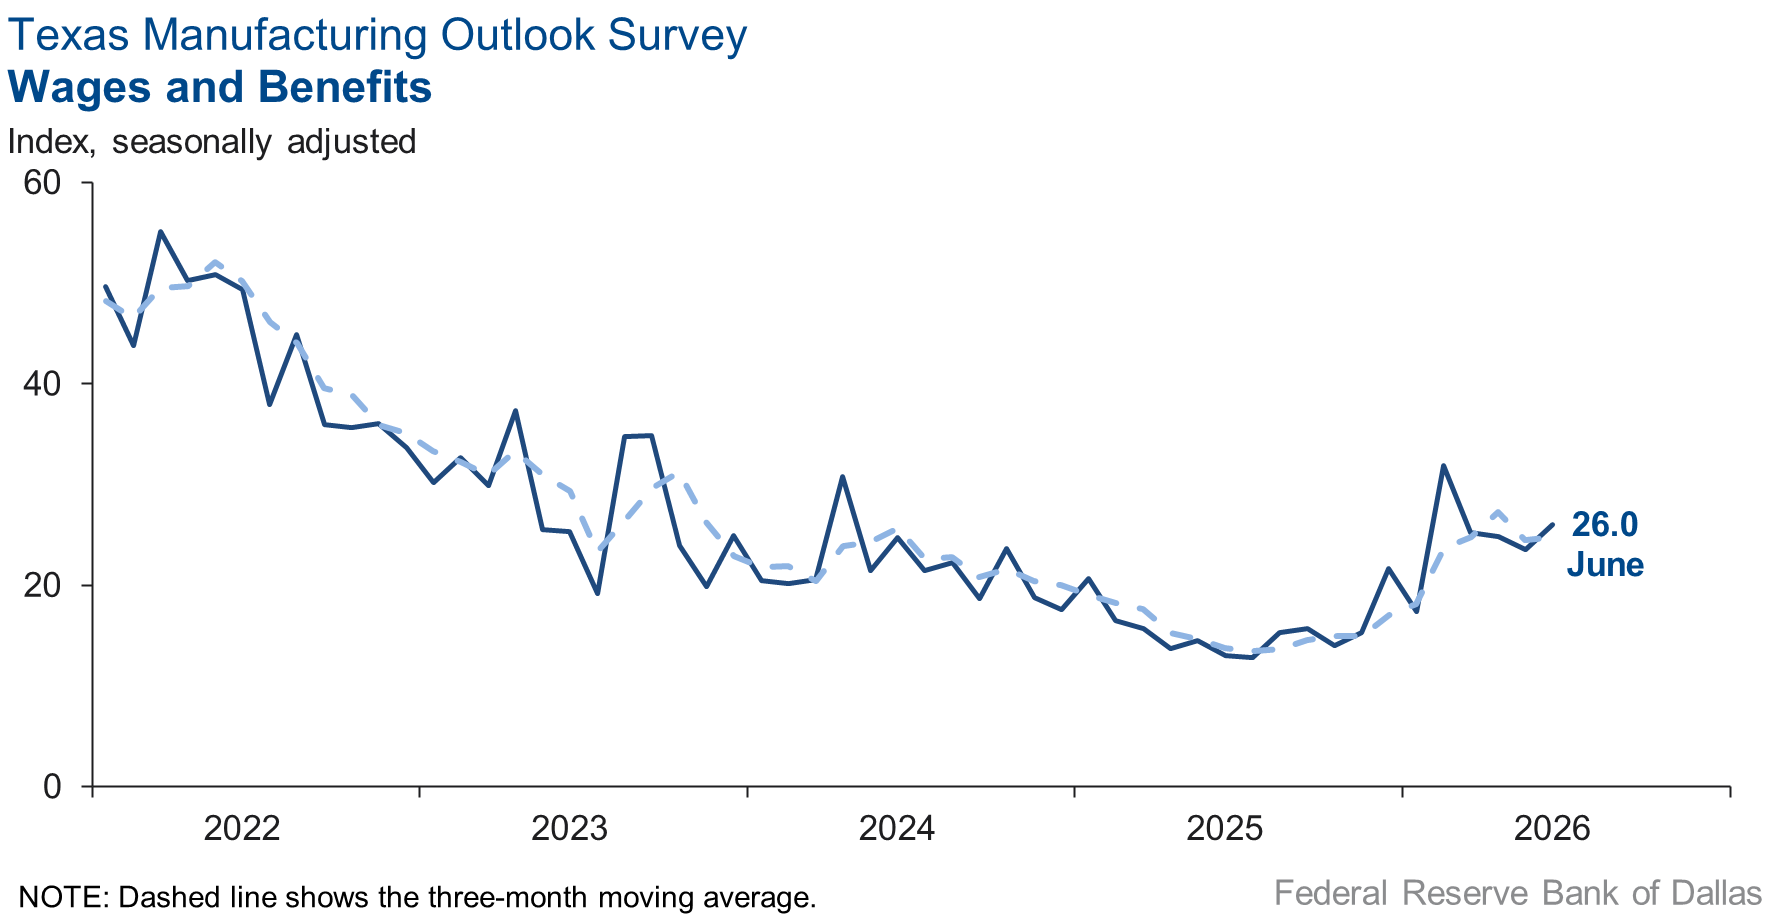
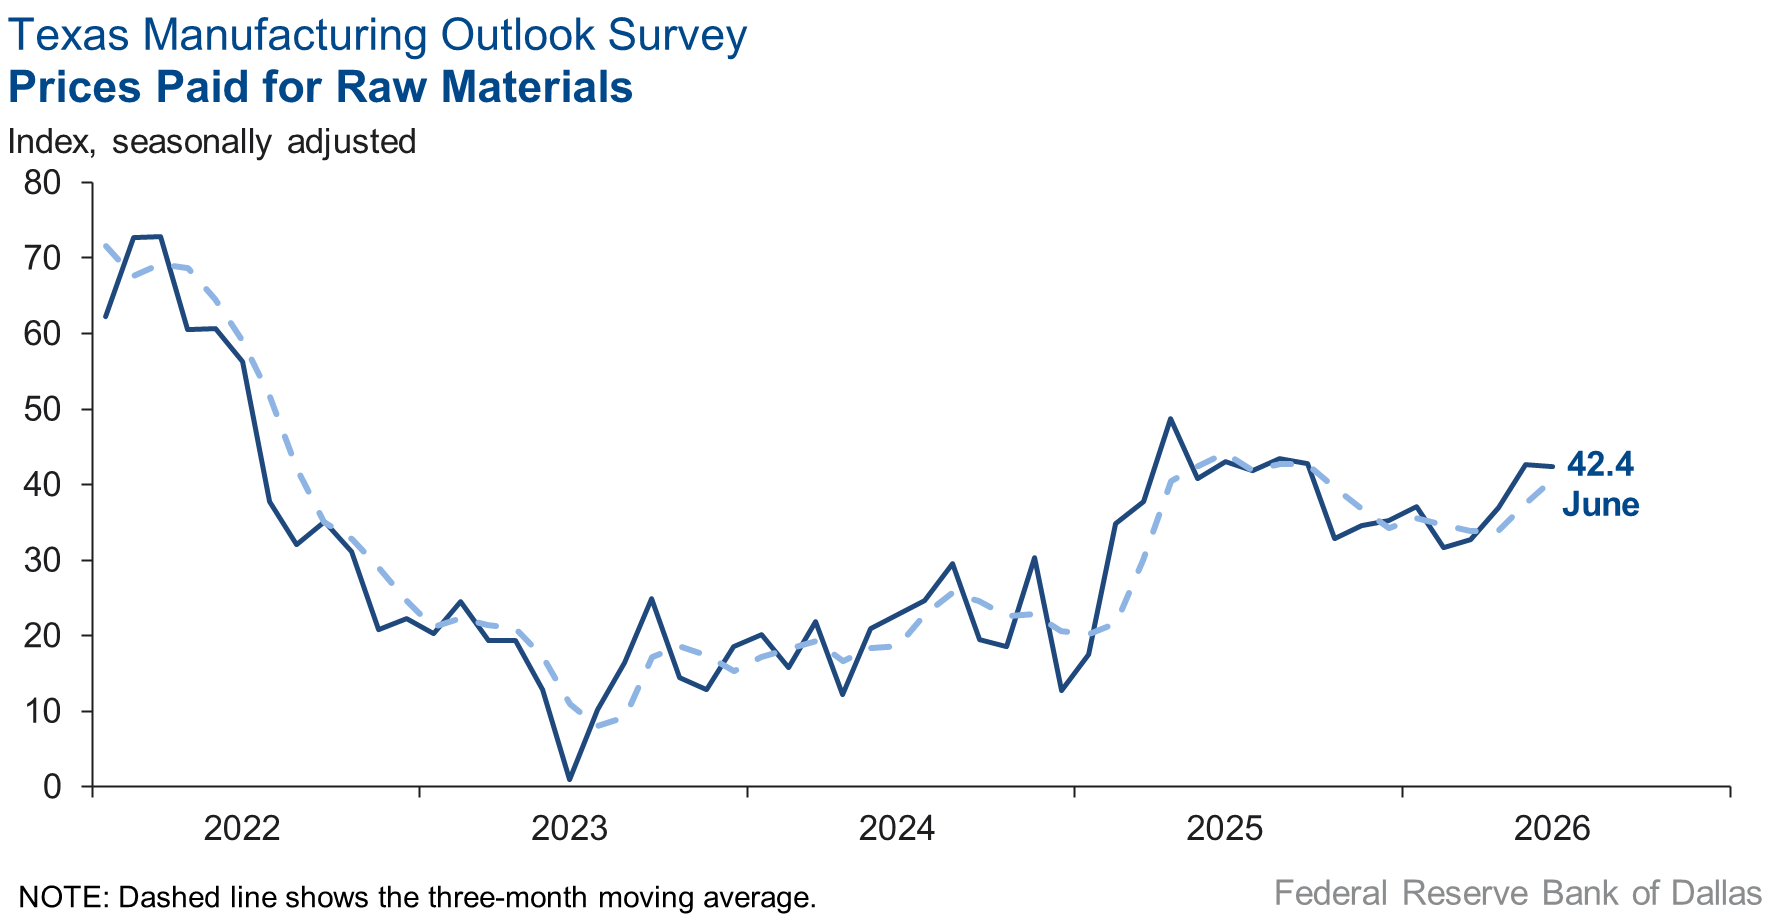
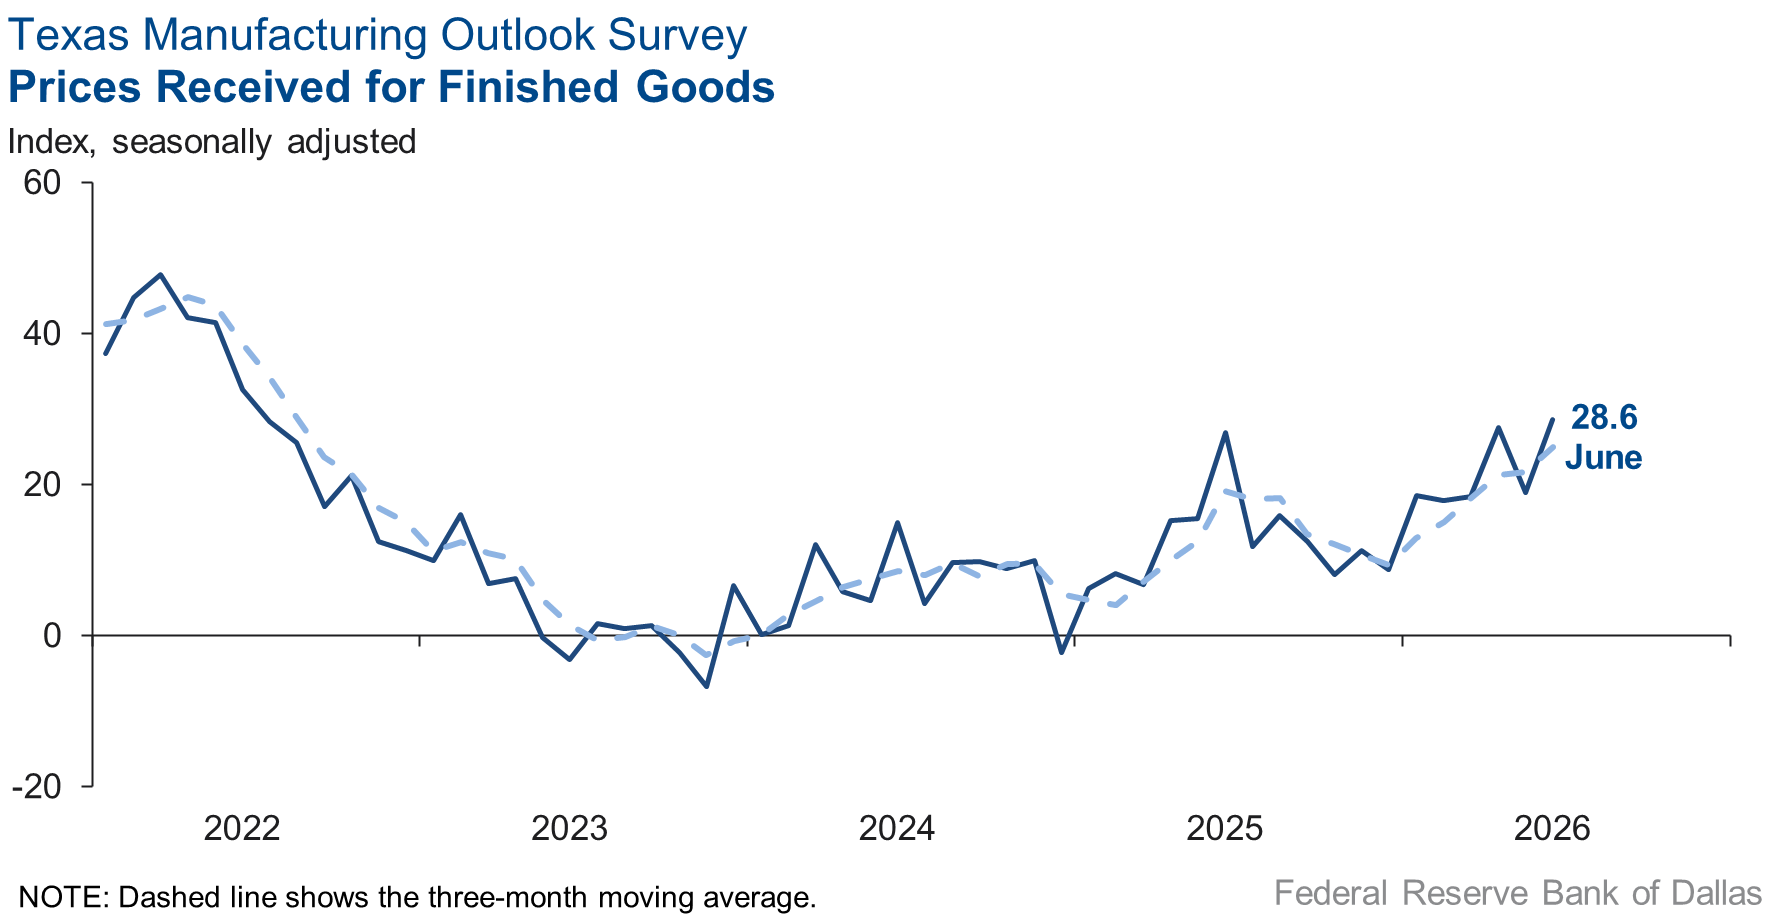
Selling price and wage pressures increased, while input price pressures held steady. The finished goods prices index rose 10 points to 28.6. The raw materials prices index remained unchanged at 42.4. The wages and benefits index ticked up two points to 26.0.
Expectations are for increased manufacturing activity six months from now. The future production index fell two points to 34.8, and the future general business activity index jumped 12 points to 25.9. Other indexes of future manufacturing activity remained in positive territory.
Next release: Monday, July 27
Data were collected June 16–24, and 64 of the 112 Texas manufacturers surveyed submitted responses. The Dallas Fed conducts the Texas Manufacturing Outlook Survey monthly to obtain a timely assessment of the state’s factory activity. Firms are asked whether output, employment, orders, prices and other indicators increased, decreased or remained unchanged over the previous month.
Survey responses are used to calculate an index for each indicator. Each index is calculated by subtracting the percentage of respondents reporting a decrease from the percentage reporting an increase. When the share of firms reporting an increase exceeds the share reporting a decrease, the index will be greater than zero, suggesting the indicator has increased over the prior month. If the share of firms reporting a decrease exceeds the share reporting an increase, the index will be below zero, suggesting the indicator has decreased over the prior month. An index will be zero when the number of firms reporting an increase is equal to the number of firms reporting a decrease. Data have been seasonally adjusted as necessary.
Results summary
Historical data are available from June 2004 to the most current release month.
| Business Indicators Relating to Facilities and Products in Texas Current (versus previous month) | ||||||||
| Indicator | Jun Index | May Index | Change | Series Average | Trend* | % Reporting Increase | % Reporting No Change | % Reporting Decrease |
Production | 4.1 | 9.4 | –5.3 | 9.6 | 6(+) | 30.1 | 43.9 | 26.0 |
Capacity Utilization | 7.3 | 5.2 | +2.1 | 7.5 | 6(+) | 30.6 | 46.2 | 23.3 |
New Orders | 2.3 | 6.4 | –4.1 | 4.7 | 6(+) | 27.4 | 47.4 | 25.1 |
Growth Rate of Orders | –2.0 | –2.9 | +0.9 | –1.1 | 2(–) | 21.4 | 55.2 | 23.4 |
Unfilled Orders | –2.8 | 3.3 | –6.1 | –2.7 | 1(–) | 9.9 | 77.4 | 12.7 |
Shipments | 7.1 | 7.4 | –0.3 | 7.8 | 6(+) | 29.1 | 48.8 | 22.0 |
Delivery Time | 0.9 | 1.4 | –0.5 | 0.5 | 2(+) | 9.5 | 81.9 | 8.6 |
Finished Goods Inventories | 7.8 | –12.0 | +19.8 | –3.3 | 1(+) | 23.4 | 60.9 | 15.6 |
Prices Paid for Raw Materials | 42.4 | 42.7 | –0.3 | 27.8 | 74(+) | 47.6 | 47.2 | 5.2 |
Prices Received for Finished Goods | 28.6 | 18.9 | +9.7 | 9.1 | 18(+) | 31.6 | 65.4 | 3.0 |
Wages and Benefits | 26.0 | 23.6 | +2.4 | 21.1 | 74(+) | 29.0 | 68.0 | 3.0 |
Employment | 13.9 | 0.2 | +13.7 | 7.1 | 2(+) | 20.8 | 72.3 | 6.9 |
Hours Worked | 5.9 | 1.8 | +4.1 | 3.0 | 6(+) | 17.0 | 71.9 | 11.1 |
Capital Expenditures | 11.4 | 6.0 | +5.4 | 6.6 | 4(+) | 20.9 | 69.6 | 9.5 |
| General Business Conditions Current (versus previous month) | ||||||||
| Indicator | Jun Index | May Index | Change | Series Average | Trend** | % Reporting Improved | % Reporting No Change | % Reporting Worsened |
Company Outlook | 2.3 | 0.3 | +2.0 | 4.0 | 3(+) | 19.9 | 62.6 | 17.6 |
General Business Activity | 0.0 | 0.4 | –0.4 | 0.2 | 1() | 23.1 | 53.8 | 23.1 |
| Indicator | Jun Index | May Index | Change | Series Average | Trend* | % Reporting Increase | % Reporting No Change | % Reporting Decrease |
Outlook Uncertainty | 10.9 | 19.2 | –8.3 | 16.9 | 6(+) | 25.0 | 60.9 | 14.1 |
| Business Indicators Relating to Facilities and Products in Texas Future (six months ahead) | ||||||||
| Indicator | Jun Index | May Index | Change | Series Average | Trend* | % Reporting Increase | % Reporting No Change | % Reporting Decrease |
Production | 34.8 | 36.8 | –2.0 | 36.0 | 74(+) | 46.1 | 42.7 | 11.3 |
Capacity Utilization | 33.8 | 28.5 | +5.3 | 32.8 | 74(+) | 45.6 | 42.6 | 11.8 |
New Orders | 35.5 | 28.6 | +6.9 | 33.4 | 44(+) | 46.5 | 42.4 | 11.0 |
Growth Rate of Orders | 28.3 | 12.9 | +15.4 | 24.6 | 34(+) | 41.1 | 46.1 | 12.8 |
Unfilled Orders | 3.4 | 0.0 | +3.4 | 2.7 | 1(+) | 11.8 | 79.8 | 8.4 |
Shipments | 35.1 | 33.7 | +1.4 | 34.3 | 74(+) | 45.8 | 43.5 | 10.7 |
Delivery Time | 5.5 | 3.1 | +2.4 | –1.3 | 2(+) | 13.7 | 78.1 | 8.2 |
Finished Goods Inventories | –8.1 | –2.9 | –5.2 | –0.2 | 2(–) | 11.3 | 69.4 | 19.4 |
Prices Paid for Raw Materials | 32.0 | 44.9 | –12.9 | 34.1 | 75(+) | 41.7 | 48.5 | 9.7 |
Prices Received for Finished Goods | 27.5 | 28.1 | –0.6 | 21.8 | 74(+) | 32.3 | 62.9 | 4.8 |
Wages and Benefits | 45.8 | 37.9 | +7.9 | 39.0 | 265(+) | 49.2 | 47.5 | 3.4 |
Employment | 25.4 | 17.9 | +7.5 | 22.7 | 73(+) | 36.1 | 53.2 | 10.7 |
Hours Worked | 10.8 | 11.8 | –1.0 | 8.5 | 4(+) | 15.8 | 79.2 | 5.0 |
Capital Expenditures | 27.0 | 12.6 | +14.4 | 19.4 | 73(+) | 37.9 | 51.2 | 10.9 |
| General Business Conditions Future (six months ahead) | ||||||||
| Indicator | Jun Index | May Index | Change | Series Average | Trend** | % Reporting Increase | % Reporting No Change | % Reporting Worsened |
Company Outlook | 28.5 | 16.5 | +12.0 | 18.3 | 14(+) | 39.3 | 49.9 | 10.8 |
General Business Activity | 25.9 | 14.3 | +11.6 | 12.4 | 14(+) | 36.6 | 52.7 | 10.7 |
*Shown is the number of consecutive months of expansion or contraction in the underlying indicator. Expansion is indicated by a positive index reading and denoted by a (+) in the table. Contraction is indicated by a negative index reading and denoted by a (–) in the table.
**Shown is the number of consecutive months of improvement or worsening in the underlying indicator. Improvement is indicated by a positive index reading and denoted by a (+) in the table. Worsening is indicated by a negative index reading and denoted by a (–) in the table.
Data have been seasonally adjusted as necessary.
Comments from survey respondents
Survey participants are given the opportunity to submit comments on current issues that may be affecting their businesses. Some comments have been edited for grammar and clarity.
- The truce with Iran would reduce uncertainty if we believed it would hold. Still don't know how soon fuel costs will come down and if there are any lingering effects of the spike in fuel costs.
- Lower interest rates, please
- We see slower demand in second half but still generally strong business climate for us.
- Disarray at USDA, legislative deadlock and fear from legislators if they cross the current administration, as well as diminished purchasing power within our target markets outside the federal government, have stymied us.
- We have successfully onboarded four new customers year-to-date, and demand has increased significantly since the beginning of 2026.
- USMCA discussions taking place without industry players in the room. Section 232 metals and automotive tariffs still loom large and painful.
- Last survey, we reported that we believed it was slowing down, and this quarter confirms it.
- Business seems to be more stable, with a steady stream of new orders.
- Consumers are clearly feeling the pinch of inflation.
- Activity levels are flatlined, but raw material costs are going up, and also our selling prices. Margins have compressed.
- Input prices related to the price of oil are working through the system now. Those will not come back down.
- Unrecoverable freight and fuel cost increases.
- We produce plastic products, which have had dramatic price increases in resins, in the 40 to -50 percent range, all war-related. This is very disruptive as it creates an inflationary mentality.
- May was a good month for us, and June should be as well. We are encouraged by some large job activity that perhaps things will be improving. It has been a very rough seven months out of nine for this fiscal year.
- The increasing raw materials costs and antidumping suits being filed in our commercial transport industry are causing uncertainty with our original equipment manufacturer and fleet customers.
- Still see volatility in pricing of raw materials coming from Asia, particularly tungsten, where 80 percent of it worldwide is produced in China.
Historical Data
Historical data can be downloaded dating back to June 2004.
Indexes
Download indexes for all indicators. For the definitions of all variables, see Data Definitions.
| Unadjusted |
| Seasonally adjusted |
All Data
Download indexes and components of the indexes (percentage of respondents reporting increase, decrease, or no change). For the definitions of all variables, see Data Definitions.
| Unadjusted |
| Seasonally adjusted |
Special questions
For this month’s survey, Texas business executives were asked supplemental questions on wages, prices and outlook concerns. Results below include responses from participants from both the Texas Manufacturing Outlook Survey and Texas Service Sector Outlook Survey. View individual survey results.
Questions regarding the Texas Business Outlook Surveys can be addressed to Jesus Cañas.
Sign up for our email alert to be automatically notified as soon as the latest Texas Manufacturing Outlook Survey is released on the web.