Texas Manufacturing Outlook Survey


Texas manufacturing activity accelerates as outlooks improve further
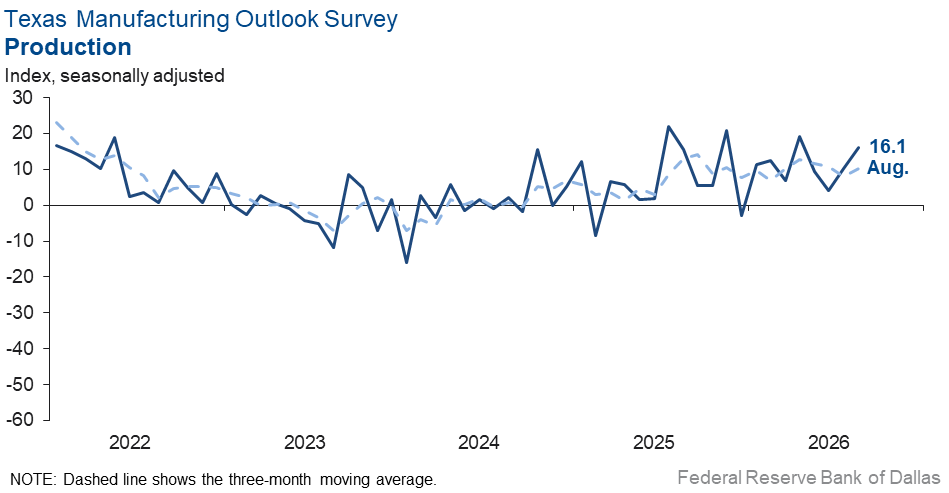
Texas manufacturing output growth accelerated in August, according to business executives responding to the Texas Manufacturing Outlook Survey. The production index, a key measure of state manufacturing conditions, increased six points to 16.1.
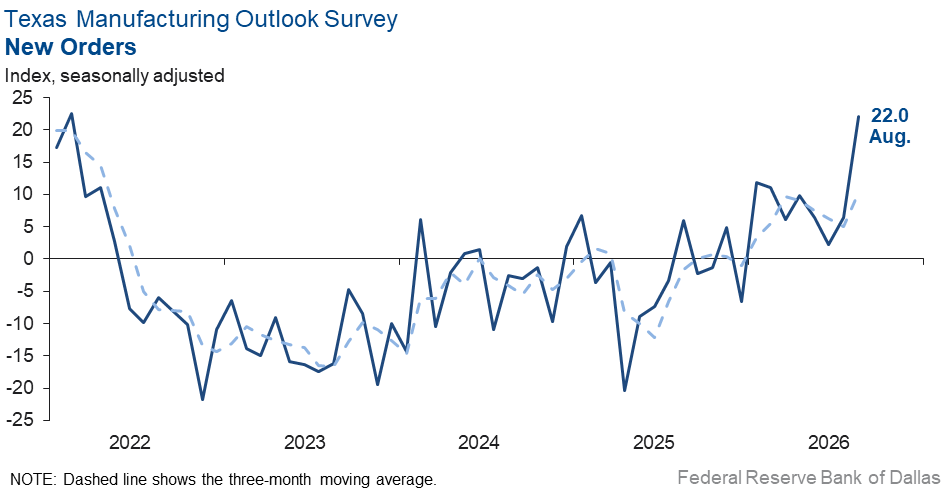
Other measures of manufacturing activity also pointed to faster growth this month. The new orders index jumped 16 points to 22.0. The capacity utilization index increased to 12.8 from 5.9, and the shipments index increased five points to 14.1.
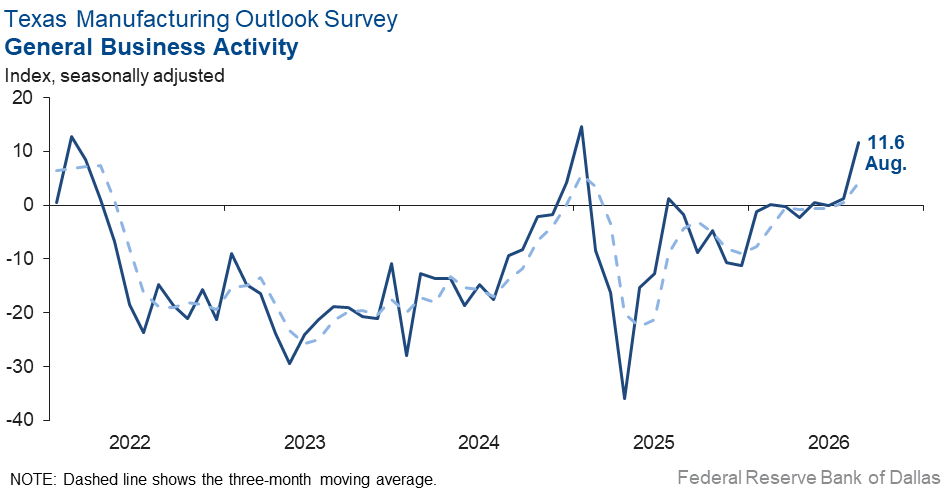
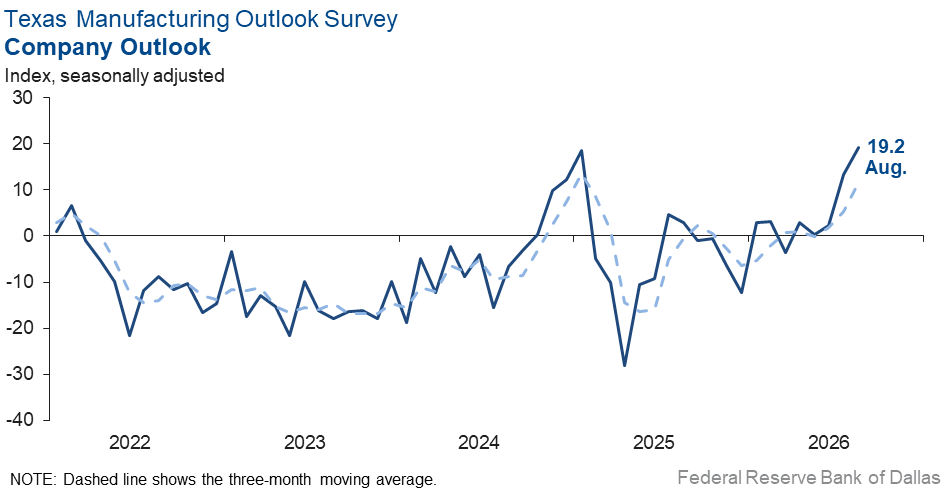
Perceptions of broader business conditions improved in August. The general business activity index increased to 11.6 from 1.3, and the company outlook index improved further to 19.2 from 13.4. The outlook uncertainty index ticked up two points to 8.7.
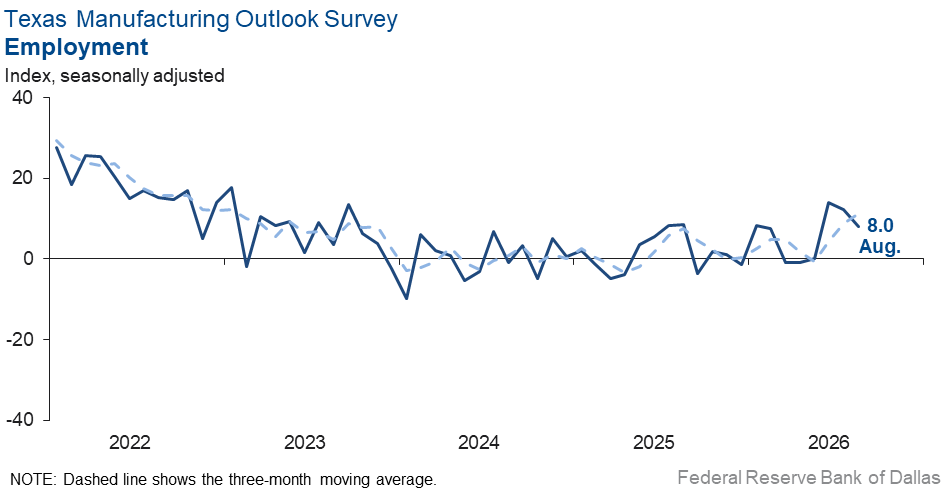
Employment growth slowed slightly and work hours were relatively stable in August. The employment index dipped four points to 8.0. The hours worked index edged up to 5.9 from 4.3.
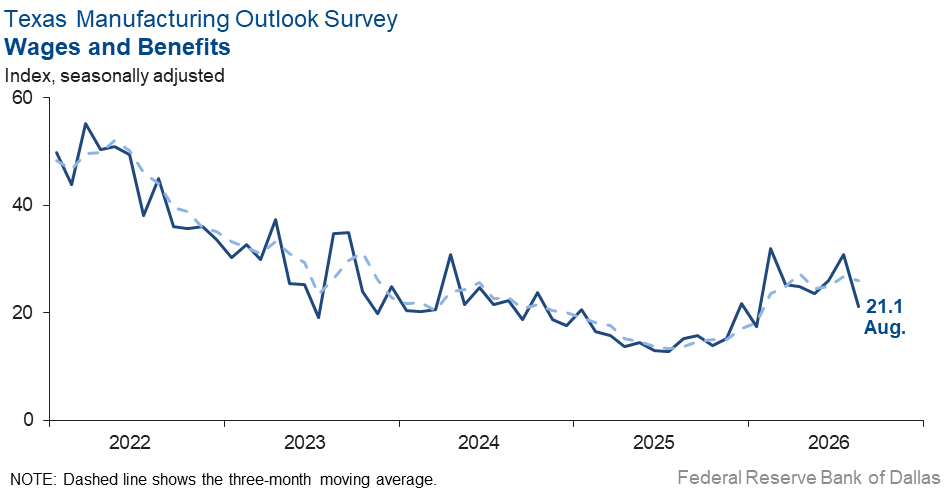
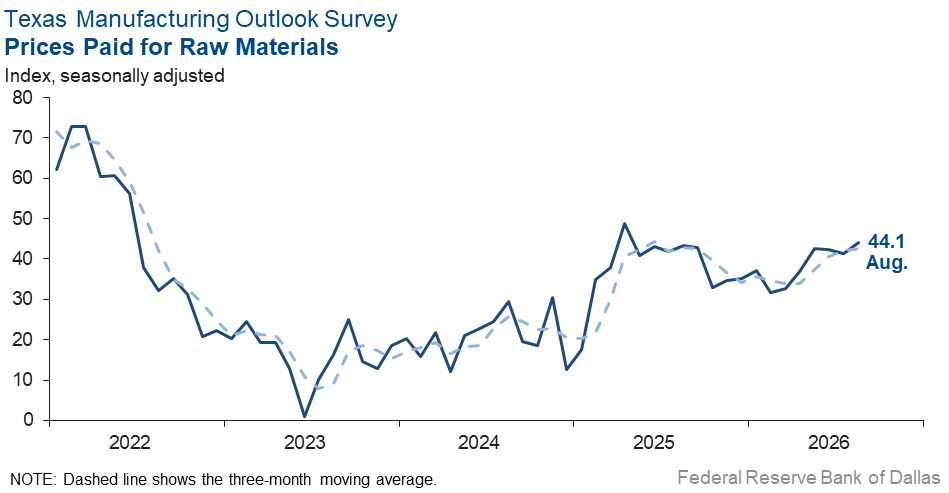
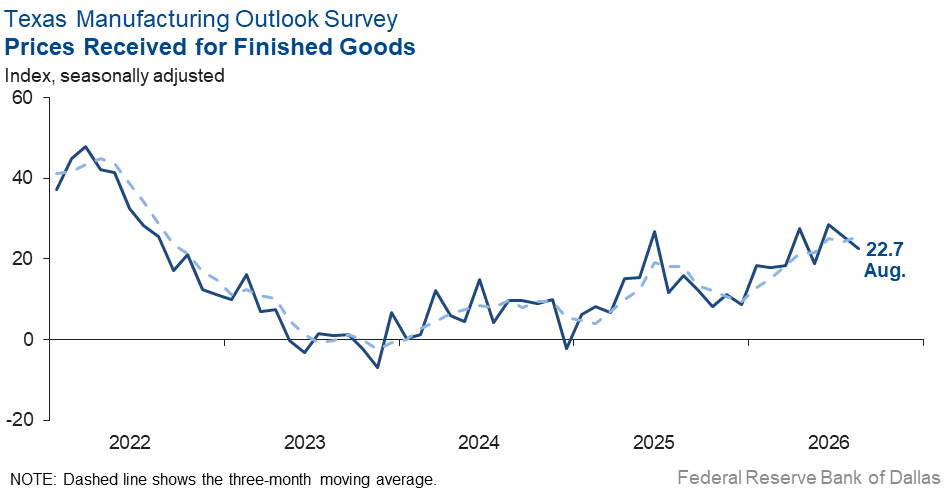
Price pressures were relatively stable but remained markedly elevated while wage pressures eased in August. The finished goods prices index fell three points to 22.7, while the raw materials prices index increased three points to 44.1. The wages and benefits index fell 10 points to 21.1.
Expectations are for increased manufacturing activity six months from now. The future production index increased six points to 40.9, while the future general business activity index increased 11 points to 37.2. Other indexes of future manufacturing activity remained in positive territory.
Next release: Monday, September 28
Data were collected August 18–26, and 69 of the 112 Texas manufacturers surveyed submitted responses. The Dallas Fed conducts the Texas Manufacturing Outlook Survey monthly to obtain a timely assessment of the state’s factory activity. Firms are asked whether output, employment, orders, prices and other indicators increased, decreased or remained unchanged over the previous month.
Survey responses are used to calculate an index for each indicator. Each index is calculated by subtracting the percentage of respondents reporting a decrease from the percentage reporting an increase. When the share of firms reporting an increase exceeds the share reporting a decrease, the index will be greater than zero, suggesting the indicator has increased over the prior month. If the share of firms reporting a decrease exceeds the share reporting an increase, the index will be below zero, suggesting the indicator has decreased over the prior month. An index will be zero when the number of firms reporting an increase is equal to the number of firms reporting a decrease. Data have been seasonally adjusted as necessary.
Results summary
Historical data are available from June 2004 to the most current release month.
| Business Indicators Relating to Facilities and Products in Texas Current (versus previous month) | ||||||||
| Indicator | Aug Index | Jul Index | Change | Series Average | Trend* | % Reporting Increase | % Reporting No Change | % Reporting Decrease |
Production | 16.1 | 10.1 | +6.0 | 9.6 | 8(+) | 36.2 | 43.7 | 20.1 |
Capacity Utilization | 12.8 | 5.9 | +6.9 | 7.5 | 8(+) | 32.5 | 47.8 | 19.7 |
New Orders | 22.0 | 6.4 | +15.6 | 4.7 | 8(+) | 44.0 | 33.9 | 22.0 |
Growth Rate of Orders | 8.1 | –0.4 | +8.5 | –1.1 | 1(+) | 27.3 | 53.5 | 19.2 |
Unfilled Orders | –1.3 | –2.0 | +0.7 | –2.7 | 3(–) | 15.1 | 68.5 | 16.4 |
Shipments | 14.1 | 8.8 | +5.3 | 7.8 | 8(+) | 35.3 | 43.5 | 21.2 |
Delivery Time | 12.5 | 2.3 | +10.2 | 0.6 | 4(+) | 18.6 | 75.3 | 6.1 |
Finished Goods Inventories | 2.9 | 1.5 | +1.4 | –3.3 | 3(+) | 17.4 | 68.1 | 14.5 |
Prices Paid for Raw Materials | 44.1 | 41.3 | +2.8 | 27.9 | 76(+) | 48.6 | 46.9 | 4.5 |
Prices Received for Finished Goods | 22.7 | 25.6 | –2.9 | 9.2 | 20(+) | 29.0 | 64.7 | 6.3 |
Wages and Benefits | 21.1 | 30.8 | –9.7 | 21.1 | 76(+) | 22.9 | 75.3 | 1.8 |
Employment | 8.0 | 12.2 | –4.2 | 7.1 | 4(+) | 18.0 | 72.0 | 10.0 |
Hours Worked | 5.9 | 4.3 | +1.6 | 3.0 | 8(+) | 17.5 | 70.9 | 11.6 |
Capital Expenditures | 8.2 | 12.2 | –4.0 | 6.7 | 6(+) | 21.4 | 65.4 | 13.2 |
| General Business Conditions Current (versus previous month) | ||||||||
| Indicator | Aug Index | Jul Index | Change | Series Average | Trend** | % Reporting Improved | % Reporting No Change | % Reporting Worsened |
Company Outlook | 19.2 | 13.4 | +5.8 | 4.1 | 5(+) | 33.0 | 53.2 | 13.8 |
General Business Activity | 11.6 | 1.3 | +10.3 | 0.2 | 2(+) | 31.9 | 47.8 | 20.3 |
| Indicator | Aug Index | Jul Index | Change | Series Average | Trend* | % Reporting Increase | % Reporting No Change | % Reporting Decrease |
Outlook Uncertainty | 8.7 | 6.4 | +2.3 | 16.7 | 8(+) | 21.7 | 65.2 | 13.0 |
| Business Indicators Relating to Facilities and Products in Texas Future (six months ahead) | ||||||||
| Indicator | Aug Index | Jul Index | Change | Series Average | Trend* | % Reporting Increase | % Reporting No Change | % Reporting Decrease |
Production | 40.9 | 34.6 | +6.3 | 36.0 | 76(+) | 50.4 | 40.1 | 9.5 |
Capacity Utilization | 38.6 | 29.7 | +8.9 | 32.8 | 76(+) | 46.8 | 44.9 | 8.2 |
New Orders | 42.4 | 29.2 | +13.2 | 33.4 | 46(+) | 48.5 | 45.4 | 6.1 |
Growth Rate of Orders | 41.0 | 24.6 | +16.4 | 24.7 | 36(+) | 44.4 | 52.2 | 3.4 |
Unfilled Orders | 15.3 | 11.7 | +3.6 | 2.8 | 3(+) | 22.3 | 70.7 | 7.0 |
Shipments | 45.2 | 30.3 | +14.9 | 34.3 | 76(+) | 52.1 | 41.0 | 6.9 |
Delivery Time | 15.4 | 2.3 | +13.1 | –1.2 | 4(+) | 17.6 | 80.2 | 2.2 |
Finished Goods Inventories | –1.6 | –1.7 | +0.1 | –0.2 | 4(–) | 13.6 | 71.2 | 15.2 |
Prices Paid for Raw Materials | 53.5 | 45.5 | +8.0 | 34.2 | 77(+) | 53.8 | 45.9 | 0.3 |
Prices Received for Finished Goods | 40.9 | 34.4 | +6.5 | 21.9 | 76(+) | 42.4 | 56.1 | 1.5 |
Wages and Benefits | 46.9 | 40.8 | +6.1 | 39.0 | 267(+) | 46.9 | 53.1 | 0.0 |
Employment | 34.5 | 20.1 | +14.4 | 22.7 | 75(+) | 40.1 | 54.3 | 5.6 |
Hours Worked | 15.6 | 4.8 | +10.8 | 8.5 | 6(+) | 17.1 | 81.4 | 1.5 |
Capital Expenditures | 25.9 | 25.9 | 0.0 | 19.4 | 75(+) | 33.5 | 58.9 | 7.6 |
| General Business Conditions Future (six months ahead) | ||||||||
| Indicator | Aug Index | Jul Index | Change | Series Average | Trend** | % Reporting Increase | % Reporting No Change | % Reporting Worsened |
Company Outlook | 35.3 | 28.7 | +6.6 | 18.4 | 16(+) | 40.7 | 53.9 | 5.4 |
General Business Activity | 37.2 | 26.5 | +10.7 | 12.5 | 16(+) | 42.2 | 52.8 | 5.0 |
*Shown is the number of consecutive months of expansion or contraction in the underlying indicator. Expansion is indicated by a positive index reading and denoted by a (+) in the table. Contraction is indicated by a negative index reading and denoted by a (–) in the table.
**Shown is the number of consecutive months of improvement or worsening in the underlying indicator. Improvement is indicated by a positive index reading and denoted by a (+) in the table. Worsening is indicated by a negative index reading and denoted by a (–) in the table.
Data have been seasonally adjusted as necessary.
Comments from survey respondents
Survey participants are given the opportunity to submit comments on current issues that may be affecting their businesses. Some comments have been edited for grammar and clarity.
- Part of what is increasing our uncertainty is specific to us. Highway construction in our area is beginning to influence our number of visitors. We expect this to be an issue for a number of years.
- All of our customers seem to be getting used to uncertainty. Headlines about Iran, Russia and China don't seem to be affecting demand as much as they did last year. Having the tariffs go away, or at least be reduced, is a benefit to us. We are still seeing input cost inflation, particularly in copper and as we hire new employees.
- Uncertainty happens in our industry when there is a risk of higher interest rates, contributing to a decrease in confidence among industrial customers and it delays projects tremendously.
- Uncertainty and instability at the federal level.
- Had some customers load up on inventory in July, which has caused us to have a slower August than expected.
- Geopolitical uncertainty and immigration issues are still worrisome.
- We are seeing dramatic price increases in some metals.
- We are definitely in a slowdown.
- Our manufacturing has increased significantly and we have invested in new and more automated manufacturing equipment.
- It's a great season of productivity and prosperity across all of our business lines. It's rare, but we're thankful to be firing on all cylinders! To what do we give the credit? Well, it's hard to say exactly. Our current administration has done much to support our growth. Interest rates are stable enough to allow our customers to make investments. Geopolitical issues have been a positive in our industry overall. We're blessed to be able to source good labor at fair rates. Ultimately, it's a lot of answered prayers, bottom line! Yes, we have good leadership, and the general economy has provided favorable tailwinds. Business remains strong with a large new job starting production this month.
- Our consumers are clearly feeling economic pressure.
- High retail prices for regular consumer charges hurts our business.
- Raw material increases announced. Slight uptick in overall business.
- Our industry was positively impacted by the recent administration actions strengthening Section 232 tariffs on aluminum products. These measures have encouraged more onshoring of business and have helped support investment, jobs and capacity within the U.S. aluminum industry. Since those actions were implemented, however, we are seeing increasing efforts particularly involving China and other Asian countries to circumvent U.S. tariffs. This includes transshipment and other methods of moving aluminum products through third countries and into the United States, including through our neighboring countries and U.S. territories. This is a serious concern for the domestic aluminum industry. If the Section 232 tariffs on aluminum from Canada and Mexico are reduced, it could create an economic advantage and a pathway for additional imports, particularly Chinese material, to enter the United States through North American supply chains. That could undermine the very domestic manufacturing capacity and jobs that the current tariff policy was intended to protect. The goal should not simply be to shift where imported aluminum enters the United States. The goal should be to build and maintain a competitive, reliable domestic aluminum supply chain that serves America's strategic and economic interests. Weakening the tariff structure could ultimately result in lost U.S. jobs, reduced investment, and the loss of critical domestic extrusion and manufacturing capacity.
- Activity levels feel slower and less than in years past for August. We are still feasting on the large jobs that we won months ago, and we need to find some other large projects to carry us through the fall months. We are very concerned about the overall state of the economy with all the chaos out of Washington, D.C. plus ongoing issues overseas and how that may impact our business activity.
- Our business-to-business customers are regaining confidence in CapEx spending as they need to catch up after 1-2 years of not buying new trucking equipment.
Historical Data
Historical data can be downloaded dating back to June 2004.
Indexes
Download indexes for all indicators. For the definitions of all variables, see Data Definitions.
| Unadjusted |
| Seasonally adjusted |
All Data
Download indexes and components of the indexes (percentage of respondents reporting increase, decrease, or no change). For the definitions of all variables, see Data Definitions.
| Unadjusted |
| Seasonally adjusted |
Special questions
For this month’s survey, Texas business executives were asked supplemental questions on demand and margins. Results below include responses from participants from both the Texas Manufacturing Outlook Survey and Texas Service Sector Outlook Survey. View individual survey results.
Questions regarding the Texas Business Outlook Surveys can be addressed to Jesus Cañas.
Sign up for our email alert to be automatically notified as soon as the latest Texas Manufacturing Outlook Survey is released on the web.