Texas Manufacturing Outlook Survey


Texas manufacturing activity accelerates sharply even as outlook moderates
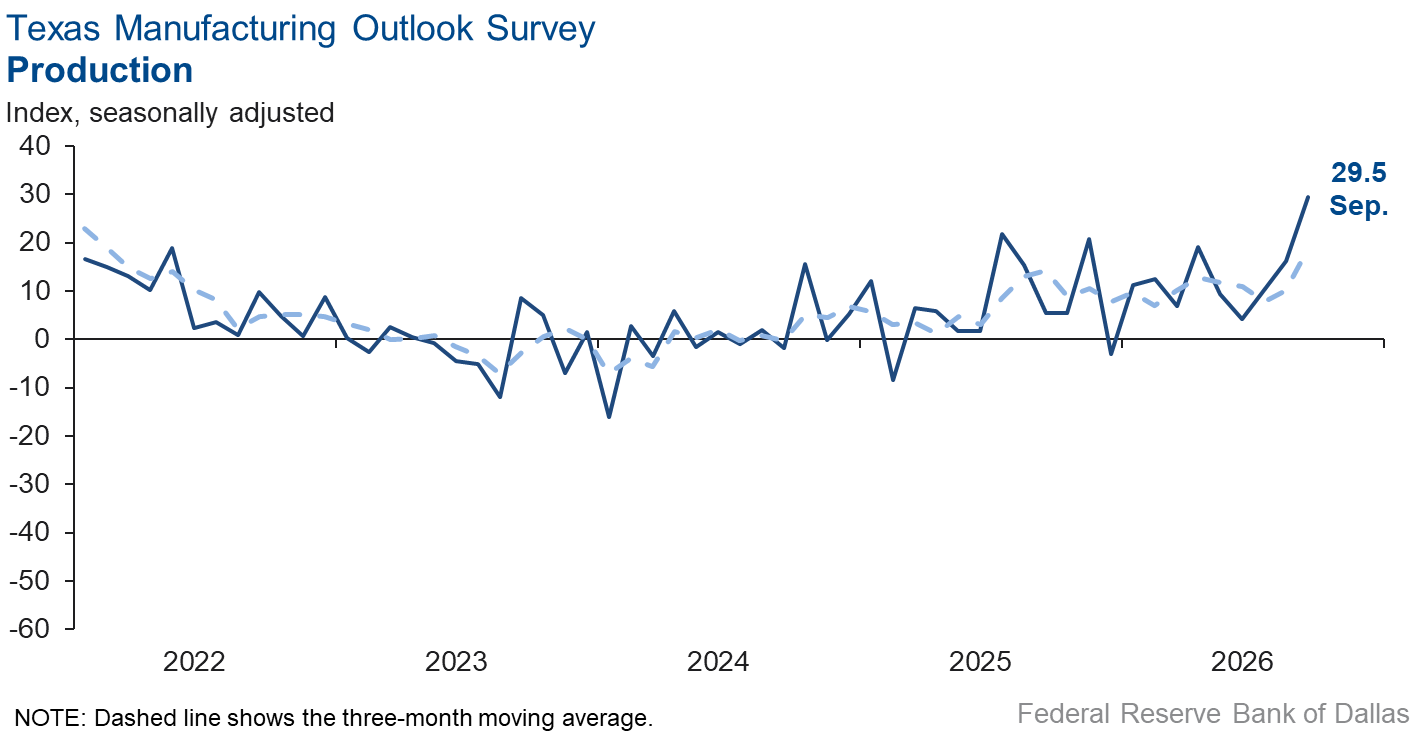
Texas manufacturing output growth accelerated sharply in September, according to business executives responding to the Texas Manufacturing Outlook Survey. The production index, a key measure of state manufacturing conditions, jumped 13 points to 29.5, a reading suggestive of a robust pace of output expansion.
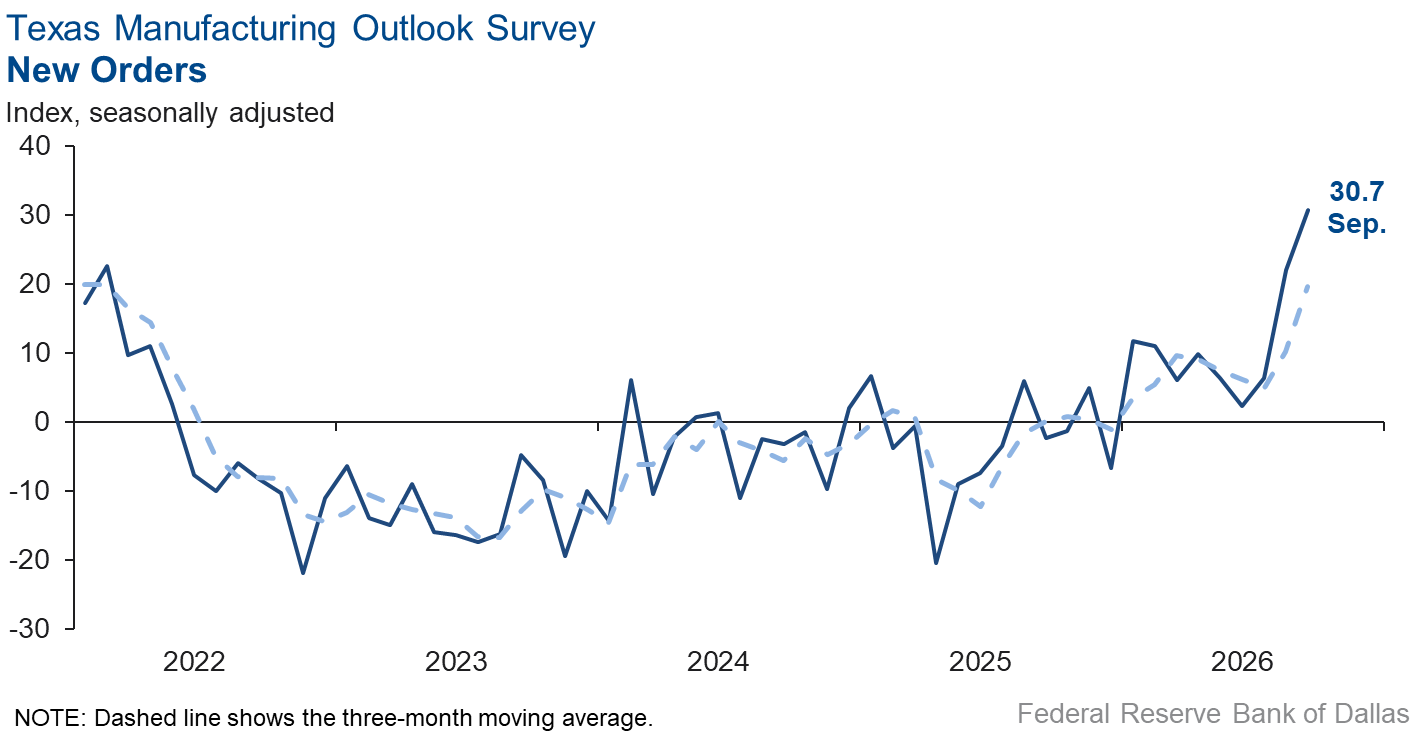
Other measures of manufacturing activity also pointed to rapid gains this month. The capacity utilization index jumped 11 points to 23.9, and the shipments index climbed 11 points to 24.8. The new orders index increased to 30.7 from 22.0. All three indexes registered above-average readings in September.
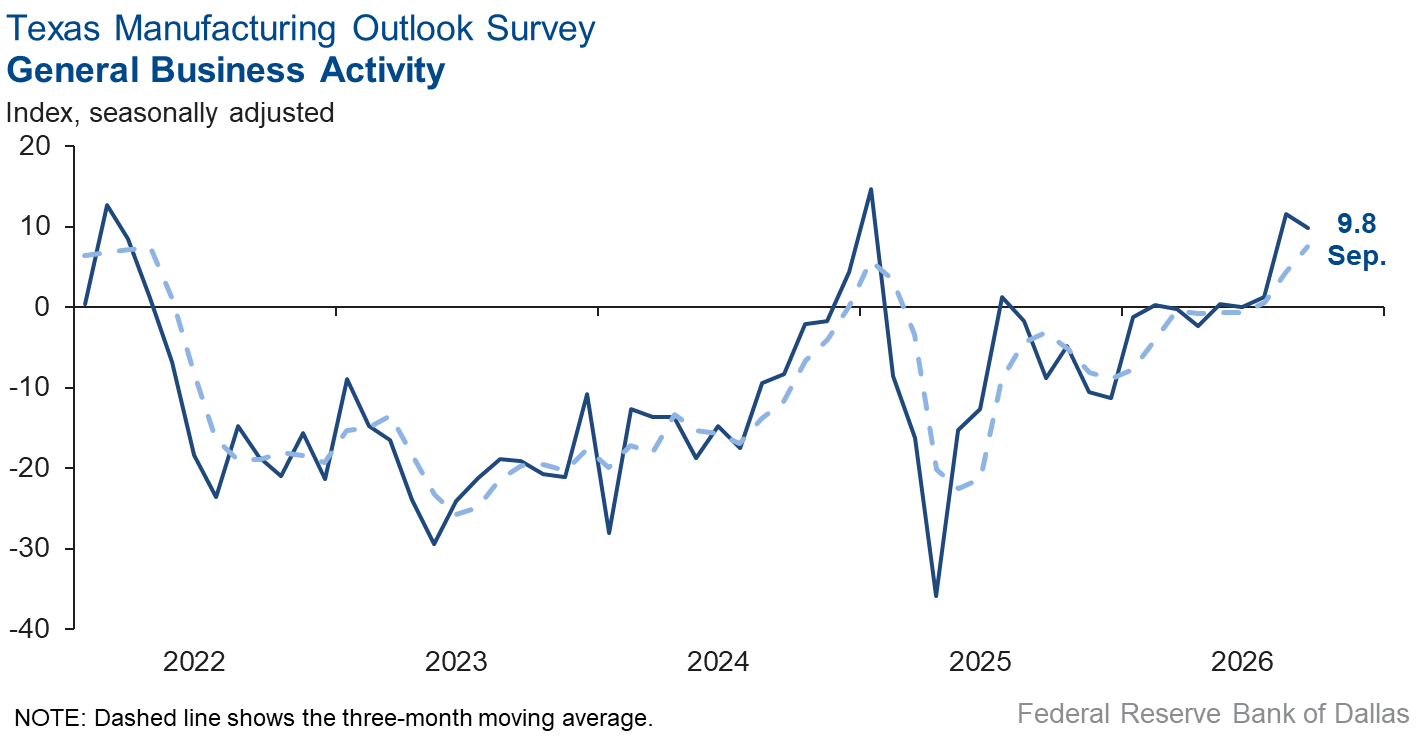
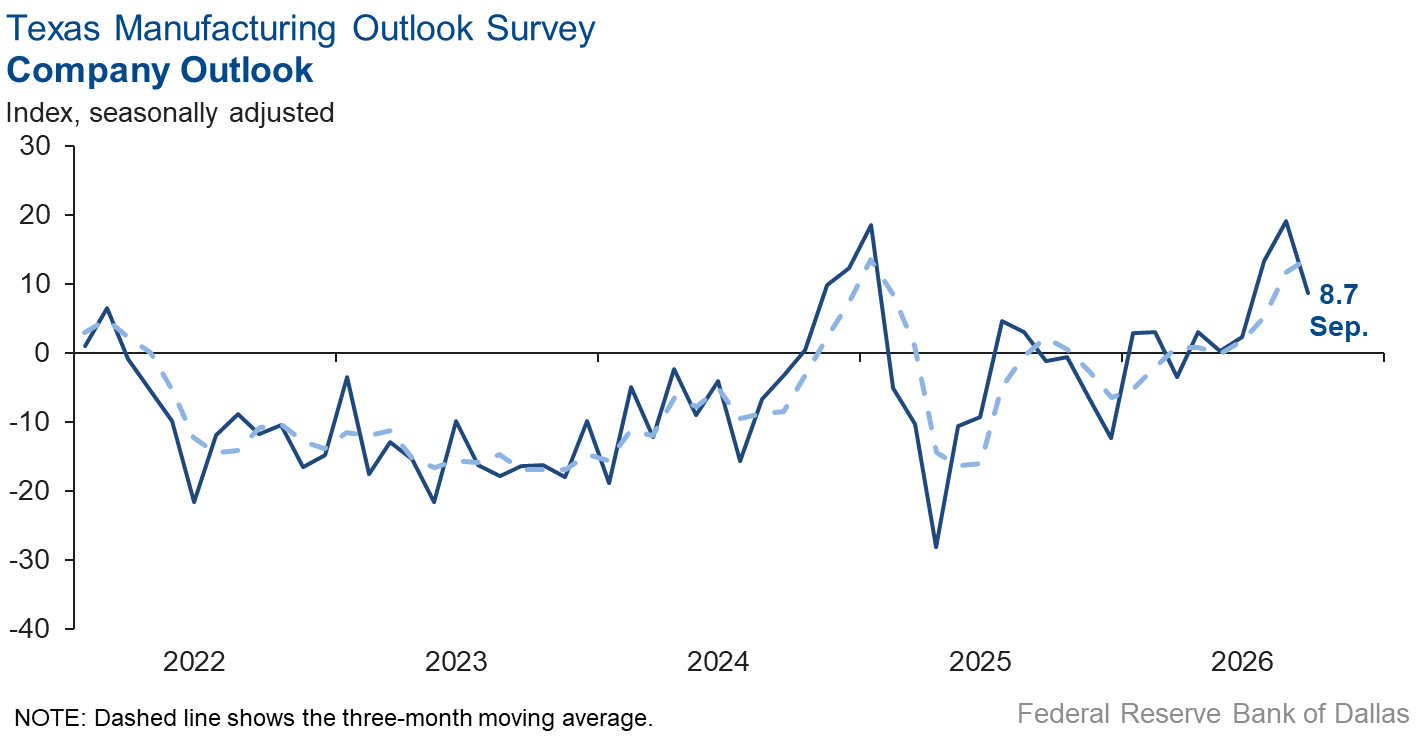
Perceptions of broader business conditions continued to improve in September, albeit unevenly. The general business activity index edged down to 9.8 from 11.6, while the company outlook index continued to improve but at a much slower pace, coming in at 8.7, down from 19.2. The outlook uncertainty index edged up three points to 11.3.
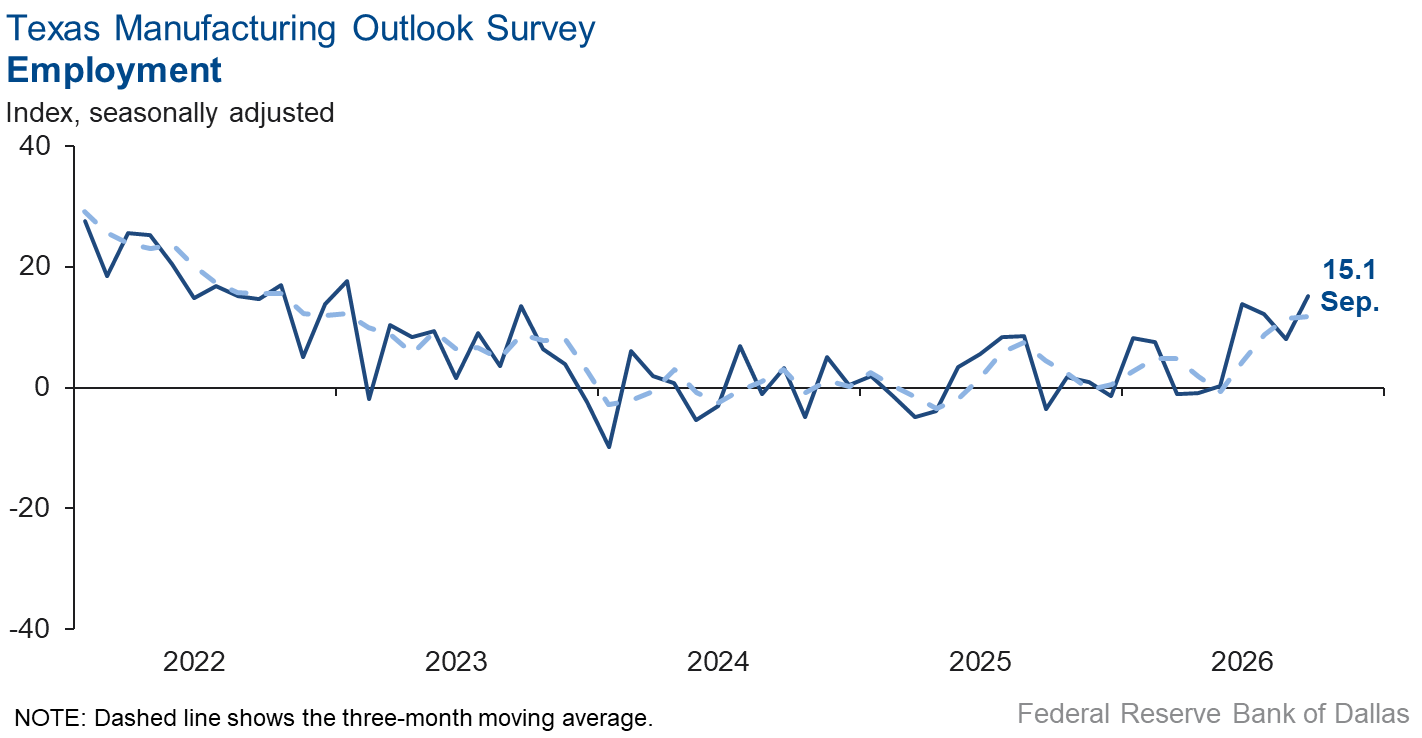
Employment growth picked up in September, while work hours were little changed. The employment index rose seven points to 15.1 from 8.0. The hours worked index was relatively unchanged at 5.6, similar to August's 5.9.
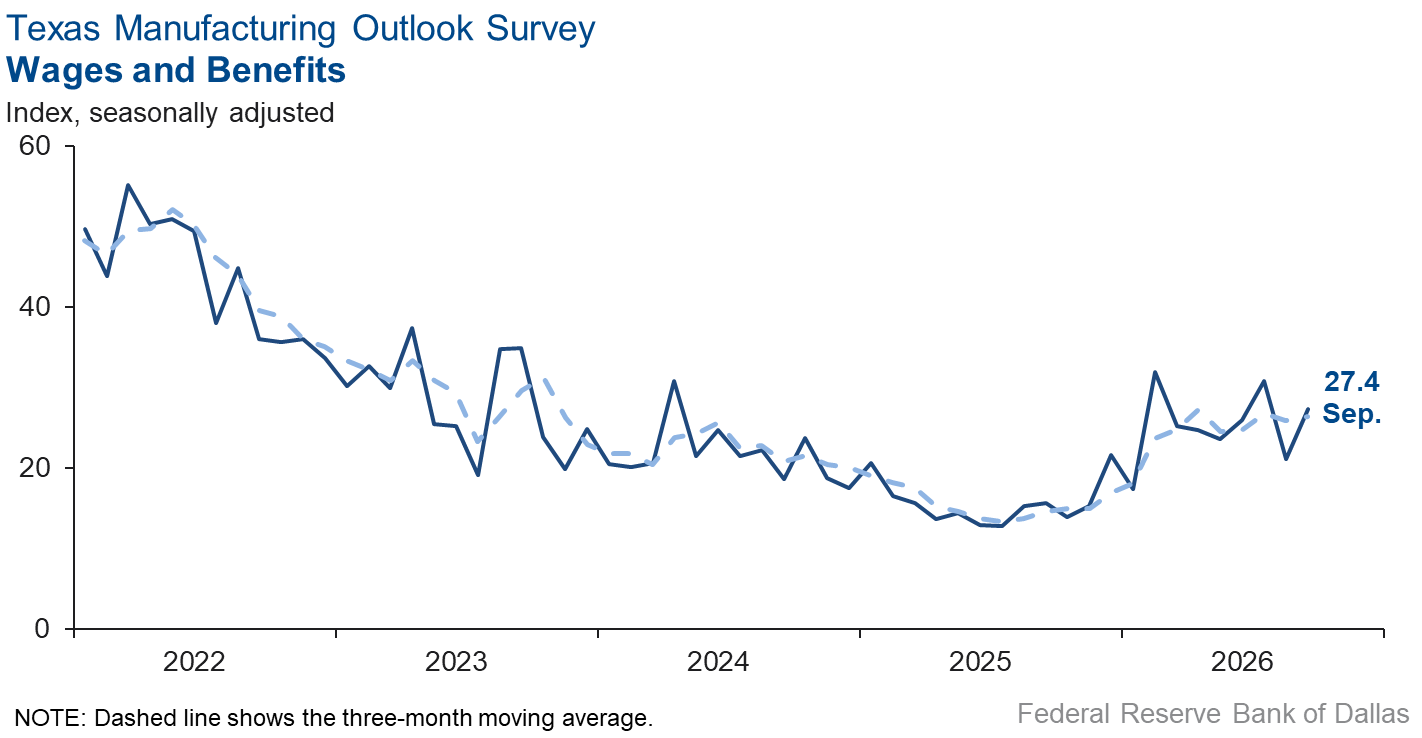
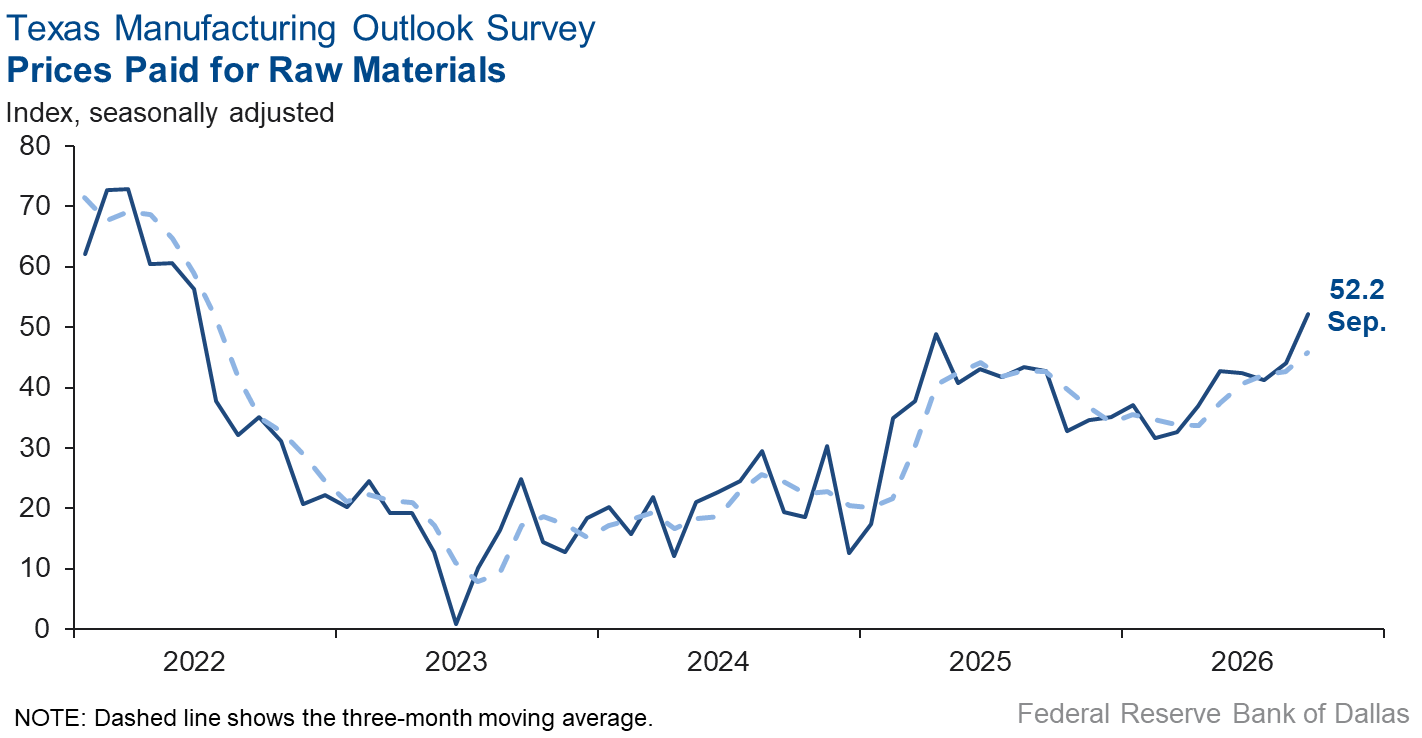
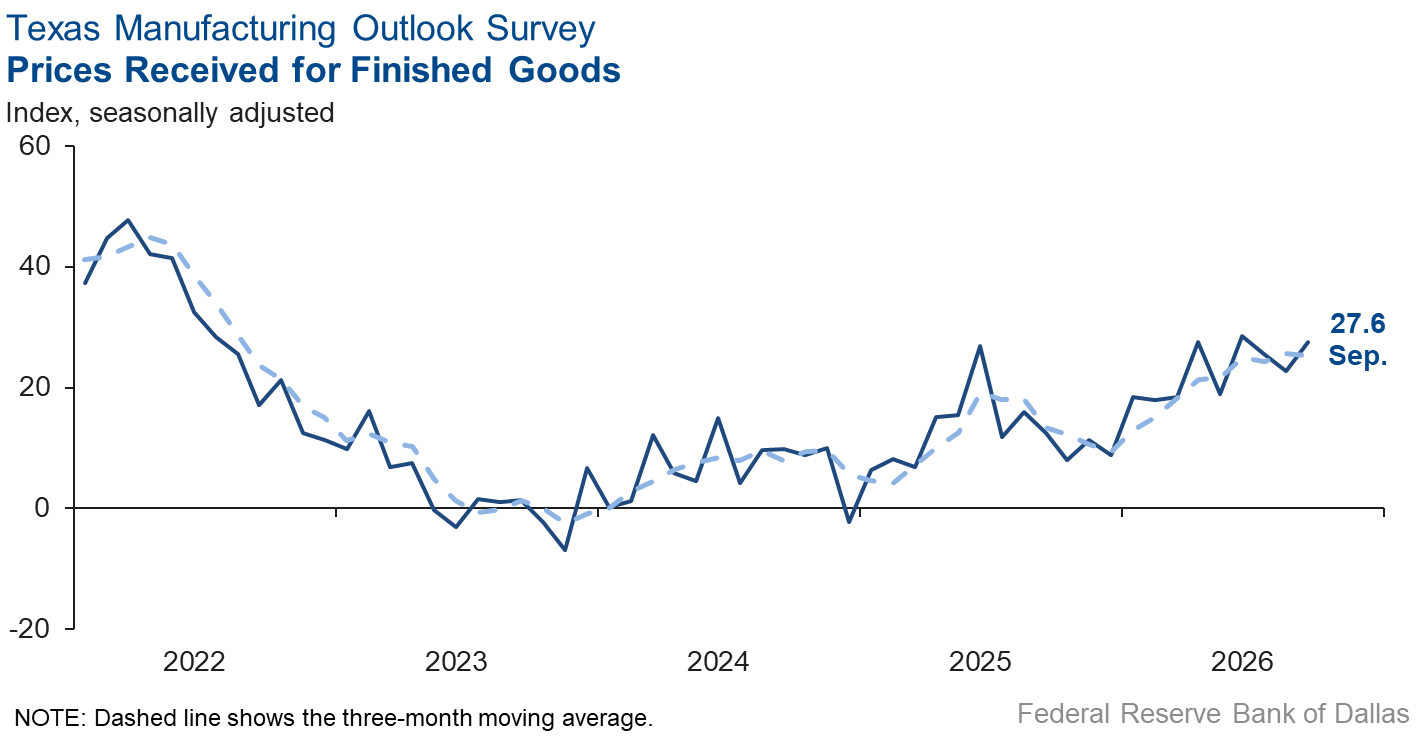
Price and wage pressures increased broadly in September. The finished goods prices index rose five points to 27.6, while the raw materials prices index advanced eight points to 52.2, well above its series average of 28.0. The wages and benefits index went up six points to 27.4.
Expectations are for continued growth in manufacturing activity six months from now. The future production index was little changed at 40.3, while the future general business activity index fell to 20.8 from 37.2, though it remained in solidly positive territory. Other indexes of future manufacturing activity signaled ongoing expansion.
Next release: Monday, October 26
Data were collected Sept. 15–23, and 63 of the 113 Texas manufacturers surveyed submitted responses. The Dallas Fed conducts the Texas Manufacturing Outlook Survey monthly to obtain a timely assessment of the state’s factory activity. Firms are asked whether output, employment, orders, prices and other indicators increased, decreased or remained unchanged over the previous month.
Survey responses are used to calculate an index for each indicator. Each index is calculated by subtracting the percentage of respondents reporting a decrease from the percentage reporting an increase. When the share of firms reporting an increase exceeds the share reporting a decrease, the index will be greater than zero, suggesting the indicator has increased over the prior month. If the share of firms reporting a decrease exceeds the share reporting an increase, the index will be below zero, suggesting the indicator has decreased over the prior month. An index will be zero when the number of firms reporting an increase is equal to the number of firms reporting a decrease. Data have been seasonally adjusted as necessary.
Results summary
Historical data are available from June 2004 to the most current release month.
| Business Indicators Relating to Facilities and Products in Texas Current (versus previous month) | ||||||||
| Indicator | Sep Index | Aug Index | Change | Series Average | Trend* | % Reporting Increase | % Reporting No Change | % Reporting Decrease |
Production | 29.5 | 16.1 | +13.4 | 9.7 | 9(+) | 41.5 | 46.6 | 12.0 |
Capacity Utilization | 23.9 | 12.8 | +11.1 | 7.5 | 9(+) | 35.8 | 52.3 | 11.9 |
New Orders | 30.7 | 22.0 | +8.7 | 4.8 | 9(+) | 44.3 | 42.0 | 13.6 |
Growth Rate of Orders | 19.1 | 8.1 | +11.0 | –1.0 | 2(+) | 36.2 | 46.7 | 17.1 |
Unfilled Orders | 22.7 | –1.3 | +24.0 | –2.6 | 1(+) | 27.7 | 67.3 | 5.0 |
Shipments | 24.8 | 14.1 | +10.7 | 7.9 | 9(+) | 41.5 | 41.8 | 16.7 |
Delivery Time | 17.5 | 12.5 | +5.0 | 0.7 | 5(+) | 22.3 | 72.9 | 4.8 |
Finished Goods Inventories | –9.5 | 2.9 | –12.4 | –3.3 | 1(–) | 14.3 | 61.9 | 23.8 |
Prices Paid for Raw Materials | 52.2 | 44.1 | +8.1 | 28.0 | 77(+) | 54.9 | 42.4 | 2.7 |
Prices Received for Finished Goods | 27.6 | 22.7 | +4.9 | 9.2 | 21(+) | 31.1 | 65.4 | 3.5 |
Wages and Benefits | 27.4 | 21.1 | +6.3 | 21.1 | 77(+) | 27.5 | 72.4 | 0.1 |
Employment | 15.1 | 8.0 | +7.1 | 7.1 | 5(+) | 26.5 | 62.1 | 11.4 |
Hours Worked | 5.6 | 5.9 | –0.3 | 3.0 | 9(+) | 13.4 | 78.8 | 7.8 |
Capital Expenditures | 8.5 | 8.2 | +0.3 | 6.7 | 7(+) | 17.7 | 73.1 | 9.2 |
| General Business Conditions Current (versus previous month) | ||||||||
| Indicator | Sep Index | Aug Index | Change | Series Average | Trend** | % Reporting Improved | % Reporting No Change | % Reporting Worsened |
Company Outlook | 8.7 | 19.2 | –10.5 | 4.2 | 6(+) | 26.5 | 55.7 | 17.8 |
General Business Activity | 9.8 | 11.6 | –1.8 | 0.3 | 3(+) | 26.9 | 56.0 | 17.1 |
| Indicator | Sep Index | Aug Index | Change | Series Average | Trend* | % Reporting Increase | % Reporting No Change | % Reporting Decrease |
Outlook Uncertainty | 11.3 | 8.7 | +2.6 | 16.6 | 9(+) | 24.2 | 62.9 | 12.9 |
| Business Indicators Relating to Facilities and Products in Texas Future (six months ahead) | ||||||||
| Indicator | Sep Index | Aug Index | Change | Series Average | Trend* | % Reporting Increase | % Reporting No Change | % Reporting Decrease |
Production | 40.3 | 40.9 | –0.6 | 36.0 | 77(+) | 48.8 | 42.7 | 8.5 |
Capacity Utilization | 38.8 | 38.6 | +0.2 | 32.8 | 77(+) | 46.7 | 45.4 | 7.9 |
New Orders | 39.5 | 42.4 | –2.9 | 33.4 | 47(+) | 45.6 | 48.3 | 6.1 |
Growth Rate of Orders | 29.2 | 41.0 | –11.8 | 24.7 | 37(+) | 34.6 | 60.0 | 5.4 |
Unfilled Orders | 13.8 | 15.3 | –1.5 | 2.8 | 4(+) | 17.8 | 78.2 | 4.0 |
Shipments | 39.2 | 45.2 | –6.0 | 34.4 | 77(+) | 46.7 | 45.7 | 7.5 |
Delivery Time | 13.9 | 15.4 | –1.5 | –1.1 | 5(+) | 20.4 | 73.1 | 6.5 |
Finished Goods Inventories | 1.8 | –1.6 | +3.4 | –0.2 | 1(+) | 15.8 | 70.2 | 14.0 |
Prices Paid for Raw Materials | 51.3 | 53.5 | –2.2 | 34.2 | 78(+) | 56.8 | 37.7 | 5.5 |
Prices Received for Finished Goods | 42.8 | 40.9 | +1.9 | 22.0 | 77(+) | 48.2 | 46.4 | 5.4 |
Wages and Benefits | 48.3 | 46.9 | +1.4 | 39.1 | 268(+) | 51.5 | 45.3 | 3.2 |
Employment | 18.1 | 34.5 | –16.4 | 22.7 | 76(+) | 30.9 | 56.3 | 12.8 |
Hours Worked | 14.5 | 15.6 | –1.1 | 8.5 | 7(+) | 21.3 | 71.9 | 6.8 |
Capital Expenditures | 23.1 | 25.9 | –2.8 | 19.4 | 76(+) | 31.7 | 59.7 | 8.6 |
| General Business Conditions Future (six months ahead) | ||||||||
| Indicator | Sep Index | Aug Index | Change | Series Average | Trend** | % Reporting Increase | % Reporting No Change | % Reporting Worsened |
Company Outlook | 31.5 | 35.3 | –3.8 | 18.4 | 17(+) | 40.0 | 51.5 | 8.5 |
General Business Activity | 20.8 | 37.2 | –16.4 | 12.5 | 17(+) | 34.4 | 52.0 | 13.6 |
*Shown is the number of consecutive months of expansion or contraction in the underlying indicator. Expansion is indicated by a positive index reading and denoted by a (+) in the table. Contraction is indicated by a negative index reading and denoted by a (–) in the table.
**Shown is the number of consecutive months of improvement or worsening in the underlying indicator. Improvement is indicated by a positive index reading and denoted by a (+) in the table. Worsening is indicated by a negative index reading and denoted by a (–) in the table.
Data have been seasonally adjusted as necessary.
Comments from survey respondents
Survey participants are given the opportunity to submit comments on current issues that may be affecting their businesses. Some comments have been edited for grammar and clarity.
- Tariffs and fuel prices are affecting incoming and outgoing products/costs. Customers have hit the limit on what they can pay. We are getting pushback and cancellations.
- Fuel costs (diesel, in particular) are adversely impacting our bottom line and that of our customers. We'd welcome a quicker resolution to the conflict with Iran as we believe that could potentially provide more favorable outcomes, improved margins and stability in interest rates. Insurance rates continue to increase in cost with a decrease in coverage. Overall, however, we continue to expand operations with an ever-increasing backlog that will provide a record year of revenue and net income for our enterprise in 2026.
- We are experiencing strong customer demand, with orders starting to stack up. We think this trend will continue in the foreseeable future.
- Oil companies are spending money at a much higher rate than expected.
- Sudden unexpected surge in new orders after 2-3 months of slowing down.
- Upcoming elections and uncertainty over continuing tariff and trade negotiations, Middle East disruptions and increasing costs create a volatile environment for business. It becomes a high-stakes gamble.
- We are now facing increased difficulty obtaining raw materials domestically. Items that were readily available now take long lead times or are not available in the same specifications we have historically purchased.
- The price of diesel fuel is hurting our gross margin. We are unable to pass this through to our customers. We are bidding new jobs using $6.00 [per gallon] for diesel cost.
- Broadly speaking, very little to no manufacturing growth exists as pricing is being driven down by Asian and Chinese suppliers. AI and heavy transportation are growing. Other sectors are weak.
- Our business has been able to maintain its volume, primarily because several competitors have experienced significant difficulties, including the largest producer in our industry announcing the closure of two plants, one of which is relatively close to us in Louisiana. Our primary concern going forward is the outcome of the U.S.-Mexico trade negotiations. There are significant flows of foreign aluminum into Mexico, including from countries with substantial non-market production and subsidization including Russia and China at prices far below U.S. prices. We are concerned that reduction in tariffs on Mexican aluminum products will give these non-market economies a significantly advantaged conduit into our domestic markets. Rules of Origin policies sound good in theory but experience shows that this relies on the honesty of those doing the reporting. PROSECs (Program for Sectoral Promotion) are also problematic in giving Mexican companies the ability to use these same foreign-supplied raw materials in downstream products. For U.S. aluminum producers, the issue isn't simply the tariff rate applied to Mexico. It is making sure that Mexico does not become a lower-tariff pathway for heavily subsidized aluminum produced in Russia, China or elsewhere in Asia to reach the U.S. market.
- Incoming orders have really slowed down, and now that we are finishing up on some large projects that have kept us very busy since mid-spring, things are slowing down. We have to believe it's due to the uncertainty around the chaos out of Washington, D.C. and lack of a clear path forward. Add to this the higher cost of living and rising fuel costs, especially for diesel that affects all modes of shipping, it seems to be a logical reason for slower levels of activity amongst our customers.
- High interest and energy costs are a double hit. We can’t do any planning.
Historical Data
Historical data can be downloaded dating back to June 2004.
Indexes
Download indexes for all indicators. For the definitions of all variables, see Data Definitions.
| Unadjusted |
| Seasonally adjusted |
All Data
Download indexes and components of the indexes (percentage of respondents reporting increase, decrease or no change). For the definitions of all variables, see Data Definitions.
| Unadjusted |
| Seasonally adjusted |
Special questions
For this month’s survey, Texas business executives were asked supplemental questions on wages, prices and outlook concerns. Results below include responses from participants from both the Texas Manufacturing Outlook Survey and Texas Service Sector Outlook Survey. View individual survey results.
Questions regarding the Texas Business Outlook Surveys can be addressed to Jesus Cañas.
Sign up for our email alert to be automatically notified as soon as the latest Texas Manufacturing Outlook Survey is released on the web.