Texas Manufacturing Outlook Survey


Texas manufacturing activity remains solid, though pace of growth moderates
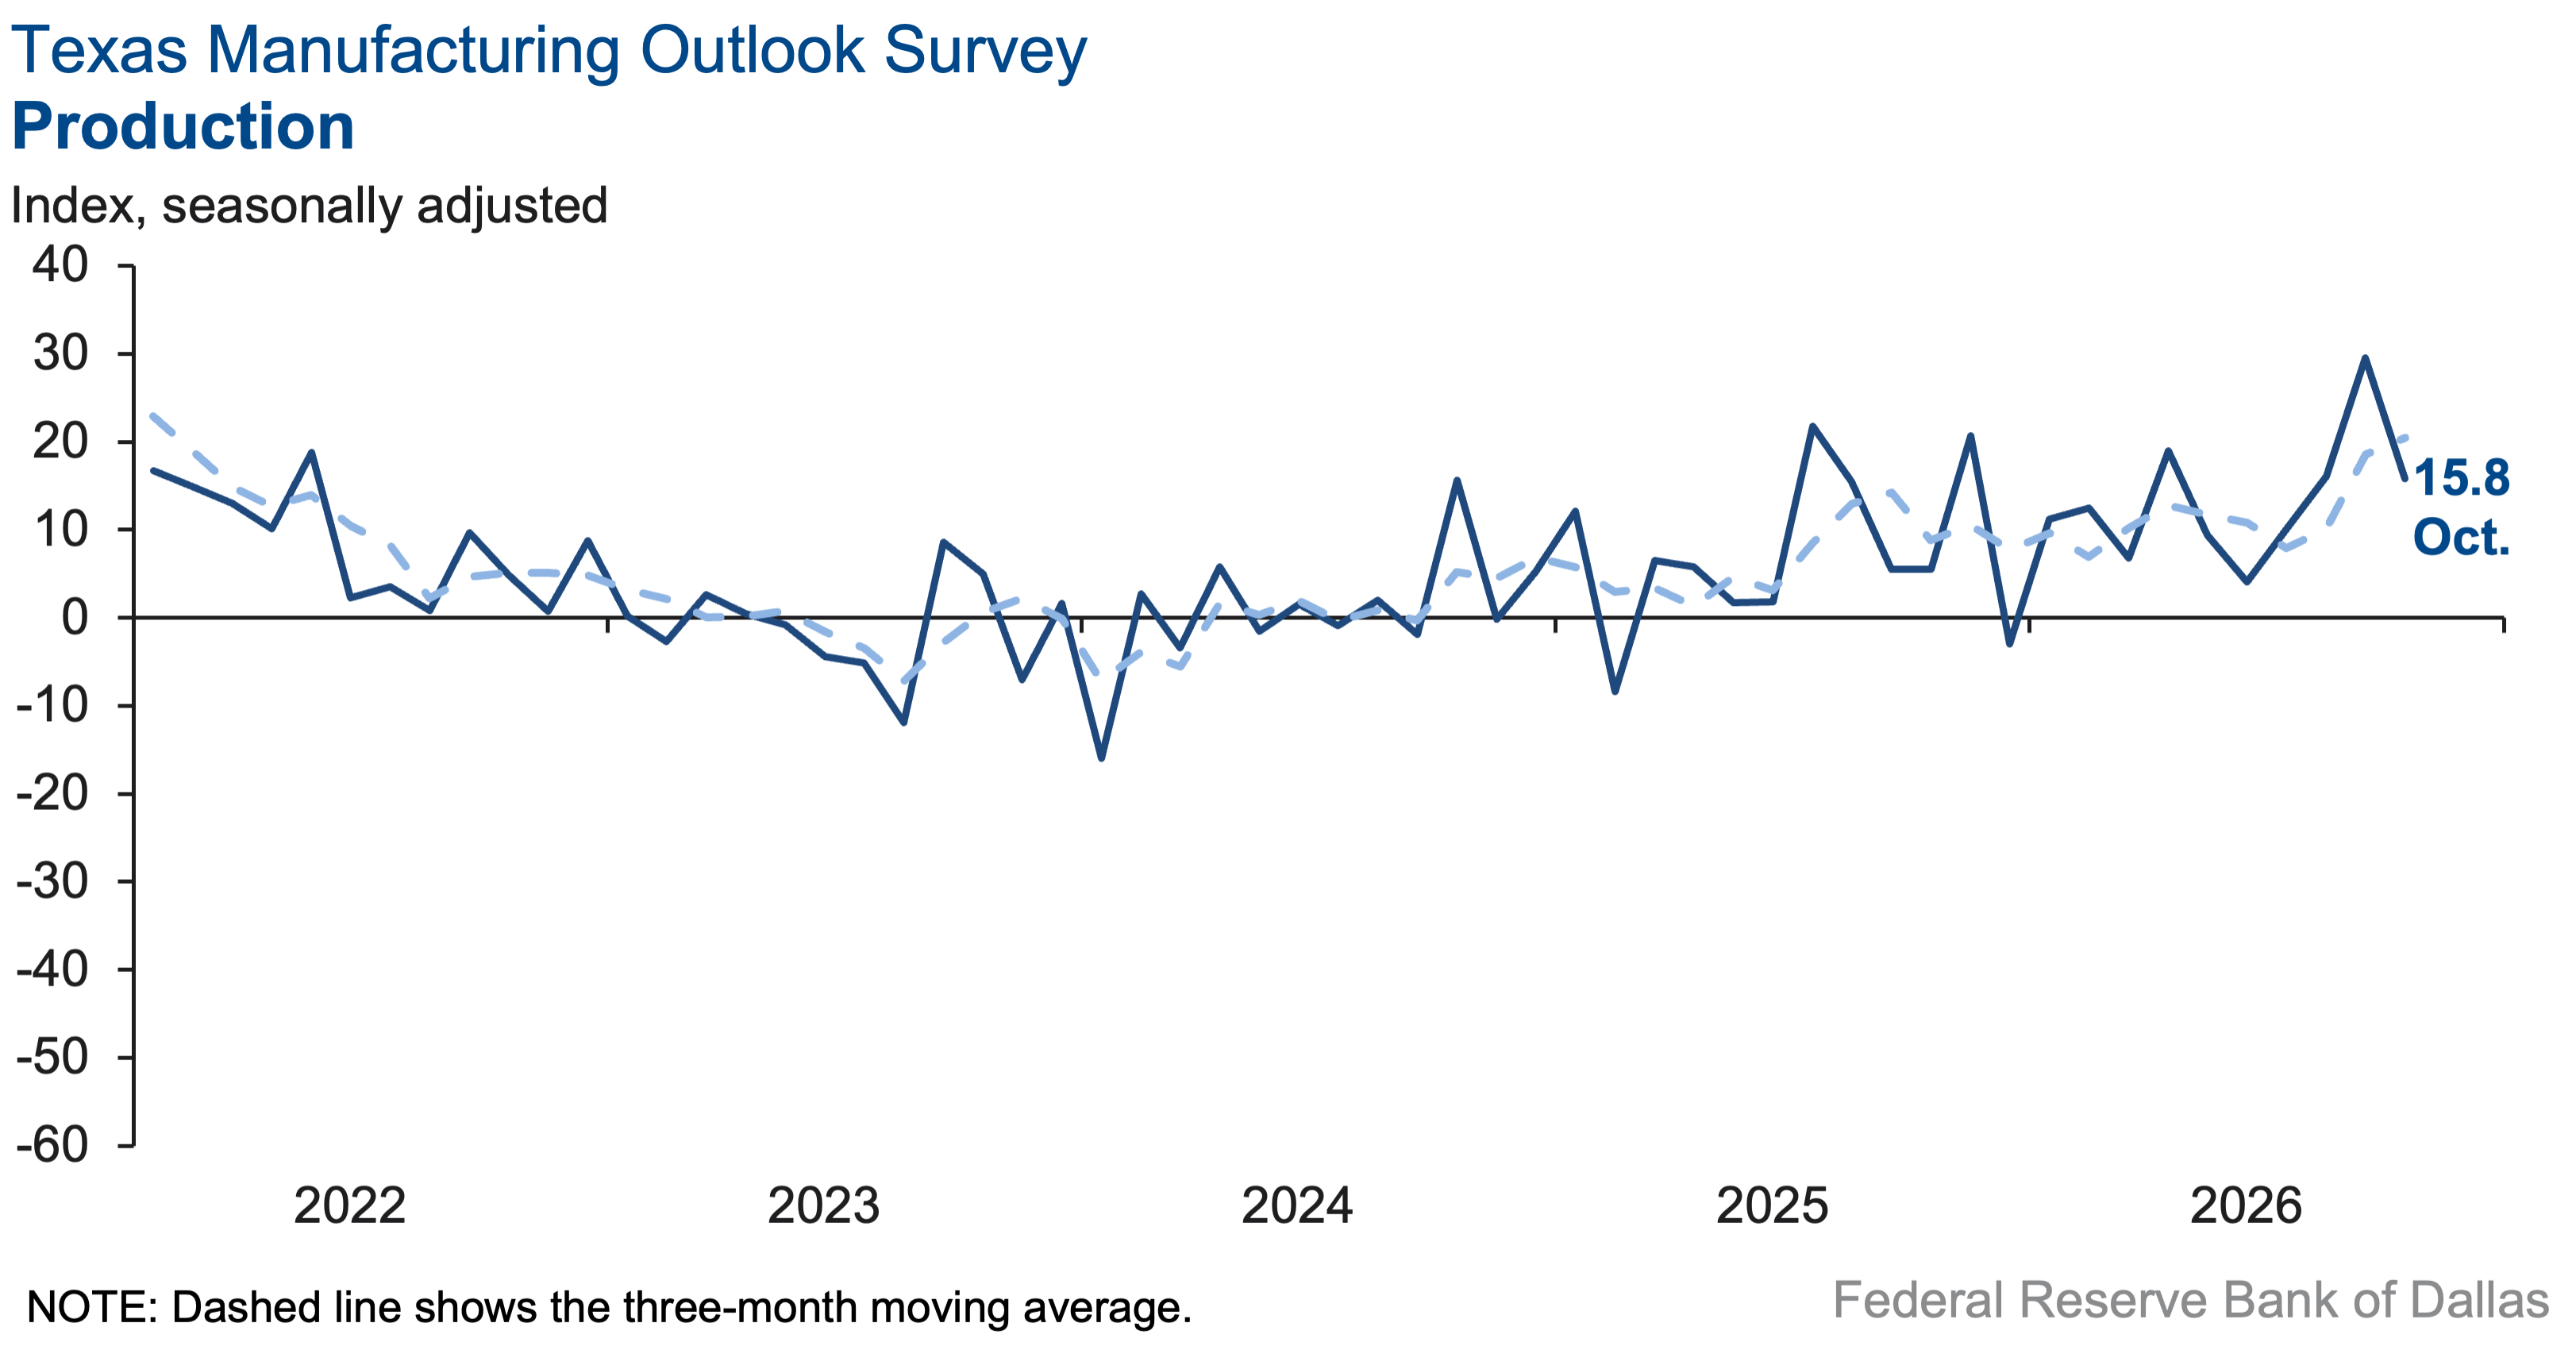
Texas manufacturing output growth eased in October, according to business executives responding to the Texas Manufacturing Outlook Survey. The production index, a key measure of state manufacturing conditions, fell 14 points to 15.8, but remained above its series average, indicating a slower yet still solid pace of expansion.
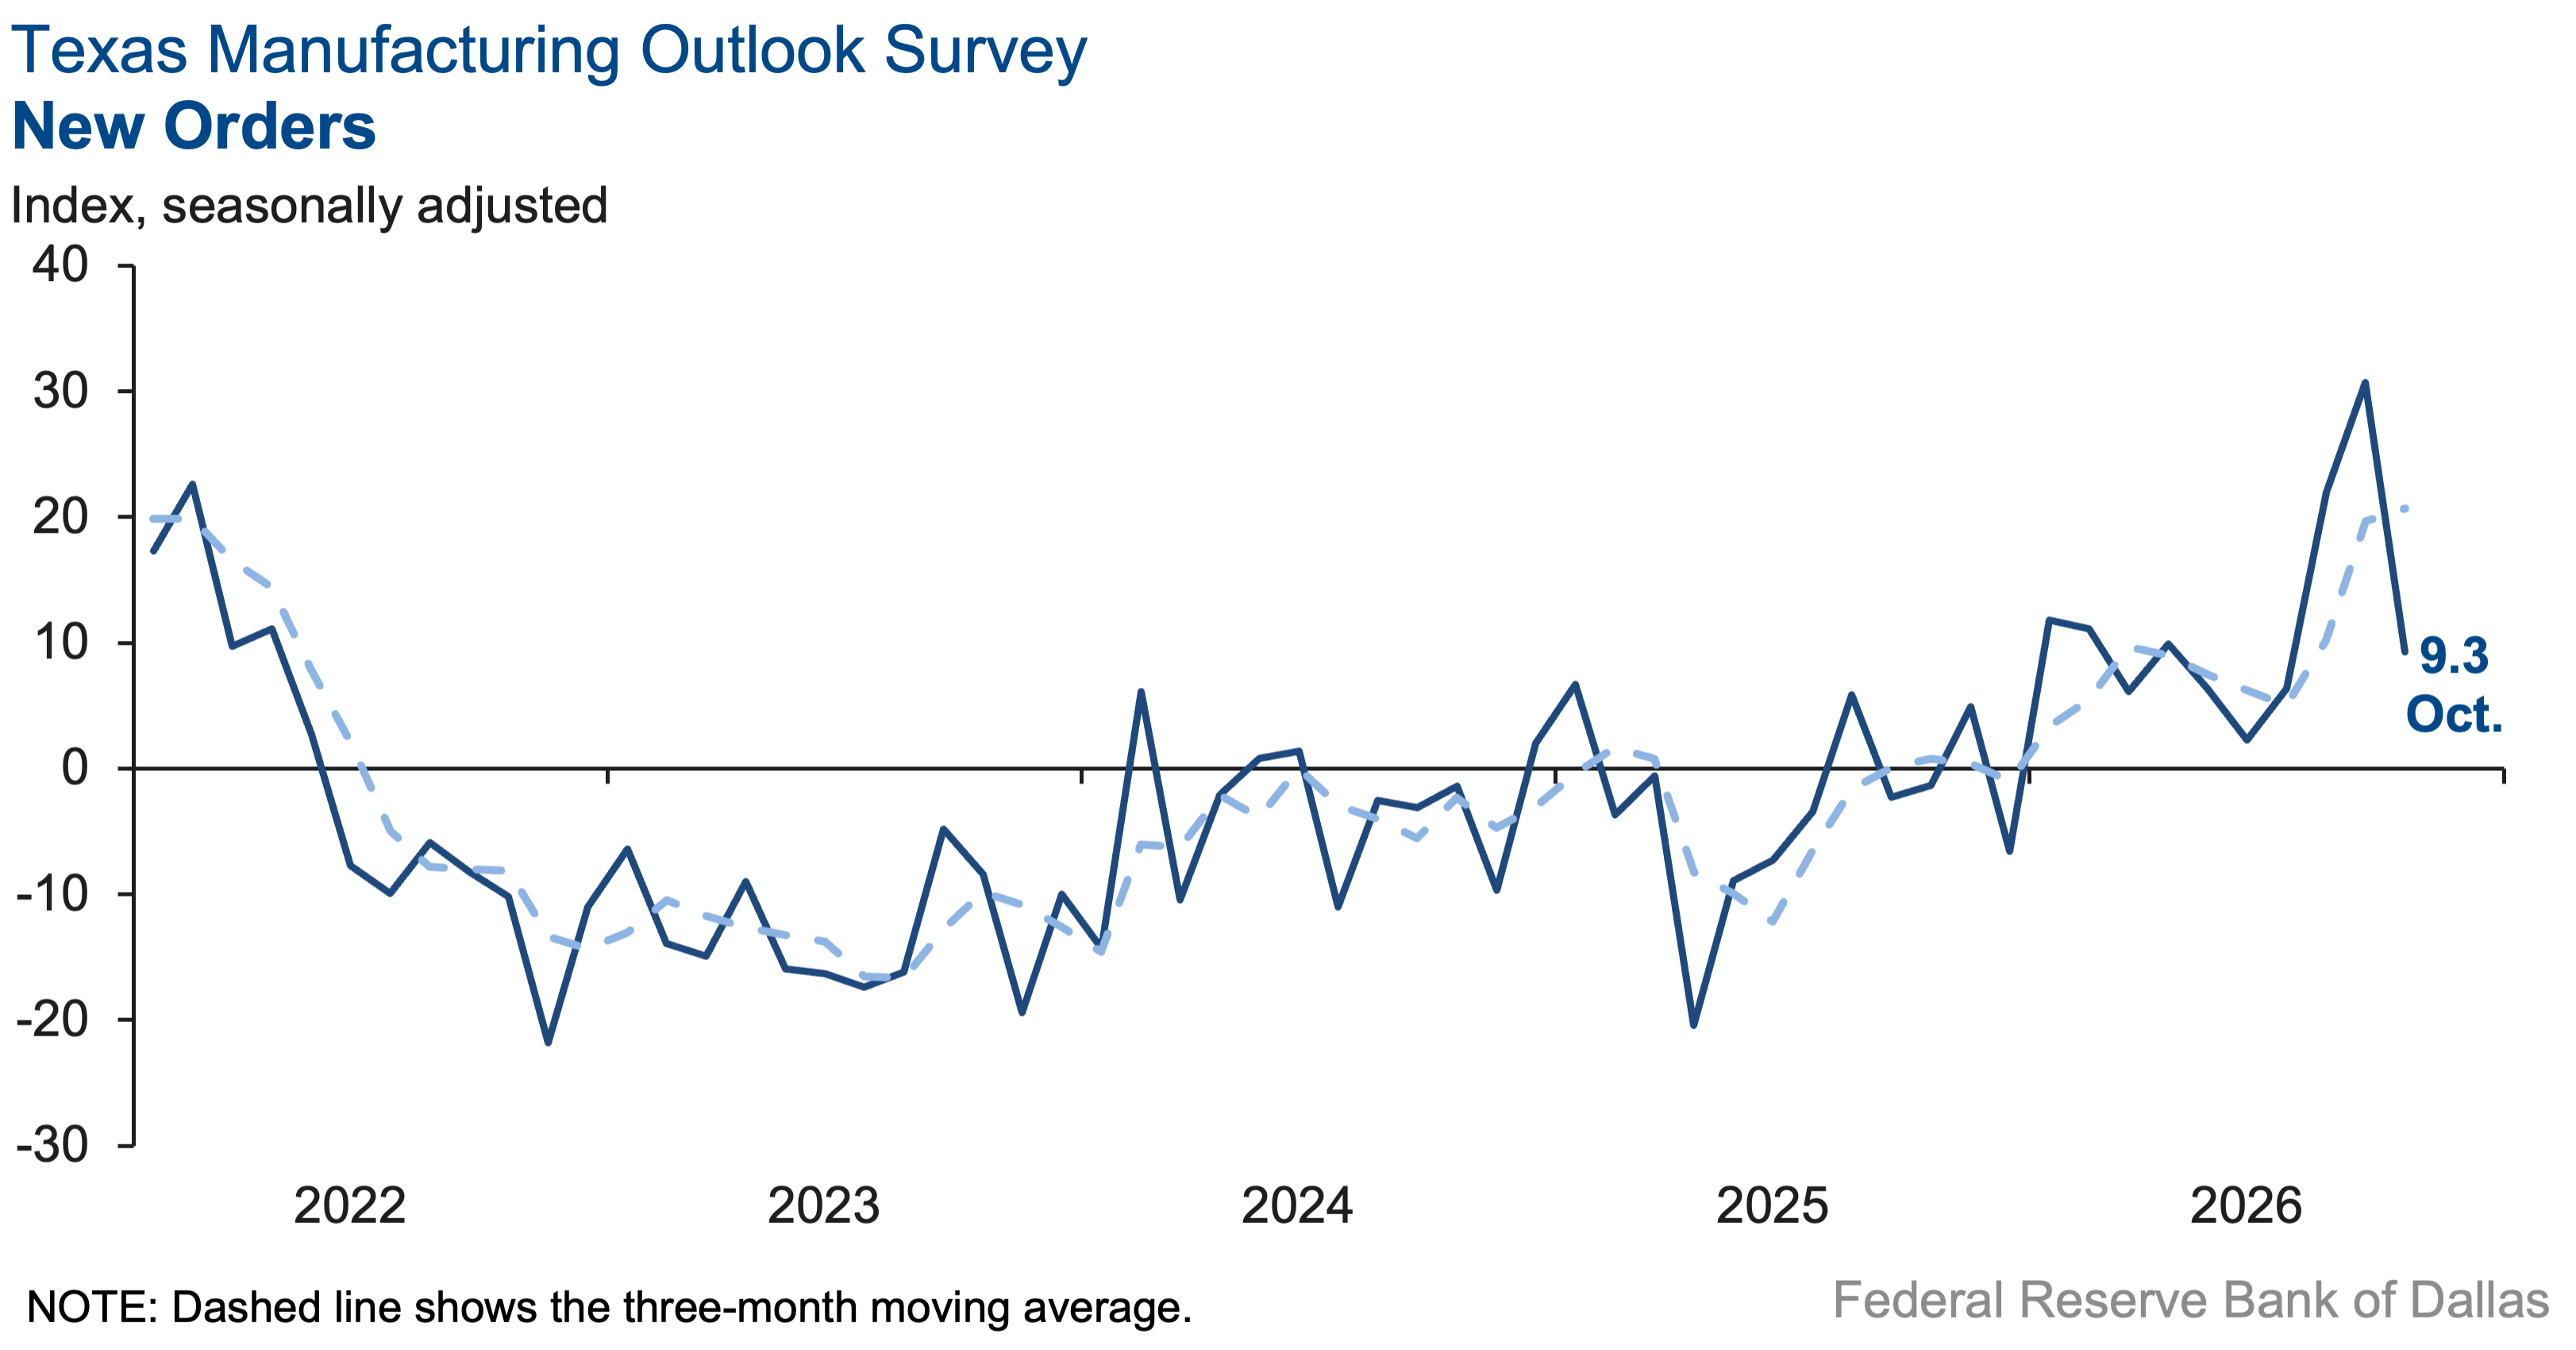
Other measures of manufacturing activity also pointed to slower growth this month. The capacity utilization index fell 10 points to 13.7, and the shipments index decreased 16 points to 8.4. The new orders index dropped sharply to 9.3 from 30.7.
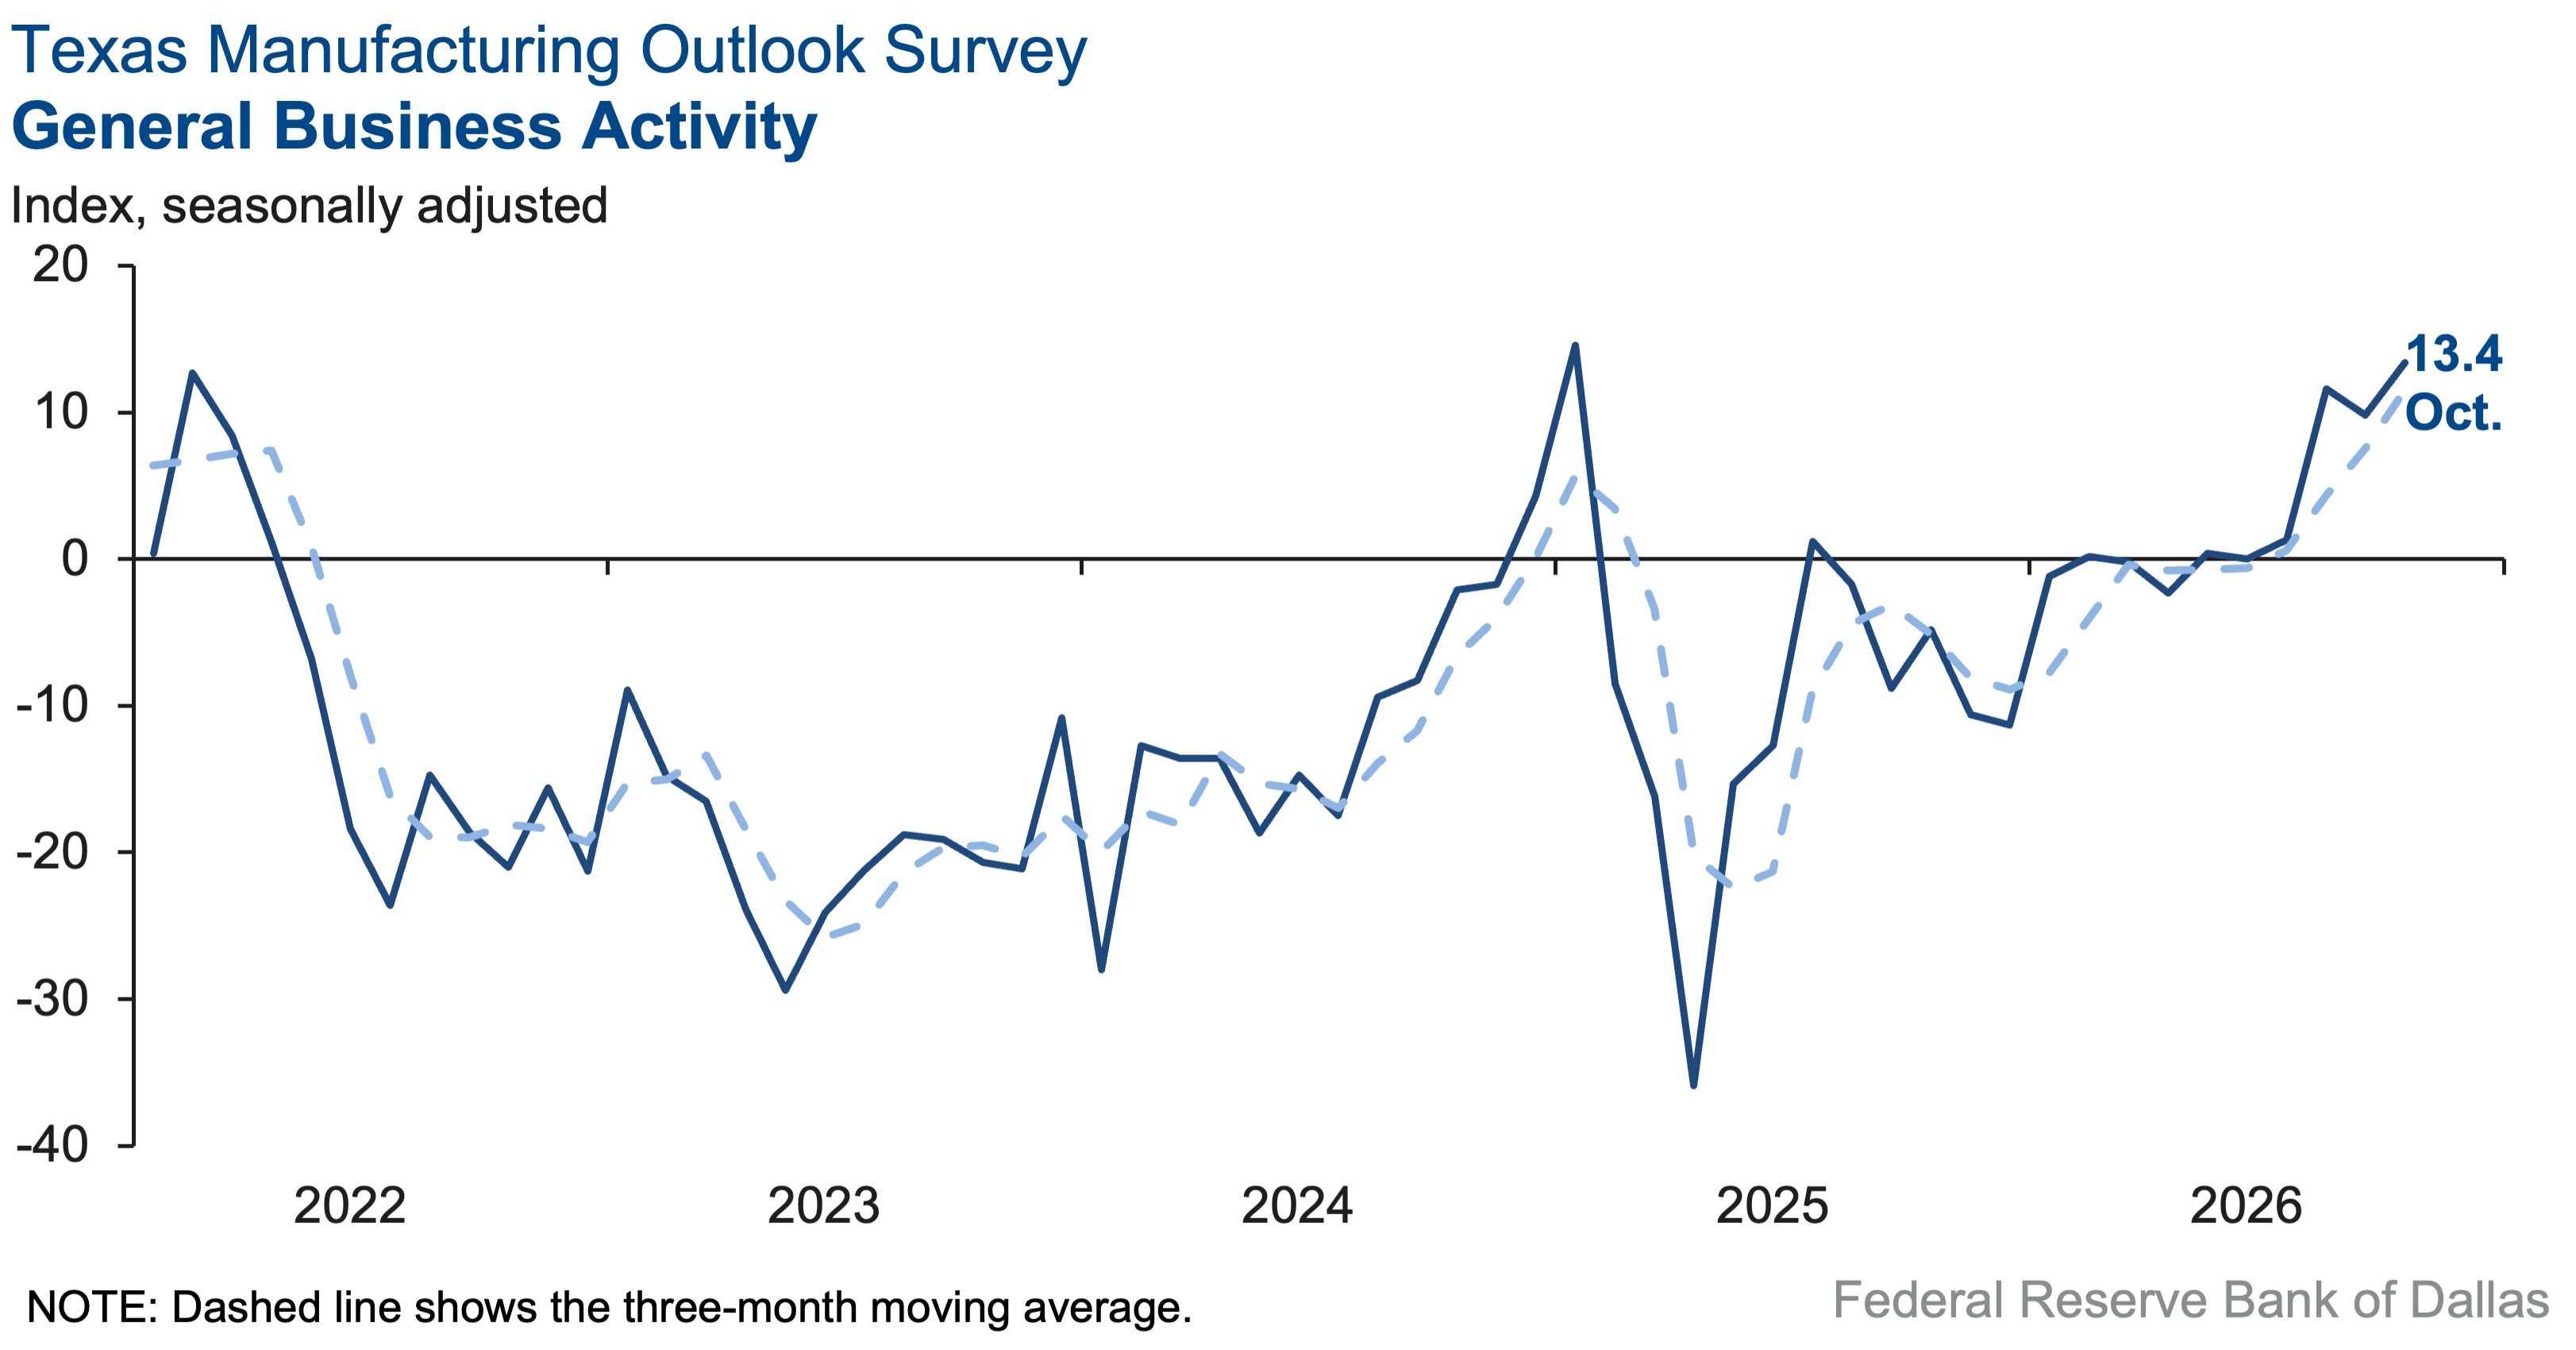
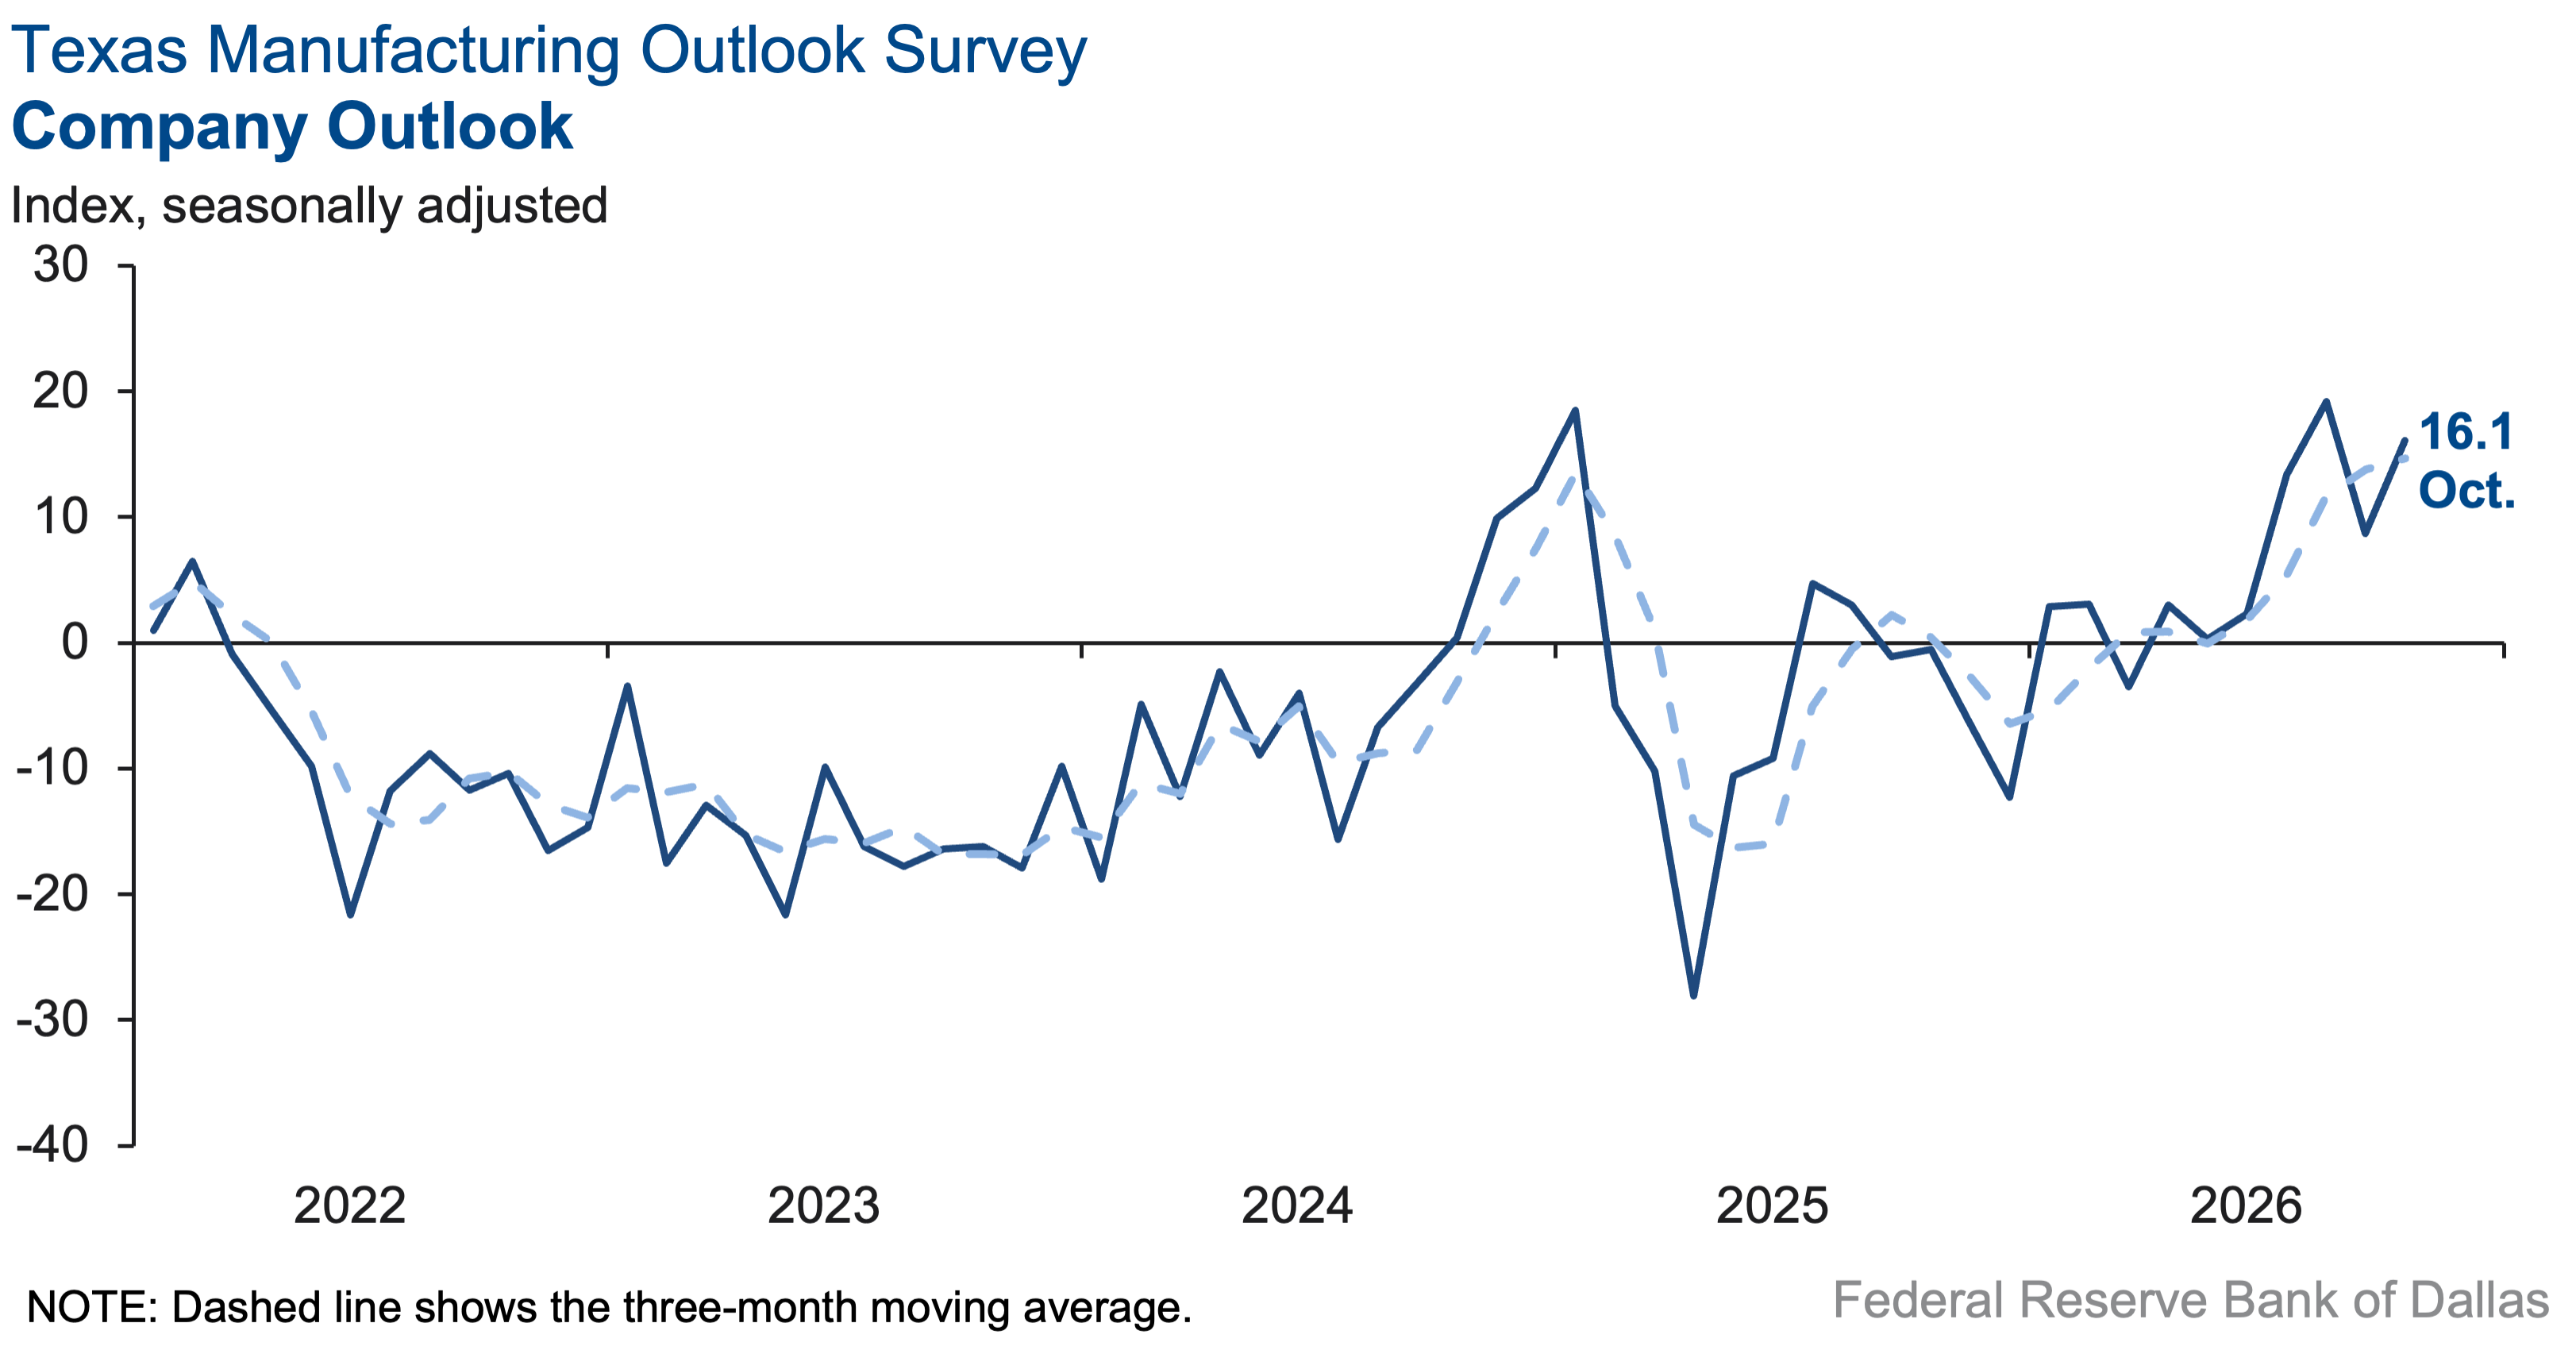
Perceptions of broader business conditions improved in October. The general business activity index increased to 13.4 from 9.8, and the company outlook index rose seven points to 16.1. The outlook uncertainty index edged down three points to 7.9.
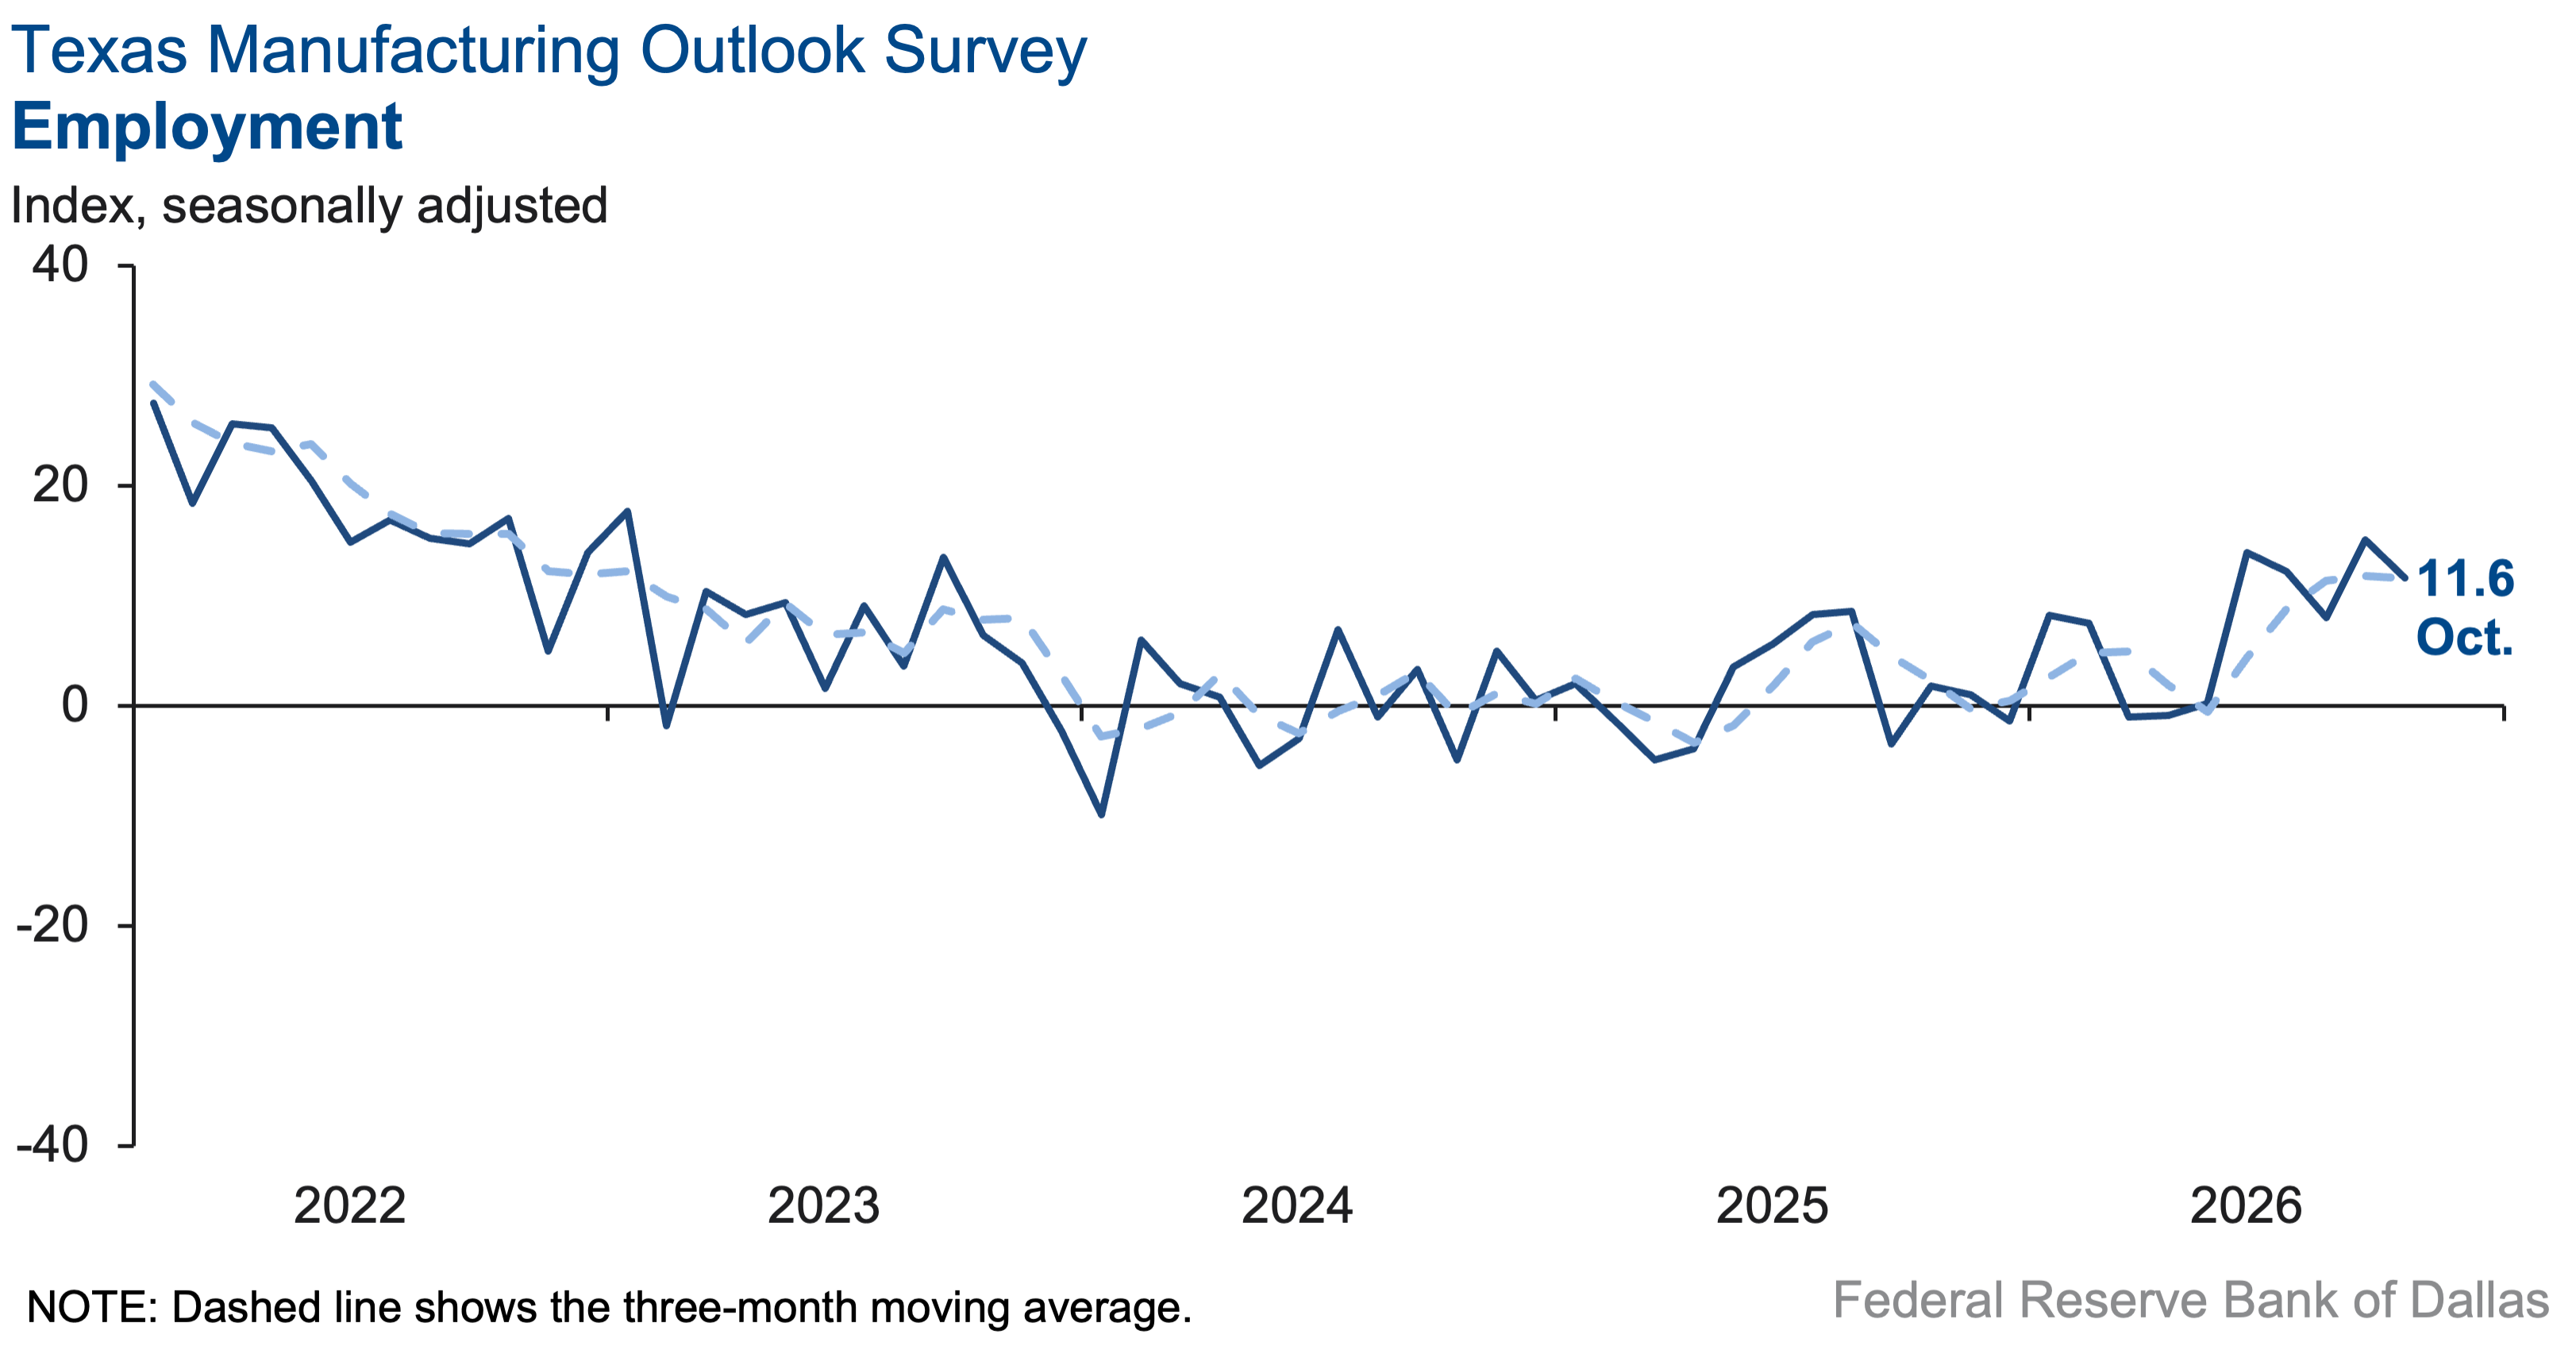
Labor market measures remained positive in October, though employment growth slowed while work hours rose faster. The employment index fell to 11.6 from 15.1. The hours worked index increased five points to 10.1.
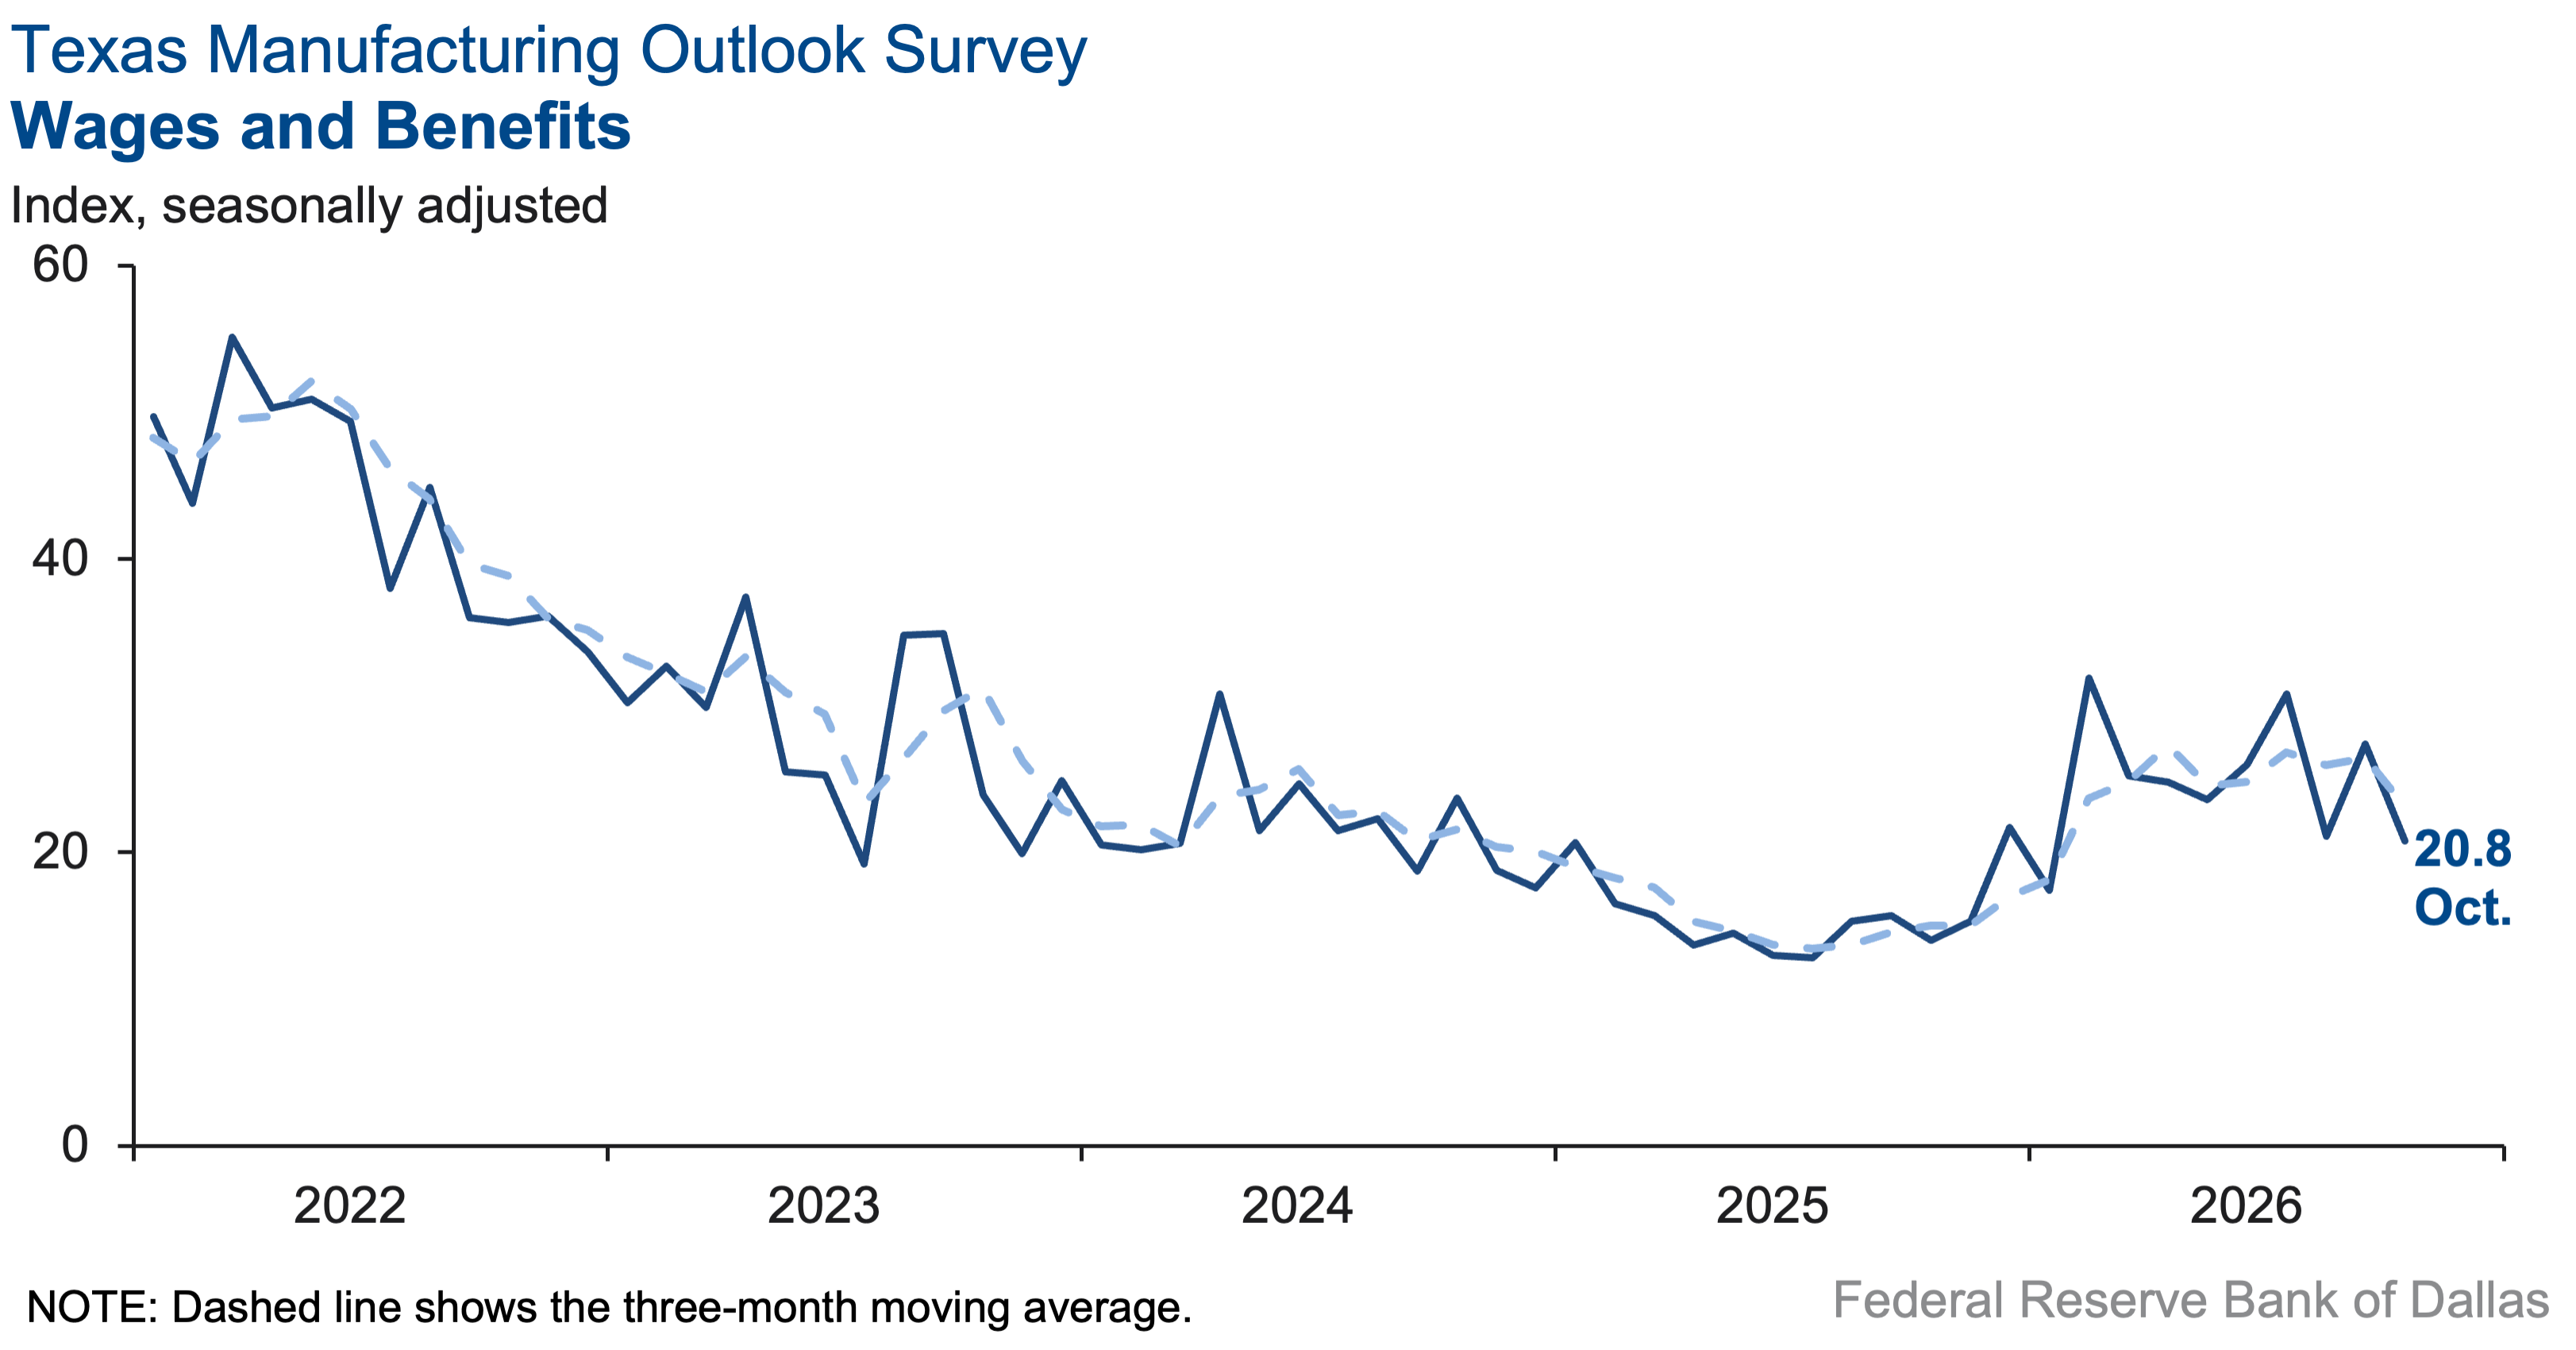
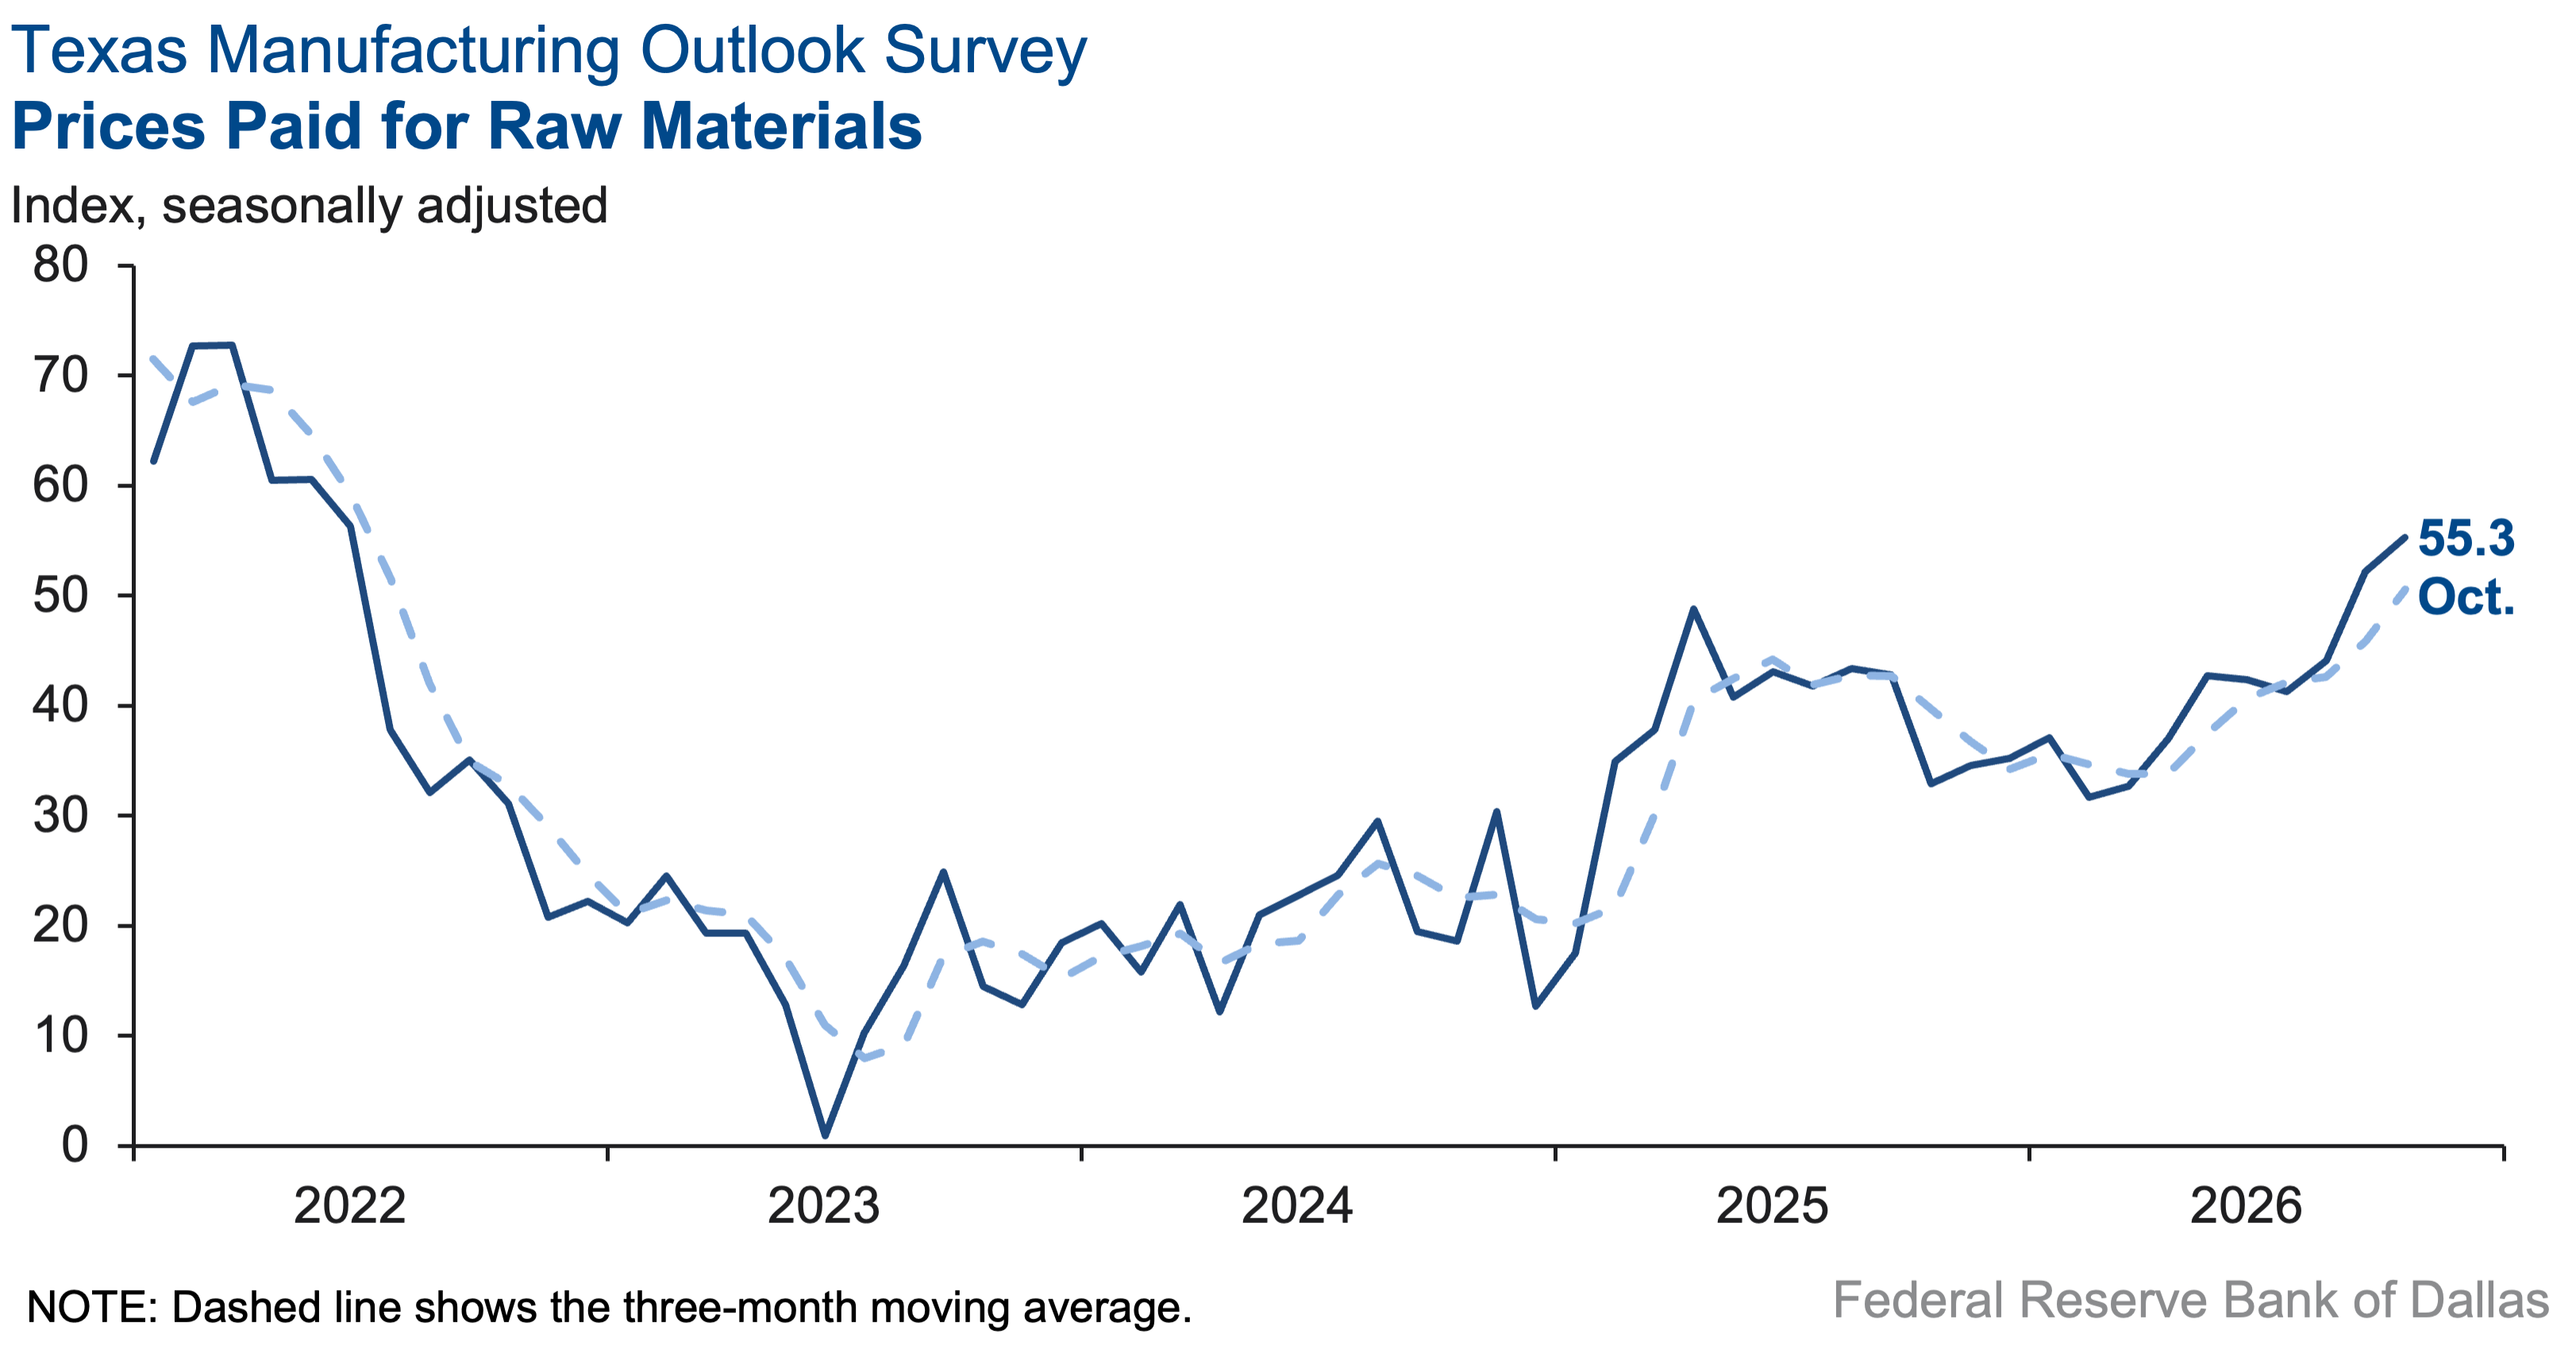
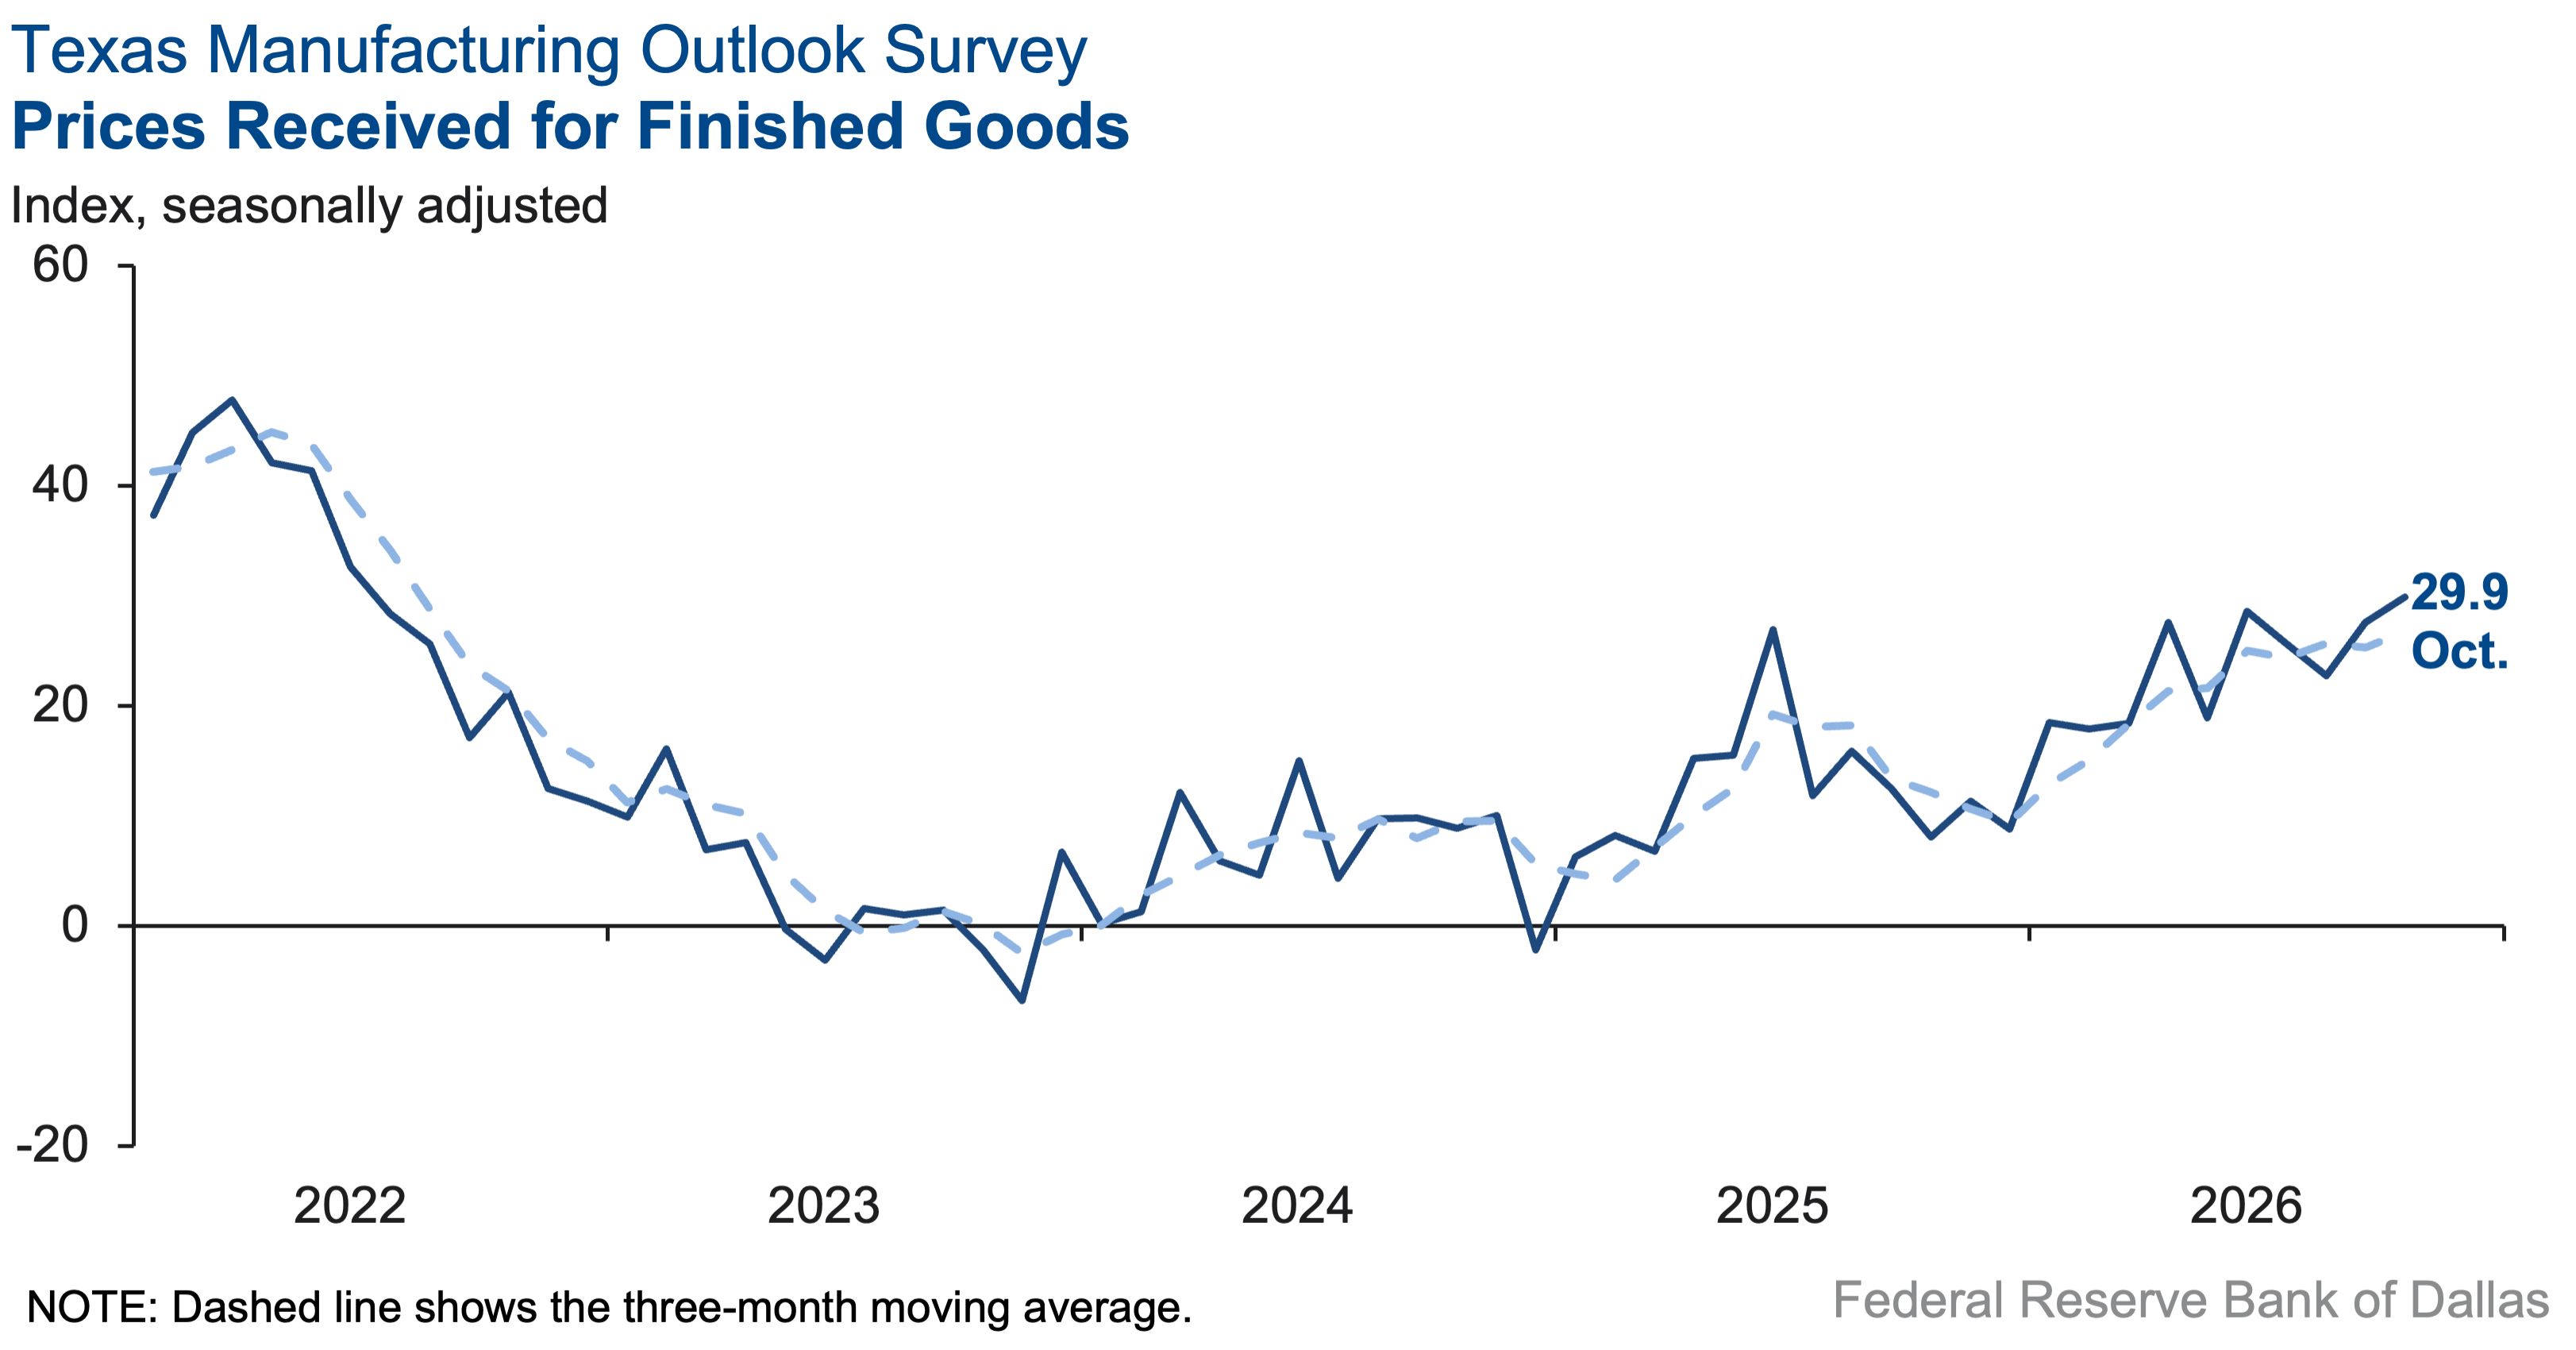
Price pressures edged higher while wage pressures eased this month. The finished goods prices index ticked up to 29.9 from 27.6, while the raw materials prices index edged up three points to 55.3, well above its series average of 28.1. The wages and benefits index fell seven points to 20.8.
Expectations are for continued growth in manufacturing activity six months from now. The future production index was little changed at 39.4, while the future general business activity index jumped 17 points to 38.1. Other indexes of future manufacturing activity remained in positive territory.
Next release: Monday, November 30
Data were collected October 13-21, and 64 of the 114 Texas manufacturers surveyed submitted responses. The Dallas Fed conducts the Texas Manufacturing Outlook Survey monthly to obtain a timely assessment of the state’s factory activity. Firms are asked whether output, employment, orders, prices and other indicators increased, decreased or remained unchanged over the previous month.
Survey responses are used to calculate an index for each indicator. Each index is calculated by subtracting the percentage of respondents reporting a decrease from the percentage reporting an increase. When the share of firms reporting an increase exceeds the share reporting a decrease, the index will be greater than zero, suggesting the indicator has increased over the prior month. If the share of firms reporting a decrease exceeds the share reporting an increase, the index will be below zero, suggesting the indicator has decreased over the prior month. An index will be zero when the number of firms reporting an increase is equal to the number of firms reporting a decrease. Data have been seasonally adjusted as necessary.
Results summary
Historical data are available from June 2004 to the most current release month.
| Business Indicators Relating to Facilities and Products in Texas Current (versus previous month) | ||||||||
| Indicator | Oct Index | Sep Index | Change | Series Average | Trend* | % Reporting Increase | % Reporting No Change | % Reporting Decrease |
Production | 15.8 | 29.5 | –13.7 | 9.7 | 10(+) | 31.7 | 52.4 | 15.9 |
Capacity Utilization | 13.7 | 23.9 | –10.2 | 7.6 | 10(+) | 28.5 | 56.7 | 14.8 |
New Orders | 9.3 | 30.7 | –21.4 | 4.9 | 10(+) | 22.9 | 63.5 | 13.6 |
Growth Rate of Orders | 16.0 | 19.1 | –3.1 | –1.0 | 3(+) | 27.5 | 61.0 | 11.5 |
Unfilled Orders | 10.1 | 22.7 | –12.6 | –2.5 | 2(+) | 18.0 | 74.1 | 7.9 |
Shipments | 8.4 | 24.8 | –16.4 | 7.9 | 10(+) | 27.0 | 54.4 | 18.6 |
Delivery Time | 7.3 | 17.5 | –10.2 | 0.7 | 6(+) | 15.2 | 76.9 | 7.9 |
Finished Goods Inventories | –10.9 | –9.5 | –1.4 | –3.3 | 2(–) | 9.4 | 70.3 | 20.3 |
Prices Paid for Raw Materials | 55.3 | 52.2 | +3.1 | 28.1 | 78(+) | 56.6 | 42.1 | 1.3 |
Prices Received for Finished Goods | 29.9 | 27.6 | +2.3 | 9.3 | 22(+) | 30.0 | 69.9 | 0.1 |
Wages and Benefits | 20.8 | 27.4 | –6.6 | 21.1 | 78(+) | 23.8 | 73.2 | 3.0 |
Employment | 11.6 | 15.1 | –3.5 | 7.1 | 6(+) | 24.2 | 63.2 | 12.6 |
Hours Worked | 10.1 | 5.6 | +4.5 | 3.0 | 10(+) | 18.7 | 72.7 | 8.6 |
Capital Expenditures | 11.9 | 8.5 | +3.4 | 6.7 | 8(+) | 21.2 | 69.5 | 9.3 |
| General Business Conditions Current (versus previous month) | ||||||||
| Indicator | Oct Index | Sep Index | Change | Series Average | Trend** | % Reporting Improved | % Reporting No Change | % Reporting Worsened |
Company Outlook | 16.1 | 8.7 | +7.4 | 4.2 | 7(+) | 26.3 | 63.5 | 10.2 |
General Business Activity | 13.4 | 9.8 | +3.6 | 0.3 | 4(+) | 25.9 | 61.6 | 12.5 |
| Indicator | Oct Index | Sep Index | Change | Series Average | Trend* | % Reporting Increase | % Reporting No Change | % Reporting Decrease |
Outlook Uncertainty | 7.9 | 11.3 | –3.4 | 16.5 | 10(+) | 18.8 | 70.3 | 10.9 |
| Business Indicators Relating to Facilities and Products in Texas Future (six months ahead) | ||||||||
| Indicator | Oct Index | Sep Index | Change | Series Average | Trend* | % Reporting Increase | % Reporting No Change | % Reporting Decrease |
Production | 39.4 | 40.3 | –0.9 | 36.0 | 78(+) | 46.9 | 45.6 | 7.5 |
Capacity Utilization | 37.8 | 38.8 | –1.0 | 32.8 | 78(+) | 43.4 | 51.0 | 5.6 |
New Orders | 41.9 | 39.5 | +2.4 | 33.5 | 48(+) | 51.3 | 39.3 | 9.4 |
Growth Rate of Orders | 34.8 | 29.2 | +5.6 | 24.7 | 38(+) | 38.9 | 57.0 | 4.1 |
Unfilled Orders | 8.0 | 13.8 | –5.8 | 2.8 | 5(+) | 15.2 | 77.6 | 7.2 |
Shipments | 43.1 | 39.2 | +3.9 | 34.4 | 78(+) | 45.7 | 51.7 | 2.6 |
Delivery Time | 6.7 | 13.9 | –7.2 | –1.1 | 6(+) | 15.6 | 75.5 | 8.9 |
Finished Goods Inventories | 0.0 | 1.8 | –1.8 | –0.2 | 1() | 16.4 | 67.2 | 16.4 |
Prices Paid for Raw Materials | 51.7 | 51.3 | +0.4 | 34.3 | 79(+) | 56.5 | 38.7 | 4.8 |
Prices Received for Finished Goods | 41.0 | 42.8 | –1.8 | 22.0 | 78(+) | 44.3 | 52.5 | 3.3 |
Wages and Benefits | 46.7 | 48.3 | –1.6 | 39.1 | 269(+) | 48.7 | 49.3 | 2.0 |
Employment | 31.5 | 18.1 | +13.4 | 22.7 | 77(+) | 39.7 | 52.1 | 8.2 |
Hours Worked | 15.2 | 14.5 | +0.7 | 8.6 | 8(+) | 19.6 | 76.0 | 4.4 |
Capital Expenditures | 22.2 | 23.1 | –0.9 | 19.4 | 77(+) | 34.9 | 52.4 | 12.7 |
| General Business Conditions Future (six months ahead) | ||||||||
| Indicator | Oct Index | Sep Index | Change | Series Average | Trend** | % Reporting Increase | % Reporting No Change | % Reporting Worsened |
Company Outlook | 31.1 | 31.5 | –0.4 | 18.5 | 18(+) | 39.9 | 51.3 | 8.8 |
General Business Activity | 38.1 | 20.8 | +17.3 | 12.6 | 18(+) | 44.7 | 48.7 | 6.6 |
*Shown is the number of consecutive months of expansion or contraction in the underlying indicator. Expansion is indicated by a positive index reading and denoted by a (+) in the table. Contraction is indicated by a negative index reading and denoted by a (–) in the table.
**Shown is the number of consecutive months of improvement or worsening in the underlying indicator. Improvement is indicated by a positive index reading and denoted by a (+) in the table. Worsening is indicated by a negative index reading and denoted by a (–) in the table.
Data have been seasonally adjusted as necessary.
Comments from survey respondents
Survey participants are given the opportunity to submit comments on current issues that may be affecting their businesses. Some comments have been edited for grammar and clarity.
- We continue to see pressure on profitability. We are profitable, but barely. The challenge is the increase in costs we are paying for our raw materials. The increase in diesel costs is the justification we are being told from our suppliers. Being able to give our employees year-end raises to keep up with inflation will be a further pressure on profitability.
- Higher interest rates affect our industry in a big way.
- A change in government in November will likely affect the future outlook.
- Some product mix changes, but overall we’re forecasting a fairly positive picture over the next 6 months.
- Geopolitics, labor issues and recession/inflation worries.
- Business is strong, with many new existing projects ramping up, and we’re continually receiving new business opportunities.
- Activity is up and down; right now we are up.
- The data center bubble will burst soon, but a viable business model underlies it that will survive, just on a smaller scale. The creative destruction of the free-market system will prevail.
- It's difficult to find manual labor workers right now. We are hopeful the political climate will change in November and things overall will get better.
- We remain concerned about the ongoing USMCA negotiations, particularly as they relate to Mexico and the potential impact on the U.S. aluminum industry. Our industry appreciates that the U.S. Commerce Secretary recognizes the risks associated with reducing tariffs on Mexican aluminum imports. Such reductions could create opportunities for increased shipments and transshipments of aluminum products from Asia and other countries into the U.S. market, potentially undermining the intended protections for American manufacturers. China remains a significant competitive concern for the U.S. aluminum extrusion industry. Chinese aluminum producers benefit from government subsidies, and concerns regarding the use of forced labor in Chinese supply chains raise additional questions about fair competition. These practices can place U.S. manufacturers at a significant disadvantage when competing against artificially low-priced imports. We believe any changes to USMCA must carefully address these risks and prevent trade provisions from becoming a pathway for circumventing U.S. tariffs. Protecting American manufacturing requires trade policies that promote fair competition, enforce meaningful rules of origin and prevent unfairly traded products from gaining an unintended advantage in the U.S. market.
- Data centers spending money on flimsy steel and HVAC systems does not make the economy robust. Rates should come down for those of us that have to support the system in the long term.
- We are getting to be really slow and low on work which concerns me greatly. Many of our competitors were slow this summer when we were busy with large projects we have done for many years in a row during the summer months. Now it's our turn I guess to be slow.
- Fuel pricing and the cost of domestic product increasing are dramatically tempering a recovery in the freight market.
- Outlook plans will depend on the midterm outcomes and the Fed’s interest rate action.
Historical Data
Historical data can be downloaded dating back to June 2004.
Indexes
Download indexes for all indicators. For the definitions of all variables, see Data Definitions.
| Unadjusted |
| Seasonally adjusted |
All Data
Download indexes and components of the indexes (percentage of respondents reporting increase, decrease or no change). For the definitions of all variables, see Data Definitions.
| Unadjusted |
| Seasonally adjusted |
Special questions
For this month’s survey, Texas business executives were asked supplemental questions on credit conditions. Results below include responses from participants from both the Texas Manufacturing Outlook Survey and Texas Service Sector Outlook Survey. View individual survey results.
Questions regarding the Texas Business Outlook Surveys can be addressed to Jesus Cañas.
Sign up for our email alert to be automatically notified as soon as the latest Texas Manufacturing Outlook Survey is released on the web.