Texas Service Sector Growth Surges to Six-Year High

Texas Service Sector Outlook Survey
Texas Service Sector Growth Surges to Six-Year High
For this month’s survey, Texas business executives were asked supplemental questions on the impact of COVID-19, as well as wages, prices and hiring impediments. Results for these questions from the Texas Manufacturing Outlook Survey, Texas Service Sector Outlook Survey and Texas Retail Outlook Survey have been released together. Read the special questions results.
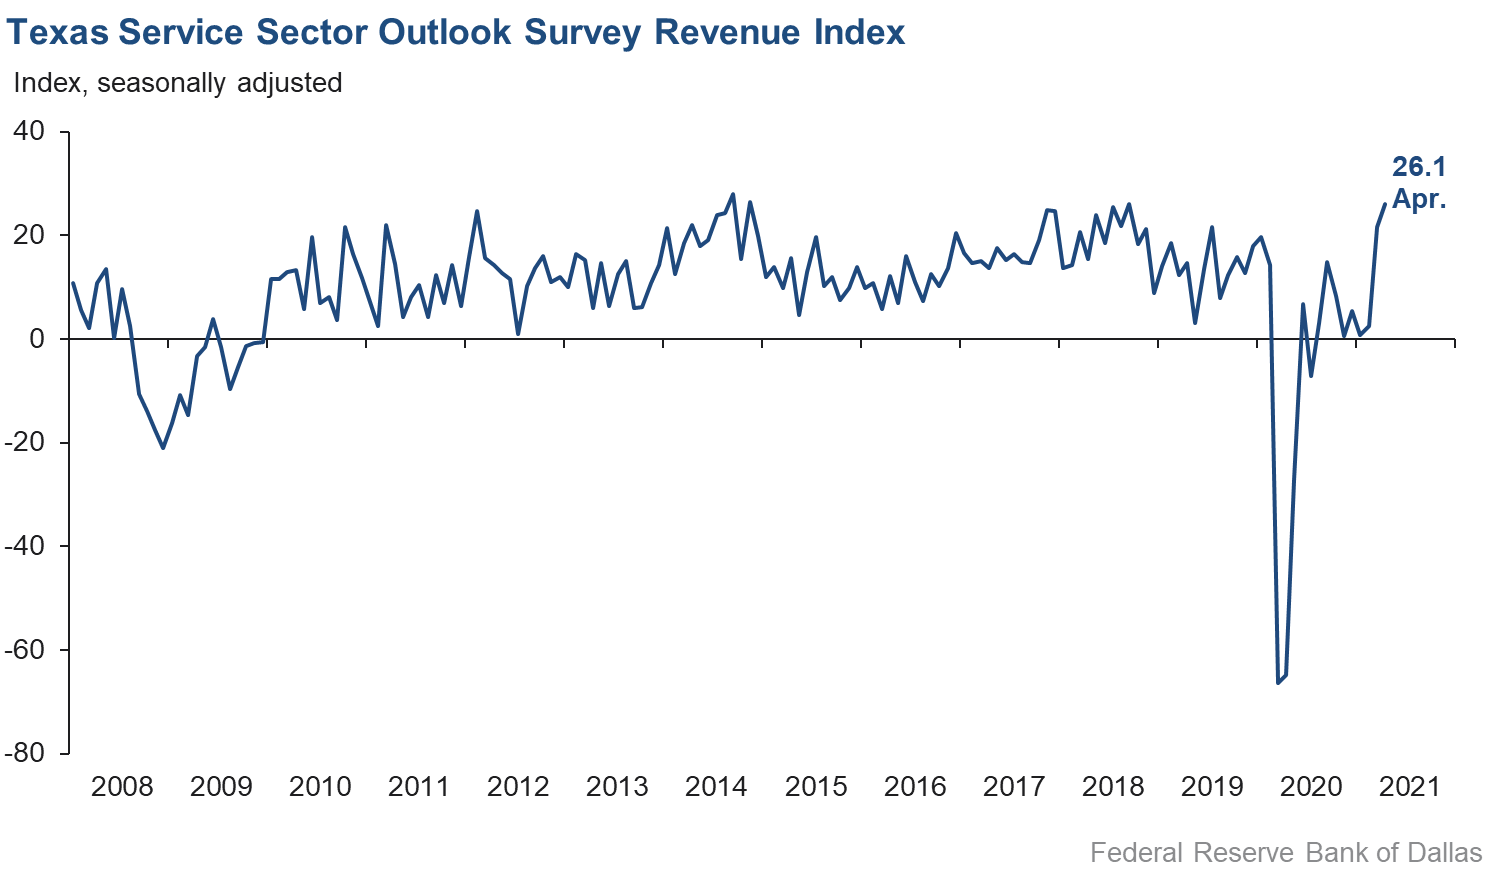
Activity in the Texas service sector in April increased at its fastest pace since late 2014, according to business executives responding to the Texas Service Sector Outlook Survey. The revenue index, a key measure of state service sector conditions, rose from 21.6 in March to 26.1 in April.
Labor market indicators suggest faster employment growth and longer workweeks in April. The employment index rose from 13.1 to 16.8, its highest reading in nearly three years. The hours worked index rose over five points to an all-time high of 13.4, with 18 percent of firms reporting more hours worked among their staff compared with March.
Perceptions of broader business conditions continued to surge to record levels in April. The general business activity index increased six points to 34.9, while the company outlook index rose three points to 29.2—both record highs since the beginning of the survey in 2007. The outlook uncertainty index held roughly unchanged at -10.4, suggesting a net decrease in uncertainty.
Price and wage pressures continued to increase in April. The selling prices index rose six-and-a-half points to 18.6, while the input prices index rose nearly eight points to 34.3—both highs last reached in 2018. The wages and benefits index increased from 19.9 to 21.5.
Respondents’ expectations regarding future business activity reflected heightened optimism this month. The future general business activity index increased to a record high of 45.6, with a majority of respondents expecting improved activity. The future revenue index rose from 55.0 to 58.5—close to its 2007 all-time high—while the strong positive readings in other future service sector activity indexes such as employment and capital expenditures point to robust growth over the next six months.

Texas Retail Outlook Survey
Texas Retail Sales Growth Moderates in April
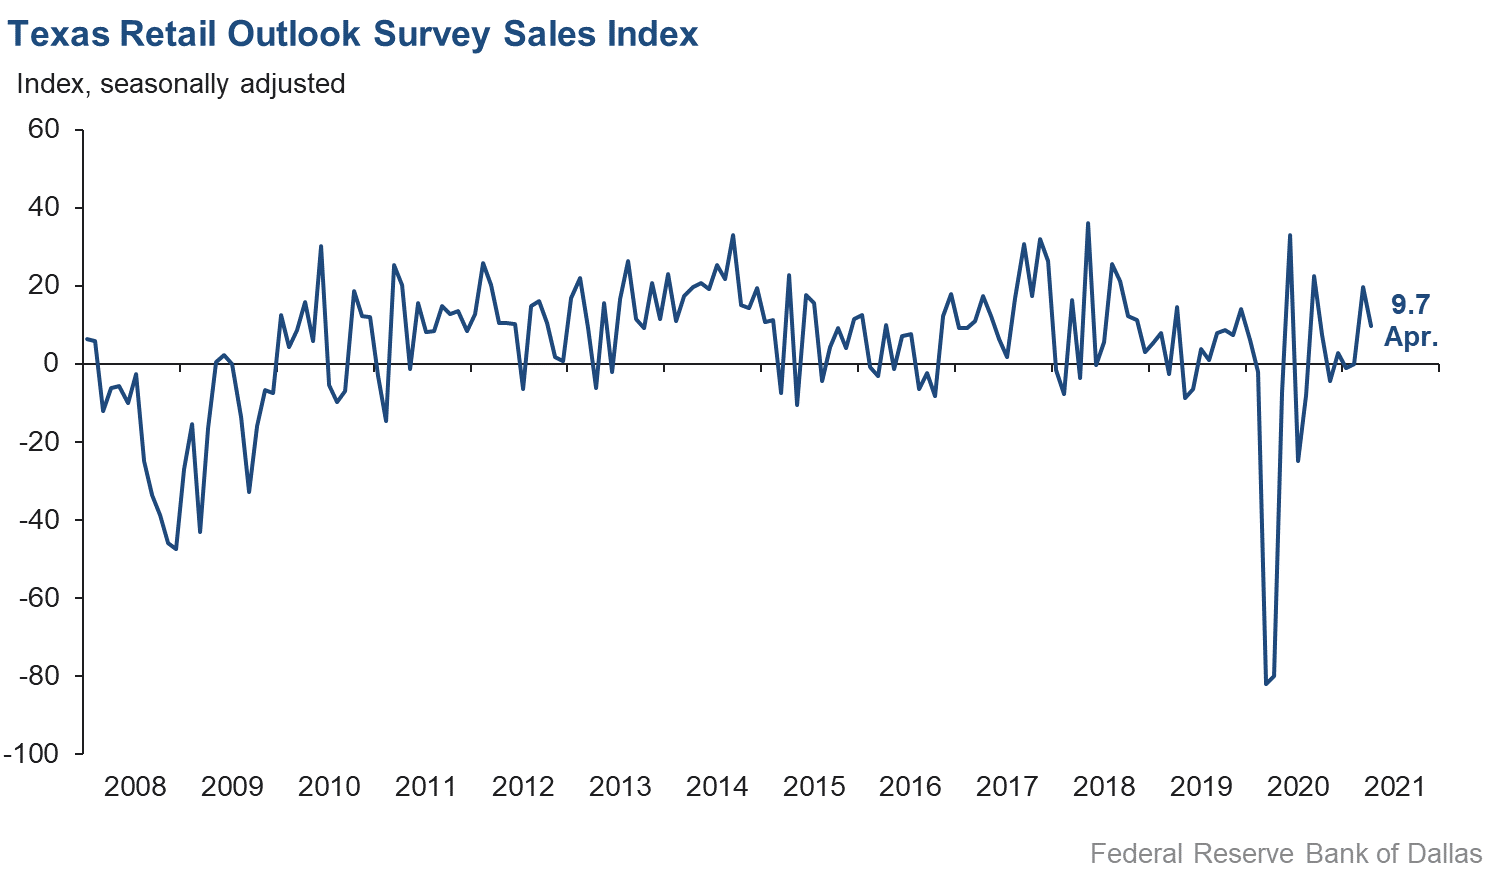
Retail sales activity continued to increase but at a slower pace in April, according to business executives responding to the Texas Retail Outlook Survey. The sales index, a key measure of state retail activity, fell from 19.6 in March to 9.7 in April. Inventories continued to fall sharply, with the inventories index holding steady at an eight-month low of -14.8.
Retail labor market indicators continued to improve, with notable growth in employment and lengthening of the average workweek. The employment index climbed over six points to 10.9, with over 15 percent of respondents reporting increased employment compared with March. The hours worked index increased from 0.9 to 5.7, its highest reading in over a year.
Retailers’ perceptions of broader business conditions remained strongly optimistic, despite some softening in expectations compared with last month. The general business activity index pulled back from a record high to 27.8, while the company outlook index dropped 17 points to 17.8. The outlook uncertainty index increased from -9.3 to 4.1, suggesting increased retailer uncertainty.
Retailers saw continued acceleration of price pressures and elevated wage pressures compared with March. The selling prices index rose over six points to a record high of 40.4, with 47 percent of respondents increasing prices over last month. The input prices index surged 14 points to 48.4—its highest reading since 2011; the wages and benefits index dipped about five points to 17.1.
Retailer optimism regarding future activity remained high in April. The future general business activity index rose from 40.8 to a new record high of 42.0, while the future sales index held steady at a four-year high of 46.9. Other indexes of future retail activity such as employment held close to historical levels, pointing to expectations of robust retail activity through the rest of the year.
The Texas Retail Outlook Survey is a component of the Texas Service Sector Outlook Survey that uses information only from respondents in the retail and wholesale sectors.
Next release: June 2, 2021
Data were collected April 13–21, and 283 Texas service sector business executives, of which 50 were retailers, responded to the survey. The Dallas Fed conducts the Texas Service Sector Outlook Survey monthly to obtain a timely assessment of the state’s service sector activity. Firms are asked whether revenue, employment, prices, general business activity and other indicators increased, decreased or remained unchanged over the previous month.
Survey responses are used to calculate an index for each indicator. Each index is calculated by subtracting the percentage of respondents reporting a decrease from the percentage reporting an increase. When the share of firms reporting an increase exceeds the share reporting a decrease, the index will be greater than zero, suggesting the indicator has increased over the prior month. If the share of firms reporting a decrease exceeds the share reporting an increase, the index will be below zero, suggesting the indicator has decreased over the prior month. An index will be zero when the number of firms reporting an increase is equal to the number of firms reporting a decrease. Data have been seasonally adjusted as necessary.
Texas Service Sector Outlook Survey
Historical data are available from January 2007 to the most current release month.
| Business Indicators Relating to Facilities and Products in Texas Current (versus previous month) | ||||||||
| Indicator | Apr Index | Mar Index | Change | Series Average | Trend* | % Reporting Increase | % Reporting No Change | % Reporting Decrease |
Revenue | 26.1 | 21.6 | +4.5 | 10.8 | 9(+) | 39.1 | 48.0 | 13.0 |
Employment | 16.8 | 13.1 | +3.7 | 6.0 | 9(+) | 22.4 | 72.0 | 5.6 |
Part–Time Employment | 6.6 | 4.6 | +2.0 | 1.2 | 5(+) | 11.6 | 83.4 | 5.0 |
Hours Worked | 13.4 | 8.3 | +5.1 | 2.3 | 8(+) | 17.5 | 78.4 | 4.1 |
Wages and Benefits | 21.5 | 19.9 | +1.6 | 13.9 | 11(+) | 23.4 | 74.7 | 1.9 |
Input Prices | 34.3 | 26.5 | +7.8 | 24.9 | 12(+) | 35.7 | 62.9 | 1.4 |
Selling Prices | 18.6 | 12.1 | +6.5 | 5.2 | 9(+) | 23.0 | 72.6 | 4.4 |
Capital Expenditures | 10.5 | 9.4 | +1.1 | 9.5 | 8(+) | 16.6 | 77.3 | 6.1 |
| General Business Conditions Current (versus previous month) | ||||||||
| Indicator | Apr Index | Mar Index | Change | Series Average | Trend** | % Reporting Improved | % Reporting No Change | % Reporting Worsened |
Company Outlook | 29.2 | 26.1 | +3.1 | 5.1 | 9(+) | 35.4 | 58.4 | 6.2 |
General Business Activity | 34.9 | 28.9 | +6.0 | 3.0 | 3(+) | 42.5 | 49.8 | 7.6 |
| Indicator | Apr Index | Mar Index | Change | Series Average | Trend* | % Reporting Increase | % Reporting No Change | % Reporting Decrease |
Outlook Uncertainty† | –10.4 | –10.0 | –0.4 | 11.3 | 2(–) | 14.3 | 61.0 | 24.7 |
| Business Indicators Relating to Facilities and Products in Texas Future (six months ahead) | ||||||||
| Indicator | Apr Index | Mar Index | Change | Series Average | Trend* | % Reporting Increase | % Reporting No Change | % Reporting Decrease |
Revenue | 58.5 | 55.0 | +3.5 | 37.0 | 12(+) | 65.0 | 28.5 | 6.5 |
Employment | 41.6 | 35.2 | +6.4 | 21.8 | 12(+) | 46.7 | 48.2 | 5.1 |
Part–Time Employment | 15.0 | 14.3 | +0.7 | 6.4 | 11(+) | 19.1 | 76.8 | 4.1 |
Hours Worked | 17.2 | 14.3 | +2.9 | 5.6 | 12(+) | 20.7 | 75.8 | 3.5 |
Wages and Benefits | 46.1 | 43.8 | +2.3 | 35.7 | 12(+) | 47.9 | 50.3 | 1.8 |
Input Prices | 46.4 | 42.7 | +3.7 | 43.3 | 172(+) | 48.7 | 48.8 | 2.3 |
Selling Prices | 32.2 | 31.1 | +1.1 | 22.8 | 12(+) | 36.7 | 58.8 | 4.5 |
Capital Expenditures | 29.4 | 32.6 | –3.2 | 23.1 | 11(+) | 32.8 | 63.7 | 3.4 |
| General Business Conditions Future (six months ahead) | ||||||||
| Indicator | Apr Index | Mar Index | Change | Series Average | Trend** | % Reporting Improved | % Reporting No Change | % Reporting Worsened |
Company Outlook | 41.1 | 40.6 | +0.5 | 16.4 | 9(+) | 47.0 | 47.1 | 5.9 |
General Business Activity | 45.6 | 42.4 | +3.2 | 13.4 | 9(+) | 51.5 | 42.6 | 5.9 |
Historical data are available from January 2007 to the most current release month.
| Business Indicators Relating to Facilities and Products in Texas Retail (versus previous month) | ||||||||
| Indicator | Apr Index | Mar Index | Change | Series Average | Trend* | % Reporting Increase | % Reporting No Change | % Reporting Decrease |
| Retail Activity in Texas | ||||||||
Sales | 9.7 | 19.6 | –9.9 | 5.7 | 2(+) | 34.9 | 39.9 | 25.2 |
Employment | 10.9 | 4.7 | +6.2 | 1.7 | 2(+) | 15.2 | 80.5 | 4.3 |
Part–Time Employment | 3.9 | 6.0 | –2.1 | –2.0 | 2(+) | 10.3 | 83.3 | 6.4 |
Hours Worked | 5.7 | 0.9 | +4.8 | –2.0 | 2(+) | 13.0 | 79.7 | 7.3 |
Wages and Benefits | 17.1 | 21.9 | –4.8 | 9.2 | 9(+) | 22.1 | 72.9 | 5.0 |
Input Prices | 48.4 | 34.3 | +14.1 | 19.3 | 12(+) | 50.8 | 46.8 | 2.4 |
Selling Prices | 40.4 | 33.9 | +6.5 | 10.7 | 11(+) | 46.8 | 46.7 | 6.4 |
Capital Expenditures | 2.8 | 15.2 | –12.4 | 7.3 | 3(+) | 9.3 | 84.2 | 6.5 |
Inventories | –14.8 | –14.8 | 0.0 | 2.2 | 2(–) | 18.1 | 49.0 | 32.9 |
| Companywide Retail Activity | ||||||||
Companywide Sales | 8.0 | 19.7 | –11.7 | 7.0 | 2(+) | 34.7 | 38.6 | 26.7 |
Companywide Internet Sales | 2.5 | 13.9 | –11.4 | 6.1 | 2(+) | 18.1 | 66.3 | 15.6 |
| General Business Conditions, Retail Current (versus previous month) | ||||||||
| Indicator | Apr Index | Mar Index | Change | Series Average | Trend** | % Reporting Improved | % Reporting No Change | % Reporting Worsened |
Company Outlook | 17.8 | 34.9 | –17.1 | 3.5 | 2(+) | 28.9 | 60.0 | 11.1 |
General Business Activity | 27.8 | 35.2 | –7.4 | –0.6 | 2(+) | 39.1 | 49.6 | 11.3 |
| Outlook Uncertainty Current (versus previous month) | ||||||||
| Indicator | Apr Index | Mar Index | Change | Series Average | Trend* | % Reporting Increase | % Reporting No Change | % Reporting Decrease |
Outlook Uncertainty† | 4.1 | –9.3 | +13.4 | 9.2 | 1(+) | 20.4 | 63.3 | 16.3 |
| Business Indicators Relating to Facilities and Products in Texas, Retail Future (six months ahead) | ||||||||
| Indicator | Apr Index | Mar Index | Change | Series Average | Trend* | % Reporting Increase | % Reporting No Change | % Reporting Decrease |
| Retail Activity in Texas | ||||||||
Sales | 46.9 | 46.4 | +0.5 | 32.1 | 12(+) | 57.8 | 31.3 | 10.9 |
Employment | 33.6 | 32.5 | +1.1 | 12.1 | 12(+) | 37.2 | 59.2 | 3.6 |
Part–Time Employment | 15.9 | 16.1 | –0.2 | 0.9 | 9(+) | 19.0 | 77.9 | 3.1 |
Hours Worked | 11.7 | 9.3 | +2.4 | 2.7 | 12(+) | 15.5 | 80.7 | 3.8 |
Wages and Benefits | 41.4 | 42.7 | –1.3 | 27.3 | 12(+) | 44.2 | 53.0 | 2.8 |
Input Prices | 59.6 | 49.0 | +10.6 | 32.9 | 12(+) | 61.7 | 36.2 | 2.1 |
Selling Prices | 48.9 | 43.4 | +5.5 | 28.9 | 12(+) | 53.2 | 42.6 | 4.3 |
Capital Expenditures | 34.0 | 34.7 | –0.7 | 17.2 | 11(+) | 38.3 | 57.4 | 4.3 |
Inventories | 41.5 | 40.3 | +1.2 | 9.2 | 12(+) | 50.5 | 40.5 | 9.0 |
| Companywide Retail Activity | ||||||||
Companywide Sales | 41.8 | 51.0 | –9.2 | 30.6 | 12(+) | 50.9 | 40.0 | 9.1 |
Companywide Internet Sales | 33.3 | 47.5 | –14.2 | 22.1 | 13(+) | 39.4 | 54.5 | 6.1 |
| General Business Conditions, Retail Future (six months ahead) | ||||||||
| Indicator | Apr Index | Mar Index | Change | Series Average | Trend** | % Reporting Improved | % Reporting No Change | % Reporting Worsened |
Company Outlook | 32.6 | 48.1 | –15.5 | 17.2 | 12(+) | 40.7 | 51.2 | 8.1 |
General Business Activity | 42.0 | 40.8 | +1.2 | 13.0 | 9(+) | 49.2 | 43.5 | 7.2 |
*Shown is the number of consecutive months of expansion or contraction in the underlying indicator. Expansion is indicated by a positive index reading and denoted by a (+) in the table. Contraction is indicated by a negative index reading and denoted by a (–) in the table.
**Shown is the number of consecutive months of improvement or worsening in the underlying indicator. Improvement is indicated by a positive index reading and denoted by a (+) in the table. Worsening is indicated by a negative index reading and denoted by a (–) in the table.
†Added to survey in January 2018.
Data have been seasonally adjusted as necessary, with the exception of the outlook uncertainty index which does not yet have a sufficiently long time series to test for seasonality.
Texas Service Sector Outlook Survey
Texas Retail Outlook Survey
Texas Service Sector Outlook Survey
Comments from Survey Respondents
These comments are from respondents’ completed surveys and have been edited for publication.
- General business activity has picked up.
- The slow recovery over the past few months reduces uncertainty. There is still uncertainty for the global recovery, but we are also cautiously optimistic with increasing vaccines.
- Staffing has been our biggest issue.
- Everything is holding steady for the moment.
- Prospective business looks good. The level of purchasing activities is increasing. The issue remains of finding skilled employees to do the work. The backlog of work is increasing and will eventually impact the growth we can take on. Local recruiters are not finding the talent we need. We've recently expanded the searches to other states.
- The political environment is still the biggest concern for our industry—just simply not knowing what is next and how the current administrative actions will impact the economy. The disaster at the border is certainly disconcerting for everyone, and the blatant mismanagement of the crisis will have negative implications for a long time. The PPP [Paycheck Protection Program] has been a very timely benefit for banks and customers. One has to wonder what the plan will be to repay the huge debt the government has incurred and how those decisions will affect the working class. The activity in the real estate market has been very busy with many transactions and mainly 1031 exchanges [swapping of one investment property for another, which allows capital gains taxes to be deferred]. [Homeowners] are selling property in the cities or suburbs and moving to the country.
- The cost of used vehicles is rising dramatically.
- I feel like the Texas economy is getting more open and vibrant, but the threat of new COVID-19 strains and federal tax policy and the immigration crisis all seem to be negatively affecting attitudes in this red state.
- I feel like we are in a residential real estate market bubble that will start to deflate by fourth quarter 2021.
- [Things are] pretty good at the moment.
- The overall level of business activity in the real estate market has increased over the past two months. The commercial market has been improving since December, and our orders have ballooned over the past two months. The residential sector has continued its strong growth since last year with no end in sight. All is positive in the real estate market.
- We have seen an uptick in business generally, led by matters arising from the winter storm and increasing litigation activity.
- Vaccinations have helped a lot.
- We have a shortage of qualified [workers in the] professional workforce in our architectural business. It is hampering our capacity to take on more projects.
- Our only concern is a coronavirus surge and people refusing vaccinations.
- It is an active business environment right now, and we are optimistic it holds. We will watch and wait.
- The winter storm has increased our business significantly.
- Contracted sales are on schedule to increase over the next three quarters.
- We are seeing an uptick in requests for proposals and inquiry calls for consulting services, which we appreciate. It gives us hope that nonprofits are trying their best to get back to business and do the critical capacity-building work they need to do to weather situations such as COVID-19.
- Design and construction activity is booming in the industrial and single-family markets.
- I do not expect a significant improvement in the energy arena until 2022. The oil price will need to stay at $60 or above for at least another six months to get projects started and restarted. I have concerns that a U.S.–Iran deal will hurt the market (my understanding is it would put another two million barrels per day on the market), although, as slow as diplomatic deals go, it is probably at least two years away.
- We have had several mid-market client companies call in early April to ask us to start screening candidates for multiple hires beginning in May. One client whose manufacturing facility is closing has extended their closing date to accommodate an influx of new orders. We are cautiously optimistic that hiring will continue to tick up throughout the summer and into the third quarter.
- Overall, all sectors have picked up from the last month. The only weak sector is still oil and gas as it relates to new equipment and units.
- Labor is still a major issue, causing uncertainty toward production. We have openings throughout the company that are unfilled. Moreover, there are no applicants applying for the positions. There are supply shortages that are also affecting production.
- Luxury travel is selling at inconsistent volumes. Prices are increasing for airfares, hotels and such. Travelers remain anxious on many levels in terms of COVID safety, COVID restrictions and the possibility of being quarantined.
- I am beginning to see inflationary pressures in the industrial and consumer goods we purchase. I am very nervous that cost-push inflation is prevalent in the economy; the antidote is contractionary monetary policy, and we are in an accommodative posture. Problems ahead, I’m afraid.
- Monthly Fed limerick: Business leaders on tilt about rising rates; plus FOMO [fear of missing out], crypto, new taxation on estates; wondering if the Fed will pause; perhaps justified and/or because; was this ever easy? Ready for fed gov [federal government] debates.
- The general level of uncertainty has decreased, but the reciprocal expected increase in business has not happened at the small business level. The larger companies are in a much better position to take advantage of this environment and gain more market share from the small-scale businesses due to the technology and HR resources available for the larger entities. This situation continues to put additional pressure on the small business sector.
- Coming out of COVID visitation restrictions and being able to once again have in-person sales events and marketing opportunities have fostered renewed interest in our community. Results are positive now and promising for continued refilling of our available senior houses and apartments.
- Stimulus checks and extended unemployment have taken many workers out of the market. We are facing a shortage of supply of workers.
- Business levels are improving faster than our ability to staff open positions. It appears the extension of unemployment benefits from the federal government is keeping people from returning to work. The result is that we are unable to open our business fully and are having to limit activity due to lack of staff. Pay rates have been increased significantly, and we are offering sign-on and referral bonuses, but the applicant pace is very slow.
- An inability to find staff has created challenges in ramping up sales.
- Let me explain my response. Since spring break, we had three weeks of strong leisure activity. In April, we have continued to see strong leisure activity on weekends. We have also seen business related to the current border issue regarding the children crossing the border. Our April will be 25 percent higher than we anticipated only a few weeks ago. Our current expectation is that this demand will continue into May. By Memorial Day, we see leisure demand being very high through mid-August. As for six months from now, we forecasted significantly higher business in the fourth quarter. At the moment, we believe we are on track to attain that result.
- We need everyone to be vaccinated, especially teachers. Then more will go back to work in their offices. This is super important for fine-dining restaurants so they can open for lunches. We are stalled until folks go back to their offices.
- Other restaurant owners have mentioned problems with staff shortages; we were not having [this problem] but [have now] started having [this problem].
- I am still waiting for [our corporate partner] to authorize me to go back and operate my push carts and start selling my hot dogs, soft drinks and nachos that represent 60 percent of my revenue.
- Staffing and labor are the biggest challenges to growing our business. There are not enough willing workers to fill the jobs.
- Business has improved, and we are almost back to normal.
- We are in desperate need of employees. We have massively increased our efforts to recruit, but no one wants to work. Most applicants say they are happy with their stimulus money and are living on it instead of using it to get ahead.
- This year has been marked by disruption and instability around the globe and in North Texas. Big issues in human health and social equity have impacted the lives of every organization and every individual. But enabled by the trust of the community in our knowledge and judgment and by the strategic direction we’ve been reinforcing for a decade, [we have] been able to lead leaders and unite givers at levels unprecedented for us. The year might have turned out very differently for us and for those we serve had our purpose and path been less defined, and for that, we have many to thank. I’m very proud of our team, our boards, our volunteers and our donors, because with them, [our organization] has achieved its goals in a difficult period and is starting a new fiscal year with clarity of purpose and a path for continued success.
- March included revenue that was a carryover from our customers responding to the Texas ice-storm-related damage. This revenue will not occur in April. April has started off very sluggish, which is the reason for my "worsened" outlook. Additionally, we are seeing unprecedented price increases from our manufacturers, creating more uncertainty for our business as the ability to pass along these increases is paramount to maintaining our employment levels.
- Our economic fundamentals indicate the next six to nine months will be positive. We are concerned about the federal government’s policies—a lack of action on immigration and regulation—and believe they will negatively impact Texas and our business at some point in the future.
- Commodity prices are starting to impact large construction starts, and inflationary pressure on copper, steel, etc., are a cause for concern.
- Our vendors usually have price changes once per year in January. Now, we have been advised to expect another round of price increases in July. Increased prices are not good. We have not experienced any increase in school business with many of the schools still closed. Property tax assessed values for 2021 have been increased from 4 percent to 16 percent on our facilities, which is not reality. Medical benefits costs continue to increase.
- With deeper penetration of vaccinations into the general population, I'm hopeful the economy starts to reopen to retail businesses outside Texas. I'm still confident there is a lot of pent-up demand to eat out and socialize, so I'm confident our business will benefit from a general reopening.
- Inventory shortages and distribution disruptions are a major challenge for meeting customer demands.
- The chip shortage is hurting supply. Inventory of new vehicles is 50 percent of normal. Demand for both new and used vehicles is strong, but inventory shortage in both new and used [vehicles] is a huge problem.
- There is too much federal incentive to stay unemployed. A six percent (and declining) unemployment [rate] and increasing employment is not a crisis that needs money borrowed to write checks to many who don’t need it.
- Supply chain interruptions with our auto manufacturers due to chip shortages have increased prices in both the new- and used-car market to levels I haven't seen in 40 years.
- Our business model will be significantly impacted until the chip issue is resolved and inventories are back to an acceptable level. We continue to experience low daily supply of new and preowned inventory. Preowned values are at all-time high—up 15 percent or more from 2020.
- The current chip shortage has severely impacted the automobile business. Factories have had to shut down, and inventories at the dealer level are lower than I can ever remember. Without inventory to sell, I expect auto sales will suffer in April and May.
- Runaway pricing in building materials along with shortages across the board are limiting our growth. Our increases in sales at this time are due to inflated prices over the last year and not an increase in units sold. Availability is really limiting our growth at this time.
Historical Data
Historical data can be downloaded dating back to January 2007.
Indexes
Download indexes for all indicators. For the definitions of all variables, see Data Definitions.
Texas Service Sector Outlook Survey |
Texas Retail Outlook Survey |
| Unadjusted | Unadjusted |
| Seasonally adjusted | Seasonally adjusted |
All Data
Download indexes and components of the indexes (percentage of respondents reporting increase, decrease, or no change). For the definitions of all variables, see Data Definitions.
Texas Service Sector Outlook Survey |
Texas Retail Outlook Survey |
| Unadjusted | Unadjusted |
| Seasonally adjusted | Seasonally adjusted |
Questions regarding the Texas Service Sector Outlook Survey can be addressed to Christopher Slijk at christopher.slijk@dal.frb.org.
Sign up for our email alert to be automatically notified as soon as the latest Texas Service Sector Outlook Survey is released on the web.