Texas Service Sector Growth Weakens Further in September

Texas Service Sector Outlook Survey
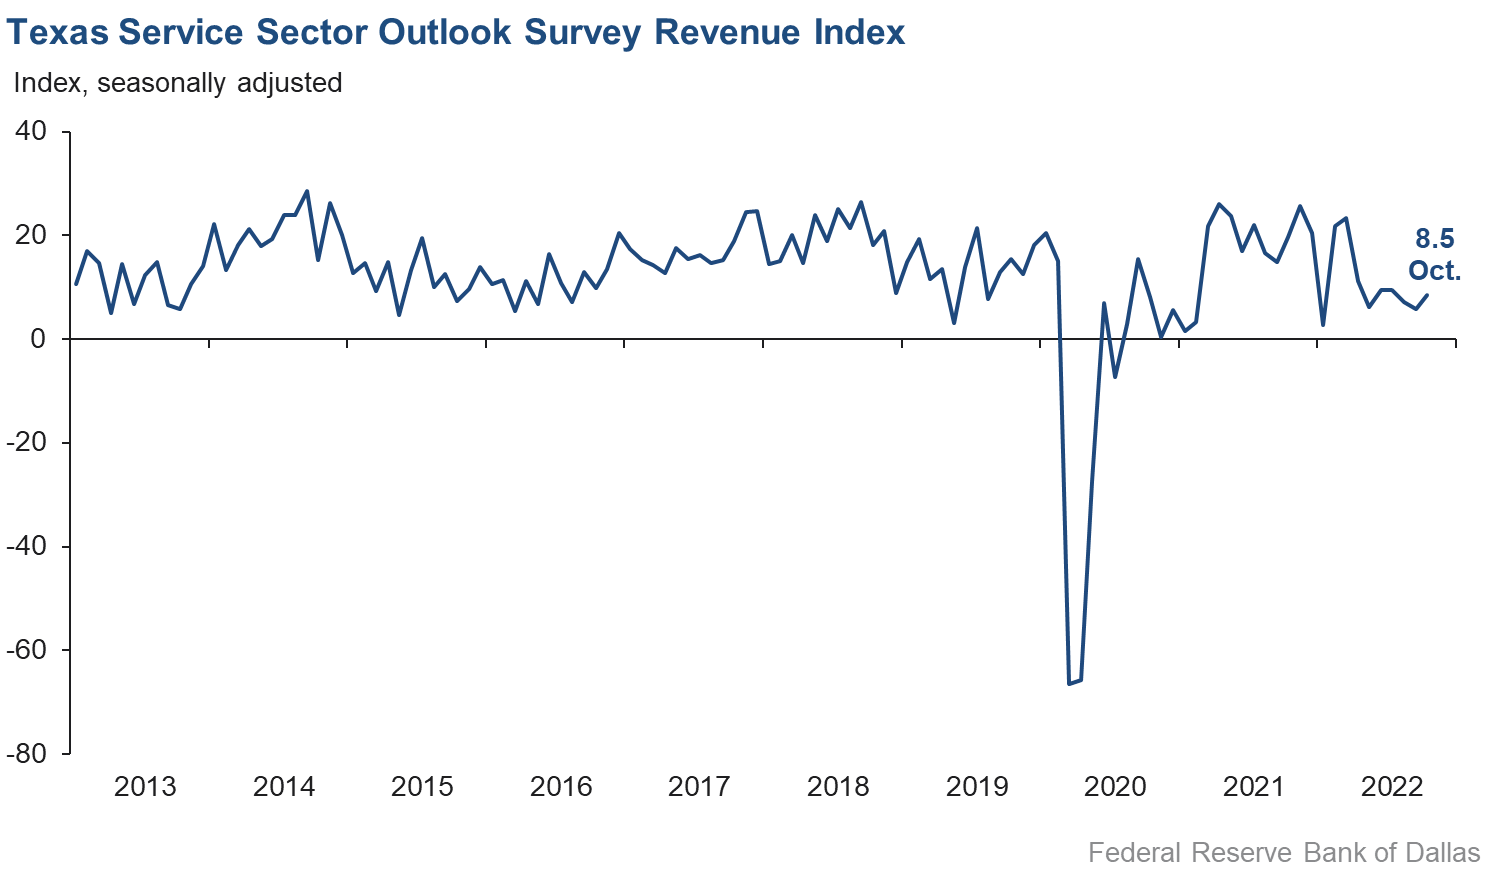
Texas Service Sector Growth Improves in October
For this month’s survey, Texas business executives were asked supplemental questions on labor market conditions. Results for these questions from the Texas Manufacturing Outlook Survey, Texas Service Sector Outlook Survey and Texas Retail Outlook Survey have been released together. Read the special questions results.
Activity in the Texas service sector increased at a faster pace in October, according to business executives responding to the Texas Service Sector Outlook Survey. The revenue index, a key measure of state service sector conditions, improved from 5.9 in September to 8.5 in October, although the share of firms reporting increasing revenues remained around 30 percent.
Labor market indicators suggested continued employment growth and longer workweeks in October. The employment index fell one point to 9.0, while the part-time employment index improved from 1.5 in September to 2.9 in October. The hours worked index moved up two points to 5.1.
Perceptions of broader business conditions worsened further in October, and uncertainty continued to increase. The general business activity index fell sharply from -5.4 in September to -13.6 in October, its lowest level since July 2020. The company outlook index also fell from -1.4 to -9.1, while the outlook uncertainty index increased 13 points to 27.6.
Growth in selling prices and wage pressures continued to moderate in October, while input price growth picked up slightly. Nevertheless, the indexes remained well above historical averages. The selling prices index edged down from 21.1 to 19.7, while the input prices index increased three points to 51.4. The wages and benefits index slipped from 24.6 to 22.9.
Respondents’ expectations regarding future business activity were mixed in October. The future general business activity index worsened from -6.7 to -13.2, but the future revenue index remained positive despite dipping nearly three points to 32.2. Other indexes of future service sector activity such as employment and capital expenditures also remained positive, suggesting continued growth over the next six months.

Texas Retail Outlook Survey
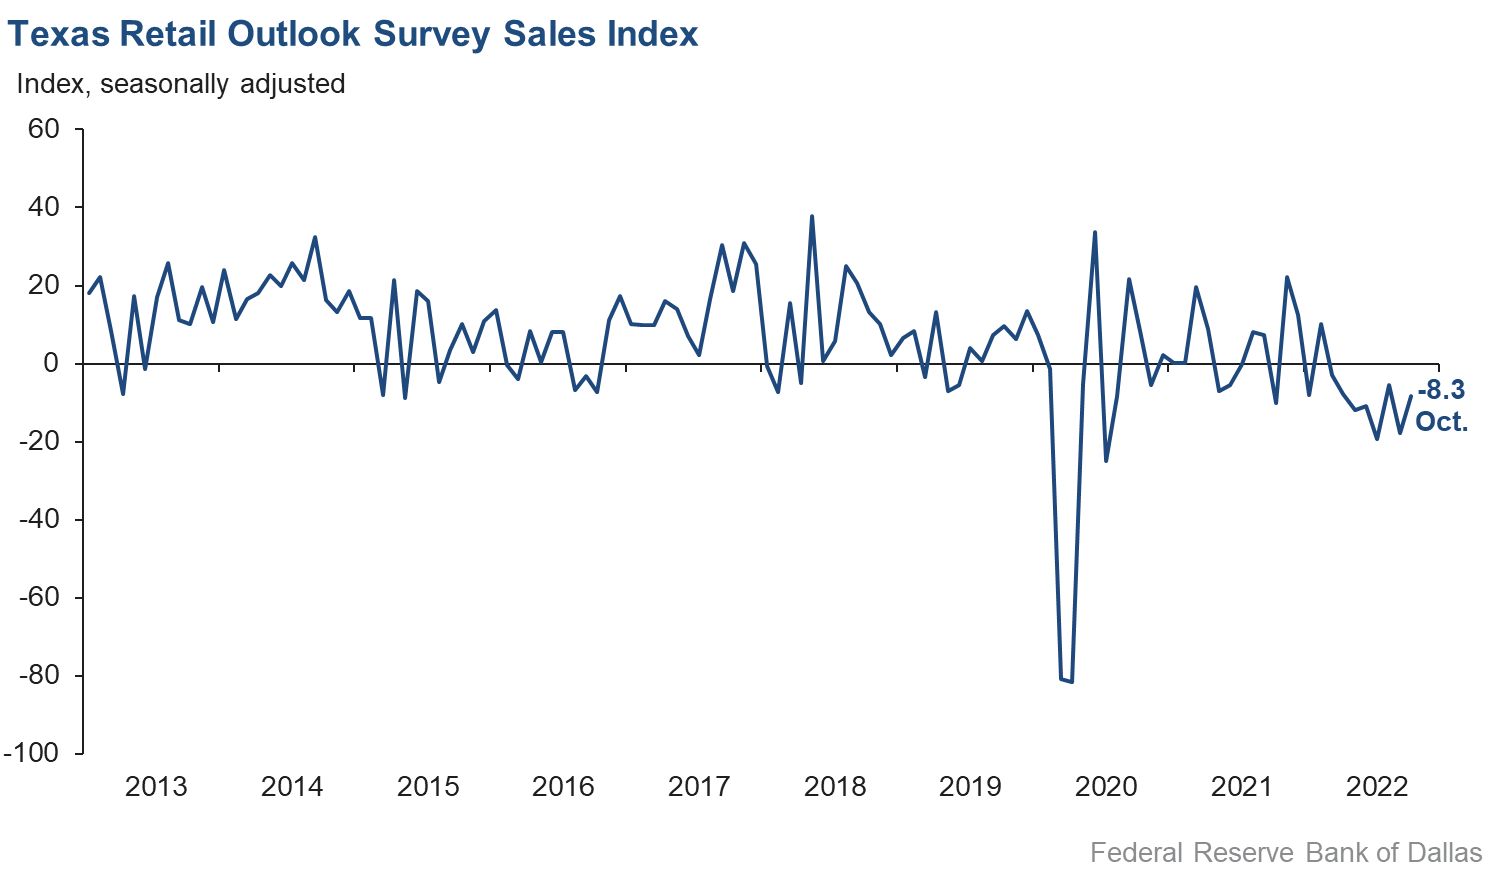
Texas Retail Sales Fall at Slower Pace in Octobe
October retail sales activity declined, though at a slower pace than in September, according to business executives responding to the Texas Retail Outlook Survey. The sales index, a key measure of state retail activity, increased 10 points to -8.3. Retailers’ inventories continued to increase on net, as the inventories index inched down from 10.1 to 8.9, suggesting inventories grew at a slightly slower pace than in September.
Retail labor market indicators reflected continued employment growth and steady workweeks in October. The employment index remained basically unchanged at 3.7. The part-time employment index remained in negative territory and fell from -0.5 to -1.9. The hours worked index increased from -7.3 to -0.9, with the share of firms reporting an increase in average hours worked among employees growing from 5.8 to 8.8 percent.
Retailers’ perceptions of broader business conditions continued to worsen in October, as both the general business activity and company outlook indexes remained deeply in negative territory. The general business activity index was largely unchanged at -21.4, while the company outlook index remained flat at -13.9. The outlook uncertainty index increased notably from 8.2 to 20.6.
Retail wage and price pressures eased in October. The selling prices index dropped 11 points to 21.2, its lowest level since November 2020. The input prices index fell from 47.6 to 41.2, while the wages and benefits index decreased three points to 14.1.
Expectations for future retail growth were mixed in October. The future general business activity index fell from -19.1 to -22.0, while the future sales index increased two points to 8.2, reflecting continued growth expectations. Other indexes of future retail activity such as employment and capital expenditures also moved further into positive territory, suggesting expectations for continued growth over the next six months.
The Texas Retail Outlook Survey is a component of the Texas Service Sector Outlook Survey that uses information only from respondents in the retail and wholesale sectors.
Next release: November 29, 2022
Data were collected October 18–26, and 336 Texas service sector business executives, of which 70 were retailers, responded to the survey. The Dallas Fed conducts the Texas Service Sector Outlook Survey monthly to obtain a timely assessment of the state’s service sector activity. Firms are asked whether revenue, employment, prices, general business activity and other indicators increased, decreased or remained unchanged over the previous month.
Survey responses are used to calculate an index for each indicator. Each index is calculated by subtracting the percentage of respondents reporting a decrease from the percentage reporting an increase. When the share of firms reporting an increase exceeds the share reporting a decrease, the index will be greater than zero, suggesting the indicator has increased over the prior month. If the share of firms reporting a decrease exceeds the share reporting an increase, the index will be below zero, suggesting the indicator has decreased over the prior month. An index will be zero when the number of firms reporting an increase is equal to the number of firms reporting a decrease. Data have been seasonally adjusted as necessary.
Texas Service Sector Outlook Survey
Historical data are available from January 2007 to the most current release month.
| Business Indicators Relating to Facilities and Products in Texas Current (versus previous month) | ||||||||
| Indicator | Oct Index | Sep Index | Change | Series Average | Trend* | % Reporting Increase | % Reporting No Change | % Reporting Decrease |
Revenue | 8.5 | 5.9 | +2.6 | 11.2 | 27(+) | 31.1 | 46.3 | 22.6 |
Employment | 9.0 | 10.4 | –1.4 | 6.6 | 27(+) | 18.2 | 72.6 | 9.2 |
Part–Time Employment | 2.9 | 1.5 | +1.4 | 1.6 | 23(+) | 8.1 | 86.7 | 5.2 |
Hours Worked | 5.1 | 2.9 | +2.2 | 2.9 | 26(+) | 10.5 | 84.1 | 5.4 |
Wages and Benefits | 22.9 | 24.6 | –1.7 | 15.6 | 29(+) | 27.3 | 68.3 | 4.4 |
Input Prices | 51.4 | 48.5 | +2.9 | 27.2 | 30(+) | 54.6 | 42.2 | 3.2 |
Selling Prices | 19.7 | 21.1 | –1.4 | 7.2 | 27(+) | 28.0 | 63.7 | 8.3 |
Capital Expenditures | 12.6 | 11.8 | +0.8 | 10.1 | 26(+) | 19.2 | 74.2 | 6.6 |
| General Business Conditions Current (versus previous month) | ||||||||
| Indicator | Oct Index | Sep Index | Change | Series Average | Trend** | % Reporting Improved | % Reporting No Change | % Reporting Worsened |
Company Outlook | –9.1 | –1.4 | –7.7 | 5.3 | 5(–) | 12.6 | 65.7 | 21.7 |
General Business Activity | –13.6 | –5.4 | –8.2 | 3.7 | 5(–) | 13.9 | 58.6 | 27.5 |
| Indicator | Oct Index | Sep Index | Change | Series Average | Trend* | % Reporting Increase | % Reporting No Change | % Reporting Decrease |
Outlook Uncertainty† | 27.6 | 14.4 | +13.2 | 12.9 | 17(+) | 36.8 | 54.1 | 9.2 |
| Business Indicators Relating to Facilities and Products in Texas Future (six months ahead) | ||||||||
| Indicator | Oct Index | Sep Index | Change | Series Average | Trend* | % Reporting Increase | % Reporting No Change | % Reporting Decrease |
Revenue | 32.2 | 34.8 | –2.6 | 37.8 | 30(+) | 49.6 | 32.9 | 17.4 |
Employment | 24.6 | 28.9 | –4.3 | 23.2 | 30(+) | 37.4 | 49.8 | 12.8 |
Part–Time Employment | 3.6 | 4.7 | –1.1 | 7.0 | 4(+) | 12.1 | 79.4 | 8.5 |
Hours Worked | 2.1 | 6.0 | –3.9 | 6.0 | 30(+) | 11.2 | 79.7 | 9.1 |
Wages and Benefits | 47.4 | 50.6 | –3.2 | 37.3 | 30(+) | 51.5 | 44.5 | 4.1 |
Input Prices | 56.9 | 56.1 | +0.8 | 44.6 | 190(+) | 61.8 | 33.3 | 4.9 |
Selling Prices | 41.0 | 37.3 | +3.7 | 24.4 | 30(+) | 48.5 | 44.0 | 7.5 |
Capital Expenditures | 18.1 | 19.9 | –1.8 | 23.5 | 29(+) | 30.0 | 58.1 | 11.9 |
| General Business Conditions Future (six months ahead) | ||||||||
| Indicator | Oct Index | Sep Index | Change | Series Average | Trend** | % Reporting Improved | % Reporting No Change | % Reporting Worsened |
Company Outlook | –2.9 | 3.5 | –6.4 | 16.5 | 1(–) | 22.7 | 51.7 | 25.6 |
General Business Activity | –13.2 | –6.7 | –6.5 | 13.5 | 6(–) | 19.6 | 47.5 | 32.8 |
Historical data are available from January 2007 to the most current release month.
| Business Indicators Relating to Facilities and Products in Texas Retail (versus previous month) | ||||||||
| Indicator | Oct Index | Sep Index | Change | Series Average | Trend* | % Reporting Increase | % Reporting No Change | % Reporting Decrease |
| Retail Activity in Texas | ||||||||
Sales | –8.3 | –17.9 | +9.6 | 4.8 | 8(–) | 23.1 | 45.5 | 31.4 |
Employment | 3.7 | 3.0 | +0.7 | 2.0 | 4(+) | 11.9 | 79.9 | 8.2 |
Part–Time Employment | –1.9 | –0.5 | –1.4 | –1.6 | 5(–) | 5.9 | 86.3 | 7.8 |
Hours Worked | –0.9 | –7.3 | +6.4 | –1.7 | 3(–) | 8.8 | 81.5 | 9.7 |
Wages and Benefits | 14.1 | 17.5 | –3.4 | 11.0 | 27(+) | 21.9 | 70.3 | 7.8 |
Input Prices | 41.2 | 47.6 | –6.4 | 22.2 | 30(+) | 51.6 | 38.0 | 10.4 |
Selling Prices | 21.2 | 32.0 | –10.8 | 13.9 | 29(+) | 40.0 | 41.1 | 18.8 |
Capital Expenditures | 7.1 | 6.8 | +0.3 | 8.1 | 21(+) | 15.9 | 75.3 | 8.8 |
Inventories | 8.9 | 10.1 | –1.2 | 2.0 | 4(+) | 29.2 | 50.5 | 20.3 |
| Companywide Retail Activity | ||||||||
Companywide Sales | –4.1 | –6.3 | +2.2 | 6.3 | 6(–) | 24.1 | 47.8 | 28.2 |
Companywide Internet Sales | –17.5 | –3.8 | –13.7 | 5.2 | 6(–) | 4.1 | 74.3 | 21.6 |
| General Business Conditions, Retail Current (versus previous month) | ||||||||
| Indicator | Oct Index | Sep Index | Change | Series Average | Trend** | % Reporting Improved | % Reporting No Change | % Reporting Worsened |
Company Outlook | –13.9 | –13.1 | –0.8 | 3.0 | 8(–) | 9.8 | 66.5 | 23.7 |
General Business Activity | –21.4 | –20.5 | –0.9 | –0.6 | 6(–) | 7.2 | 64.2 | 28.6 |
| Outlook Uncertainty Current (versus previous month) | ||||||||
| Indicator | Oct Index | Sep Index | Change | Series Average | Trend* | % Reporting Increase | % Reporting No Change | % Reporting Decrease |
Outlook Uncertainty† | 20.6 | 8.2 | +12.4 | 10.4 | 17(+) | 35.3 | 50.0 | 14.7 |
| Business Indicators Relating to Facilities and Products in Texas, Retail Future (six months ahead) | ||||||||
| Indicator | Oct Index | Sep Index | Change | Series Average | Trend* | % Reporting Increase | % Reporting No Change | % Reporting Decrease |
| Retail Activity in Texas | ||||||||
Sales | 8.2 | 5.9 | +2.3 | 32.3 | 30(+) | 28.8 | 50.6 | 20.6 |
Employment | 6.4 | 3.1 | +3.3 | 13.2 | 30(+) | 25.3 | 55.7 | 18.9 |
Part–Time Employment | 8.4 | –1.0 | +9.4 | 1.8 | 1(+) | 16.8 | 74.8 | 8.4 |
Hours Worked | –5.4 | 6.0 | –11.4 | 3.1 | 1(–) | 8.4 | 77.8 | 13.8 |
Wages and Benefits | 37.0 | 35.0 | +2.0 | 29.2 | 30(+) | 44.2 | 48.6 | 7.2 |
Input Prices | 43.0 | 38.9 | +4.1 | 34.4 | 30(+) | 53.8 | 35.4 | 10.8 |
Selling Prices | 32.3 | 29.4 | +2.9 | 30.2 | 30(+) | 47.7 | 36.9 | 15.4 |
Capital Expenditures | 13.9 | 9.3 | +4.6 | 17.9 | 29(+) | 26.2 | 61.5 | 12.3 |
Inventories | 6.3 | 20.4 | –14.1 | 10.7 | 30(+) | 31.7 | 42.9 | 25.4 |
| Companywide Retail Activity | ||||||||
Companywide Sales | 10.2 | 11.7 | –1.5 | 30.9 | 30(+) | 30.3 | 49.6 | 20.1 |
Companywide Internet Sales | 9.1 | 2.4 | +6.7 | 22.5 | 31(+) | 22.7 | 63.6 | 13.6 |
| General Business Conditions, Retail Future (six months ahead) | ||||||||
| Indicator | Oct Index | Sep Index | Change | Series Average | Trend** | % Reporting Improved | % Reporting No Change | % Reporting Worsened |
Company Outlook | –6.3 | –9.6 | +3.3 | 16.8 | 6(–) | 18.9 | 55.9 | 25.2 |
General Business Activity | –22.0 | –19.1 | –2.9 | 12.3 | 7(–) | 12.3 | 53.4 | 34.3 |
*Shown is the number of consecutive months of expansion or contraction in the underlying indicator. Expansion is indicated by a positive index reading and denoted by a (+) in the table. Contraction is indicated by a negative index reading and denoted by a (–) in the table.
**Shown is the number of consecutive months of improvement or worsening in the underlying indicator. Improvement is indicated by a positive index reading and denoted by a (+) in the table. Worsening is indicated by a negative index reading and denoted by a (–) in the table.
†Added to survey in January 2018.
Data have been seasonally adjusted as necessary, with the exception of the outlook uncertainty index which does not yet have a sufficiently long time series to test for seasonality.
Texas Service Sector Outlook Survey
Texas Retail Outlook Survey
Texas Service Sector Outlook Survey
Comments from Survey Respondents
These comments are from respondents’ completed surveys and have been edited for publication.
- [There is a] continued delay in goods as the result of supply-chain concerns and products become delayed in arrival.
- Our perception is that we will end up in a recession, and the Fed [Federal Reserve] will not be able to prevent it.
- Inflation is rampant. Every time we buy a part, the price has jumped. Our business has slowed down.
- Continued uncertainty as a result of higher interest rates and government considering export bans to lower gasoline prices in U.S. [are concerns], which would result in the opposite. There would be less gasoline/distillate available in the global market, and this will increase prices for the U.S. imports.
- The transportation market is softening, and the international equipment issue at rail terminals is a chronic issue, causing a loss of revenue and an increase in employee hours to manage.
- Demand for Texas energy remains strong, though uncertainty over the future economic outlook remains. We project modest increases in revenue and hiring going into 2023, and with the constant pressure of increasing interest rates, we expect inflation to moderate at some point in the near term.
- [We expect] more uncertainty in the global economy including the strong dollar effects. Volatility in public markets and the rising cost of capital is impacting our ability to secure financing for growth and capital expense efficiently and affordably. As a result, we are being forced to increase prices to increase profitability and strengthen our balance sheet while also trimming costs. We are concerned that increasing prices will impact demand, but we have not seen a significant demand contraction as a result of inflation. Since we are a business-to-business company, rising interest rates is doing more to curtail our growth than either inflation or weakening demand due to rising rates.
- We provide business automation software to the oil and gas industry. Our business is growing due to a secular trend of independent oil and gas companies continuing to digitize their operations. However, we are impacted by the cyclical nature of our customers' business. Our observation is that our customers are maximizing profits in a slow growth environment.
- Interest rate increases have made budgets of prospects and current clients much tighter and increased the uncertainty of our revenues. Inflation seems to have no end in sight and is impacting expenses for services and particularly salaries. We've had to increase salaries to the point of having to reduce/wait on hiring and halting purchases from other companies.
- The labor market is tight; there is no good talent out there willing to work. Vendors are raising rates, and we are unable to pass through [costs].
- We know the cost of operating has increased and will continue to increase. This is a direct result of inflation and the additional cost burden of compliance imposed by the government. It is evident that the business outlook is headed for tough times, and the consumer will suffer economically, resulting in a downturn in businesses’ future financial stability. It is impossible to measure the economic impact of this recession, but it could be very significant for our country.
- Increases in short-term rates have not had the desired effect on inflation.
- We are in the residential mortgage industry (the economic engine that drives everything). Almost instantly, our industry flipped from low interest rates and high inventory to high interest rates and low inventory.
- We still see labor shortages and supply-chain issues. Retail sales and housing are slowing.
- Declining asset values will drive a decline in variable income.
- Commercial real estate (office, flex, retail) leasing activity and occupancy rates have remained good. Rental rates increased in the last year but have now leveled off. Delinquency rates remain at a historic low. Interest in existing commercial and retail land development projects from prospective users remains strong but is almost exclusively from national companies with strong balance sheets. Local credit users have not been forthcoming.
- A lot of our customers are anticipating an economic downturn because that's what they are seeing in the news. But we have plenty of customers investing in new opportunities even with rising costs and interest rates. [We are] not sure if that is pent-up demand or lack of caution. There is a concern that homeowners and automobile insurance rates will keep rising due to rising frequency and costs of claims. As a result, customers will be forced to choose a plan with less coverage just for affordability.
- The euphoria many enjoyed spending the extra cash they received or banked during the pandemic has worn off. Prices surged as a result, but we haven't heard most people complaining about them, just commenting. With the extra money supply now largely burned off, we see folks hoping to make more and increasingly cautious about what they buy. This would balance itself naturally except that higher interest rates are now going to force a new round of price hikes.
- [There is a] negative economic outlook due to the Fed [Federal Reserve] slamming the brakes instead of conservatively proceeding with rate increases. Homebuilding is starting to hit the wall, commodities are down, stocks are down, commercial properties are down, real wages are down—lots of gloom in the tea leaves.
- [There is] uncertainty for buyers given interest rate increases.
- Inflation and supply-chain issues impact businesses and individuals alike, and the rising costs require increasing prices. Despite claims made by national politicians, most businesses are small businesses, and owners cannot absorb the price increases without passing those along to consumers. If the cost of inputs increases beyond what a business owner can increase prices and retain customers, those businesses will respond with cost-cutting measures (decrease personnel, change production methods, approve lower-cost and perhaps lower-quality inputs) or by closing the business to avoid exhausting personal capital in a losing proposition.
- [There is] increased uncertainty for businesses as a tight labor market persists for experienced personnel in the professional service sector.
- Increasing interest rates and inflation continue to slow capital investment from our clients. [We] expect this to get worse before it gets better.
- Elections are the major uncertainty issue.
- We are expecting a mild recession in 2023, with our revenue holding at 2022’s level throughout 2023.
- Interest rate increases are slowing our construction sales.
- Our revenue is tied to high-skill employment in North America and to a lesser degree in Europe. The actions of all the reserve banks in the world seem to now be trying to increase unemployment, which will probably have a negative impact on our revenue over the next 18 months.
- The information technology services sector still does not have enough available workers. We see no change in this soon.
- The current trend of "quiet quitting" has significantly impacted our ability to deliver quality services at established budgets and, therefore, has impacted overall profitability.
- Inflation is hitting hard. Our vendors have raised their prices, and wages continue to rise due to expanding regulations and health care costs. Minimum wage requirements are pushing up labor costs for unskilled workers who are not more skilled, just more expensive. Our customers and prospective clients are hesitant to spend money with a recession believed to be on the horizon.
- I believe the Fed [Federal Reserve] overreacted raising interest rates so quickly. I believe these changes have accelerated the downturn in home construction and sales and the reduction in consumer confidence. I believe we will be in a recession in the next six months that will last all of 2023.
- We are seeing a decrease in new commercial real estate starts—even in multifamily and industrial.
- We work in the public sector in heavy civil construction. We finally had two contracts come through that we've been waiting on for over a month. More projects are being bid on weekly. [There are] lots of opportunities out there in this area.
- Prices for everything have increased. [I am] hoping that prices will stabilize and start to go down. I am watching how I spend company resources.
- [We are] waiting to see what changes are coming with the elections next month.
- It feels like the industry is slowing down—too many variables: inflation, near-shoring, etc.
- Running a business-to-business marketing firm, we have a pretty good sense of what is going on with businesses in Texas. For the most part, companies are pushing forward while also being very cautious of any unnecessary expenditures—classic recession-era behavior.
- With the uncertainty of future Fed [Federal Reserve] rate increases and the difficulty of how to price assets, the residential and commercial real estate markets are slowing considerably. Orders are slowing at a faster pace than we anticipated, and revenue has finally started to pull back as well. We hope we hit bottom soon so we can figure out exactly where we are and start the recovery process.
- Customer needs are still being constrained by supply change, forcing changes to our contracts.
- Many unknowns [exist] regarding the impact of inflation, increased cost of borrowing, continuing staffing shortages (difficulty in recruiting/retaining staff), supply-chain issues being experienced by clients, the rising cost of transportation fuel and geopolitical risks.
- Inflation continues to be the wildcard in all our planning.
- I have seen my business increase slightly over the last month. Our forecast is looking like we will be able to increase our revenues over the next six months.
- We have opened a new aftermarket division, which is driving expansion.
- The corporate aviation sector seems to be ticking up with inspection requests. This is a standard change toward the end of the year for our corporate customers. The oil sector has improved from last quarter, with many existing large customers ordering more replacement parts for existing oil retrieval and storage facilities. Commercial aviation has remained consistent quarter to quarter. Our machine shop customers are increasing request for quotes, but they are not due for completion until first quarter 2023. We are being told they are delaying the start of the projects until after the mid-term elections. Two main issues are affecting our operations: skilled labor that wants to work and electronic instruments for the inspections. We are now looking at November 2022 before the delivery of our new machines is completed. The "chip" issue is becoming a major issue now to continuing operations.
- Inflationary pressures still overhang the economy.
- Another COVID wave appears to be a threat. Rising interest rates have increased our costs, but it’s difficult to forecast when inflation will moderate, leading to greater uncertainty.
- Pundits and sages are all deep on the debate; emotions everywhere and even some hate; all have lost patience and intolerant of wait.
- [There is] much less business development activity. Potential customers slowed their efforts even for cost-cutting programs. We have heard other employers have stopped all hires until the end of the year.
- Lots of issues to confront: inflation, lack of available staff, the impending recession, etc. It’s not easy to navigate all the variables. Looking forward, we are cautious in our approach, being mindful we may need to move quickly should circumstances dictate. Our view is that any significant change in direction will not be necessary until third quarter of next year.
- Supply lines and employment difficulties continue to put a drag on operations management. Although rising interest rates continue, it's not been felt yet, however. I am hearing from customers that their companies have revised 2023 capital spending down and shelved some projects.
- [I] feel that workers will never return to the office full time. Companies are downsizing their offices. If the price is right and the offices are Class A, other companies will fill in the vacant spaces. If prices don't come down for office space, it won't fill. If the offices don't have amenities for a good price, they won't fill. This transition will take several years. For our sector to fully recover, we need this transition to take place.
- [We are] still unable to fill many positions and are having to continue to increase pay for others. [We’re] unable to be open seven days because of a shortage of employees. Payroll costs continue to increase, with employees able to walk down the street for a bit more. [There are] increases in cost of goods, as well as operating expenses not even slowing. [We are] having to change what we offer as a result. It’s difficult to increase prices. Return to office is not materializing in a significant way, and business travel remains very weak. This directly impacts sales negatively. The outlook for inflation and recession looks very real from where we stand.
- Labor continues to be a major challenge for our industry segment. We continue to struggle to staff new locations, even with offering substantial signing bonuses, and we see major upward pressure on mid-level management compensation driven by increasing pay at entry levels. While CEO peers in industries other than food and beverage are reporting hiring and retention patterns consistent with prepandemic conditions, those in food and beverage businesses are reporting the opposite. It seems that this segment will be the last to return to 2019 market dynamics.
- Food inflation and increased rates are impacting consumers. We are seeing trade down in menu items.
- [We are] starting to see layoffs here and there due to weakening demand in consumer and business goods areas.
- Net revenues will go up but not at the same pace as input prices, so margins are way down. It's hard to pass along full prices to the customer, so we are trying just to break even. We expect it will worsen in six months, and we will have to adjust employee packages in January.
- There doesn’t appear to be a supply-chain resolution. In fact, while 2009 caused a change from inventorying stock items to just in time, we have now changed from just in time to no supply, which leads to cost control of finished goods and constant supply issues. This along with labor issues seem to be driving pricing and supply.
- Supply-chain issues persist with no end in sight. Higher interest rates and higher gas prices are negatively impacting our business.
- Higher interest rates are affecting used car sales and valuations.
- Parts inventory is a real problem; it may take months to get certain parts.
- The ongoing chip shortage results in significant variation from month to month in inventory levels and, consequently, total sales revenue.
- I’m surprised how fast our business has slowed down. It’s hard to pinpoint any one issue when talking with customers, but it seems to be several concerns and not just one issue. Negativity breeds fast, and this is not good going forward. So much for the soft landing as we’re just trying to stay on the runway!
- The economy is slowing down at a higher pace than I have ever seen.
- As a pharmacy, we're seeing smaller margins as prices are increasing on medications but reimbursements are not.
- An oligopoly exists in health care pharmacy benefits managers, which continues to be abused. This restricts competition, which provides fewer choices for consumers and less regulation on prices. The cost of medications has increased for both consumers and independent pharmacies, conflated with lower reimbursements, which have had a disastrous effect on staffing, benefits and quality of care.
- The consumer is experiencing unprecedented inflation for housing, food and gas. This has impacted our third quarter and will [continue to] moving into the new year.
- We badly need to hire truck drivers, but the federal and state governments continue to make it harder for these guys to get commercial driver licenses, which is remarkable, since we have a nationwide truck driver shortage. For years, they have had to wait up to several months to take their written tests, then driving tests. In addition, they have to wait weeks for results of background checks.
- I started seeing the shift in customer spending and traffic flow into our retail store the second and third weeks of September, and it has continued through October. All the news outlets are promoting “Start your holiday shopping now” and “Take advantage of Amazon/Target/big box deals.” It makes it hard for small businesses to compete with big-chain company promotions. We are all sitting at an uncertainty level that hasn't been the case in the last eight to 10 months. The problem is those goods are already in the pipeline and harder to slow down or cancel before they arrive to us.
Historical Data
Historical data can be downloaded dating back to January 2007.
Indexes
Download indexes for all indicators. For the definitions of all variables, see Data Definitions.
Texas Service Sector Outlook Survey |
Texas Retail Outlook Survey |
| Unadjusted | Unadjusted |
| Seasonally adjusted | Seasonally adjusted |
All Data
Download indexes and components of the indexes (percentage of respondents reporting increase, decrease, or no change). For the definitions of all variables, see Data Definitions.
Texas Service Sector Outlook Survey |
Texas Retail Outlook Survey |
| Unadjusted | Unadjusted |
| Seasonally adjusted | Seasonally adjusted |
Questions regarding the Texas Service Sector Outlook Survey can be addressed to Christopher Slijk at christopher.slijk@dal.frb.org.
Sign up for our email alert to be automatically notified as soon as the latest Texas Service Sector Outlook Survey is released on the web.