
Texas Service Sector Outlook Survey
Modest expansion continues in Texas service sector
For this month’s survey, Texas business executives were asked supplemental questions on labor market and credit conditions. Results for these questions from the Texas Manufacturing Outlook Survey, Texas Service Sector Outlook Survey and Texas Retail Outlook Survey have been released together. Read the special questions results.
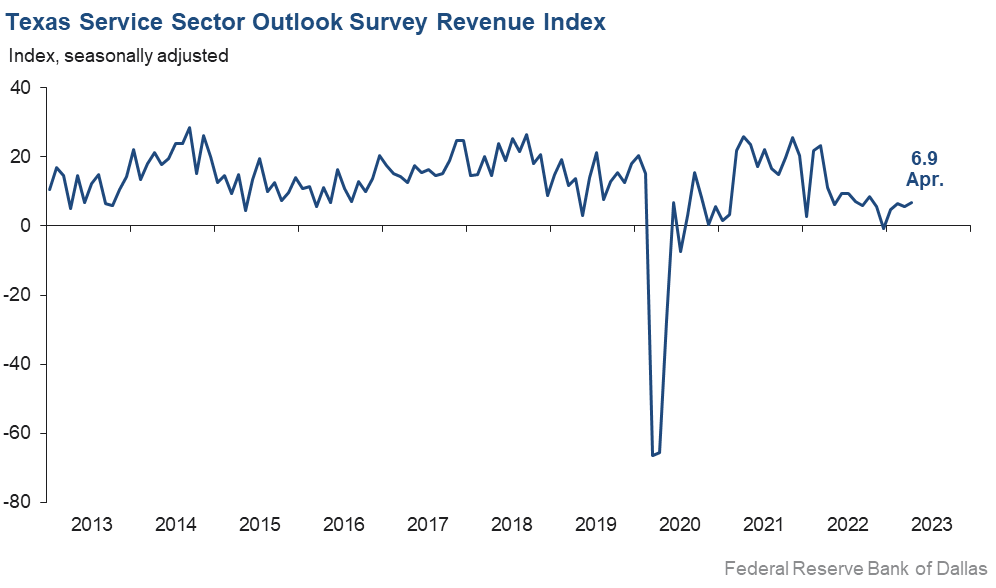
Growth in Texas service sector activity continued in April, according to business executives responding to the Texas Service Sector Outlook Survey. The revenue index, a key measure of state service sector conditions, edged up just over one point to 6.9, suggesting a slight pickup in activity growth.
Labor market indicators pointed to an increase in employment, a contraction in part-time employment and flat workweeks. The employment index grew six points to 5.5, indicating a modest pickup in employment growth in April. However, the part-time employment index fell five points to -3.7. The hours worked index moved up from -1.8 to -0.3.
Perceptions of broader business conditions continued to worsen in April, though pessimism waned slightly. The general business activity index remained negative but rose four points to -14.4. The company outlook index also improved, from -11.3 to -9.4, while the outlook uncertainty index fell seven points to 16.1—closer to its series average of 13.5.
Input price and wage pressures eased somewhat, while selling price pressures increased. The input prices index ticked down from 38.3 to 35.5, and the selling prices index rose five points to 16.1. The wages and benefits index inched down one point to 18.4—still elevated relative to its average reading of 15.7.
Respondents’ expectations regarding future business activity were mixed in April. The future general business activity index remained negative but largely unchanged at -13.0. The future revenue index stayed positive but fell eight points to 26.0. Other future service sector activity indexes such as employment and capital expenditures improved and remained in positive territory, reflecting expectations for continued growth in the next six months.

Texas Retail Outlook Survey
Texas retail sales increase slightly in April
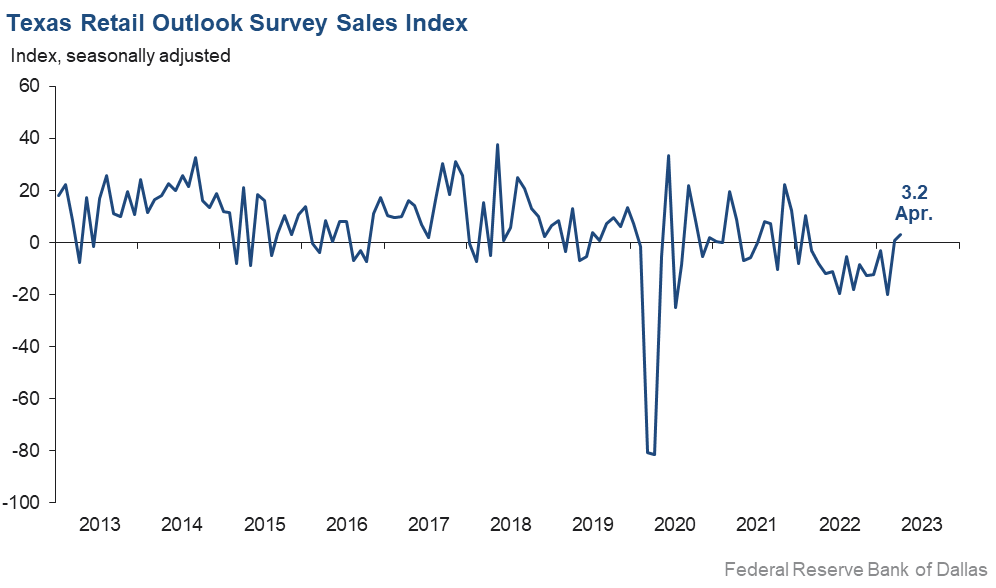
April retail sales activity grew after being stagnant in March, according to business executives responding to the Texas Retail Outlook Survey. The sales index, a key measure of state retail activity, ticked up two points to 3.2, suggesting sales increased in April. Retailers’ inventories increased at a slower rate than last month, with the index falling from 4.9 to 2.8.
Retail labor market indicators reflected modest growth in employment but continued shortening of workweeks in April. The employment index increased eight points to 1.6. The part-time employment index was flat at -0.5. The hours worked index remained in negative territory but rose four points to -7.0.
Retailers’ perceptions of broader business conditions continued to worsen in April as the general business activity and company outlook indexes remained in deeply negative territory. Both indexes remained flat at -27.1 and -16.1, respectively. The outlook uncertainty index dropped 14 points to 11.8.
Price pressures increased, while wage pressures eased in April. The selling prices index increased 11 points to 17.3, and the input prices index rose eight points to 37.7. The wages and benefits index dropped 10 points to 9.3.
Expectations for future retail growth were mixed in April. The future general business activity index fell four points to -20.8, while the future sales index was mostly unchanged at 15.7. Other indexes of future retail activity such as employment and capital expenditures remained positive, reflecting expectations for continued growth in retail activity later in the year.
The Texas Retail Outlook Survey is a component of the Texas Service Sector Outlook Survey that uses information only from respondents in the retail and wholesale sectors.
Next release: May 31, 2023
Data were collected April 11–19, and 298 Texas service sector business executives, of which 60 were retailers, responded to the survey. The Dallas Fed conducts the Texas Service Sector Outlook Survey monthly to obtain a timely assessment of the state’s service sector activity. Firms are asked whether revenue, employment, prices, general business activity and other indicators increased, decreased or remained unchanged over the previous month.
Survey responses are used to calculate an index for each indicator. Each index is calculated by subtracting the percentage of respondents reporting a decrease from the percentage reporting an increase. When the share of firms reporting an increase exceeds the share reporting a decrease, the index will be greater than zero, suggesting the indicator has increased over the prior month. If the share of firms reporting a decrease exceeds the share reporting an increase, the index will be below zero, suggesting the indicator has decreased over the prior month. An index will be zero when the number of firms reporting an increase is equal to the number of firms reporting a decrease. Data have been seasonally adjusted as necessary.
Texas Service Sector Outlook Survey
Historical data are available from January 2007 to the most current release month.
| Business Indicators Relating to Facilities and Products in Texas Current (versus previous month) | ||||||||
| Indicator | Apr Index | Mar Index | Change | Series Average | Trend* | % Reporting Increase | % Reporting No Change | % Reporting Decrease |
Revenue | 6.9 | 5.5 | +1.4 | 11.0 | 4(+) | 27.9 | 51.1 | 21.0 |
Employment | 5.5 | –0.4 | +5.9 | 6.5 | 1(+) | 18.0 | 69.5 | 12.5 |
Part–Time Employment | –3.7 | 1.4 | –5.1 | 1.5 | 1(–) | 4.5 | 87.3 | 8.2 |
Hours Worked | –0.3 | –1.8 | +1.5 | 2.8 | 2(–) | 8.8 | 82.1 | 9.1 |
Wages and Benefits | 18.4 | 19.8 | –1.4 | 15.7 | 35(+) | 21.7 | 75.0 | 3.3 |
Input Prices | 35.5 | 38.3 | –2.8 | 27.6 | 36(+) | 40.1 | 55.3 | 4.6 |
Selling Prices | 16.1 | 11.4 | +4.7 | 7.5 | 33(+) | 24.4 | 67.3 | 8.3 |
Capital Expenditures | 10.3 | 7.4 | +2.9 | 10.1 | 33(+) | 19.8 | 70.7 | 9.5 |
| General Business Conditions Current (versus previous month) | ||||||||
| Indicator | Apr Index | Mar Index | Change | Series Average | Trend** | % Reporting Improved | % Reporting No Change | % Reporting Worsened |
Company Outlook | –9.4 | –11.3 | +1.9 | 4.8 | 11(–) | 12.7 | 65.2 | 22.1 |
General Business Activity | –14.4 | –18.0 | +3.6 | 3.1 | 11(–) | 11.9 | 61.8 | 26.3 |
| Indicator | Apr Index | Mar Index | Change | Series Average | Trend* | % Reporting Increase | % Reporting No Change | % Reporting Decrease |
Outlook Uncertainty | 16.1 | 22.8 | –6.7 | 13.5 | null | 26.9 | 62.4 | 10.8 |
| Business Indicators Relating to Facilities and Products in Texas Future (six months ahead) | ||||||||
| Indicator | Apr Index | Mar Index | Change | Series Average | Trend* | % Reporting Increase | % Reporting No Change | % Reporting Decrease |
Revenue | 26.0 | 34.4 | –8.4 | 37.7 | 36(+) | 43.4 | 39.3 | 17.4 |
Employment | 22.1 | 21.5 | +0.6 | 23.2 | 36(+) | 33.7 | 54.7 | 11.6 |
Part–Time Employment | –0.2 | 2.4 | –2.6 | 6.8 | 1(–) | 8.8 | 82.2 | 9.0 |
Hours Worked | 1.1 | 1.6 | –0.5 | 5.9 | 36(+) | 9.6 | 81.9 | 8.5 |
Wages and Benefits | 42.9 | 36.9 | +6.0 | 37.4 | 36(+) | 46.1 | 50.8 | 3.2 |
Input Prices | 47.7 | 42.1 | +5.6 | 44.7 | 196(+) | 51.0 | 45.7 | 3.3 |
Selling Prices | 27.6 | 24.4 | +3.2 | 24.6 | 36(+) | 36.9 | 53.8 | 9.3 |
Capital Expenditures | 16.0 | 13.1 | +2.9 | 23.4 | 35(+) | 25.0 | 66.1 | 9.0 |
| General Business Conditions Future (six months ahead) | ||||||||
| Indicator | Apr Index | Mar Index | Change | Series Average | Trend** | % Reporting Improved | % Reporting No Change | % Reporting Worsened |
Company Outlook | –3.8 | –5.3 | +1.5 | 16.0 | 2(–) | 18.4 | 59.4 | 22.2 |
General Business Activity | –13.0 | –12.2 | –0.8 | 12.8 | 12(–) | 14.6 | 57.8 | 27.6 |
Historical data are available from January 2007 to the most current release month.
| Business Indicators Relating to Facilities and Products in Texas Retail (versus previous month) | ||||||||
| Indicator | Apr Index | Mar Index | Change | Series Average | Trend* | % Reporting Increase | % Reporting No Change | % Reporting Decrease |
| Retail Activity in Texas | ||||||||
Sales | 3.2 | 0.8 | +2.4 | 4.4 | 2(+) | 27.6 | 48.1 | 24.4 |
Employment | 1.6 | –6.8 | +8.4 | 1.9 | 1(+) | 9.8 | 82.0 | 8.2 |
Part–Time Employment | –0.5 | –0.4 | –0.1 | –1.6 | 2(–) | 5.5 | 88.5 | 6.0 |
Hours Worked | –7.0 | –10.9 | +3.9 | –1.9 | 5(–) | 6.3 | 80.4 | 13.3 |
Wages and Benefits | 9.3 | 19.7 | –10.4 | 11.1 | 33(+) | 15.4 | 78.5 | 6.1 |
Input Prices | 37.7 | 30.0 | +7.7 | 22.6 | 36(+) | 45.7 | 46.2 | 8.0 |
Selling Prices | 17.3 | 6.8 | +10.5 | 13.9 | 35(+) | 34.7 | 47.9 | 17.4 |
Capital Expenditures | 4.4 | 5.9 | –1.5 | 8.0 | 27(+) | 18.3 | 67.8 | 13.9 |
Inventories | 2.8 | 4.9 | –2.1 | 2.3 | 11(+) | 26.5 | 49.7 | 23.7 |
| Companywide Retail Activity | ||||||||
Companywide Sales | –0.9 | –8.2 | +7.3 | 5.8 | 14(–) | 25.2 | 48.8 | 26.1 |
Companywide Internet Sales | –4.6 | –9.9 | +5.3 | 4.7 | 7(–) | 15.7 | 64.0 | 20.3 |
| General Business Conditions, Retail Current (versus previous month) | ||||||||
| Indicator | Apr Index | Mar Index | Change | Series Average | Trend** | % Reporting Improved | % Reporting No Change | % Reporting Worsened |
Company Outlook | –16.1 | –15.7 | –0.4 | 2.5 | 14(–) | 11.2 | 61.5 | 27.3 |
General Business Activity | –27.1 | –26.9 | –0.2 | –1.4 | 12(–) | 3.0 | 66.9 | 30.1 |
| Outlook Uncertainty Current (versus previous month) | ||||||||
| Indicator | Apr Index | Mar Index | Change | Series Average | Trend* | % Reporting Increase | % Reporting No Change | % Reporting Decrease |
Outlook Uncertainty | 11.8 | 25.4 | –13.6 | 11.0 | null | 23.7 | 64.4 | 11.9 |
| Business Indicators Relating to Facilities and Products in Texas, Retail Future (six months ahead) | ||||||||
| Indicator | Apr Index | Mar Index | Change | Series Average | Trend* | % Reporting Increase | % Reporting No Change | % Reporting Decrease |
| Retail Activity in Texas | ||||||||
Sales | 15.7 | 16.7 | –1.0 | 31.6 | 10(+) | 39.4 | 37.0 | 23.7 |
Employment | 15.7 | 10.8 | +4.9 | 13.0 | 36(+) | 29.0 | 57.7 | 13.3 |
Part–Time Employment | –4.9 | –1.5 | –3.4 | 1.6 | 5(–) | 7.5 | 80.1 | 12.4 |
Hours Worked | –3.3 | –11.9 | +8.6 | 2.7 | 7(–) | 9.4 | 77.9 | 12.7 |
Wages and Benefits | 39.8 | 25.3 | +14.5 | 29.2 | 36(+) | 42.5 | 54.8 | 2.7 |
Input Prices | 43.4 | 20.0 | +23.4 | 34.4 | 36(+) | 49.1 | 45.3 | 5.7 |
Selling Prices | 22.6 | 5.1 | +17.5 | 29.9 | 36(+) | 39.6 | 43.4 | 17.0 |
Capital Expenditures | 3.7 | 1.6 | +2.1 | 17.6 | 35(+) | 18.5 | 66.7 | 14.8 |
Inventories | 22.3 | 17.8 | +4.5 | 10.8 | 36(+) | 39.0 | 44.3 | 16.7 |
| Companywide Retail Activity | ||||||||
Companywide Sales | 12.2 | 11.9 | +0.3 | 30.1 | 3(+) | 37.8 | 36.6 | 25.6 |
Companywide Internet Sales | 4.6 | 4.2 | +0.4 | 22.0 | 5(+) | 18.6 | 67.4 | 14.0 |
| General Business Conditions, Retail Future (six months ahead) | ||||||||
| Indicator | Apr Index | Mar Index | Change | Series Average | Trend** | % Reporting Improved | % Reporting No Change | % Reporting Worsened |
Company Outlook | –11.5 | –9.0 | –2.5 | 15.8 | 12(–) | 13.9 | 60.7 | 25.4 |
General Business Activity | –20.8 | –17.1 | –3.7 | 11.3 | 13(–) | 11.6 | 56.0 | 32.4 |
*Shown is the number of consecutive months of expansion or contraction in the underlying indicator. Expansion is indicated by a positive index reading and denoted by a (+) in the table. Contraction is indicated by a negative index reading and denoted by a (–) in the table.
**Shown is the number of consecutive months of improvement or worsening in the underlying indicator. Improvement is indicated by a positive index reading and denoted by a (+) in the table. Worsening is indicated by a negative index reading and denoted by a (–) in the table.
Data have been seasonally adjusted as necessary.
Texas Service Sector Outlook Survey
Texas Retail Outlook Survey
Texas Service Sector Outlook Survey
Comments from survey respondents
These comments are from respondents’ completed surveys and have been edited for publication.
- The bank failures have slowed capital commitments and services. As a financial services company, we are impacted by economic and investment market changes. Our second-quarter revenue spike is due to a stronger investment market. Overall, we are cautiously optimistic over the next six months. We have a senior employee who is retiring, and we are not replacing the position due to improved workflow efficiency.
- We see improvements in supply chains and labor availability.
- We are seeing a decrease in transactions. Clients relate that there is uncertainty as to cap rates, and buyers and sellers are not on the same page. Reports of significant deposits being transferred out of smaller banks to the largest banks are being interpreted as the Silicon Valley Bank/Signature Bank episodes lend to uncertainty.
- A shortage of qualified professionals in the architecture field continues. No qualified applicants have responded to job postings for the past three months. [There are] not enough qualified professionals to meet the workload increase, and we are having to turn down projects.
- The market is playing a major role in our analysis while making decisions. We expect the information technology industry and the overall market to get better.
- Federal reserve actions to drive up interest rates make it more expensive to raise capital or borrow money for our business.
- We have had a strange uptick in successful deal closures. This, though, was largely due to competitive pricing.
- The looming potential of a full-blown recession, coupled with a continuing increase in prices has caused many business owners to hold off making any major changes in their business.
- Our business insurance increased considerably this year.
- We had a better month, but it's hard to account for it. We remain concerned as rising interest rates continue to result in projects dying early in due diligence.
- We continue to build our new brand after the recent leadership buyout. However, there is some uncertainty due to the economy and trying to launch a new brand. Nonprofits, which are our primary audience, tend to ebb with economic downturns a little slower both in feeling the initial impact and on the upturn in recovery. We are readying our small business for that.
- We are concerned about the commercial real estate industry and an increase in defaults.
- We are looking for greater certainty from the Fed [Federal Reserve] on its approach to raising or stabilizing the fed funds rate. [It will be] interesting to see whether the Fed will weigh continuing growth of the economy over continuing pressure to abate inflation quickly.
- We are cautiously optimistic about the third and fourth quarters. If interest rates continue to rise, funding lines for new projects may not be available at rates that make contracts profitable over the long term.
- The residential market has continued to improve this year, but the commercial market continues to decline due to regional banks pulling back. We are not anticipating a recovery soon due to the banking issues, but time will tell.
- Currently, it is a tough market; [there are] way more agents than product available to sell. The decreased availability of equity and debt capital for commercial real estate are anticipated to hit hard in the second half of the year.
- A number of apartment owners are being squeezed hard right now and are getting further and further behind. Debt service (for those with floating rates and insufficient rate caps), insurance and property taxes are killing them. Some aren't going to make it.
- Lack of development, due to construction costs and interest rates mostly, and steady tenant demand are absorbing vacancy with not a ton of development online to fill the future needs. It’s a great time to be a landlord, but an awful time to be a real estate broker.
- Clients are becoming more stressed about finances. Homeowners are spending less money, and clients' revenues are down, which trickles down to us. I still have to maintain a certain staffing model to perform services with decreased revenue and the high cost of credit; I am unable to pay myself wages at this time.
- We see a lengthy stalemate in the economy and an extended sideways movement with lower spending for some time in the future as businesses wait to spend and consumers are growing their debt.
- Our outlook is improving because of proposals likely to pass in the state budget, a significant revenue factor for us. However, we still see increasing labor costs and recession concerns that mitigate our optimism.
- Inflation remains a significant problem. The labor market remains tight, with limited qualified candidates available. Wages and wage expectations are elevated and relatively high compared with revenue.
- Our demand continues to soften given macroeconomic uncertainty.
- We are still understaffed and are having a difficult time finding qualified applicants.
- The economy is starting to stall due to interest rates being higher.
- The multiple train derailments combined with the International Longshore and Warehouse Union California port work strikes and slowdowns have us at a standstill. We have had more zero-revenue days this month than the past eight years.
- Demand and output are currently steady.
- Our opportunity pipeline remains strong, but time to close and ability to convert new business is very weak compared with this time last year. It's simply taking longer for buying decisions to be made.
- Primary issues are the continued Fed [Federal Reserve] policy tightening and challenges associated such as increased borrowing costs and increased liquidity costs.
- Uncertainty and increasingly unfavorable lending terms in the banking sector have resulted in increased interest in sourcing long-term real estate debt capital from life insurance companies that we work with, and we expect this situation to continue for much of the rest of the year.
- The biggest cause for concern now is the geopolitical environment and the continued expansion of regulatory requirements and the anticipation of more layers of regulatory burdens that will evolve from the recent bank failures.
- Increasingly high interest rates have placed pressure on our ability to invest in hiring and growth. Our objective is to now maintain revenue levels, reduce cost, primarily through head count reductions, and increase free cash flow. Private capital markets and private and conventional debt markets remain tight and slow, making it difficult to invest in our company's future. We have released nearly 150 people from January to March 2023 to reduce expenses, which hampers our ability to grow and operate efficiently.
- Given volatility in the credit markets, we have suspended future growth plans for a few months in a wait-and-see stance. Negotiations on pending leases for expansion were terminated. Generally, we expect a recession in the fourth quarter and into 2024 and a rebound in third quarter 2024.
- Our revenue is 20 percent down.
- We are beginning to feel economic slowdown and some slowdown in spending by customers.
- Cost pressures seem to have moved through to consumers, and things are slowing down.
- Input costs for freight have fallen, but we're not seeing much relief on trucking costs. Indirectly, I'm aware that there is more available capacity in the market, but it hasn't pushed trucking companies to price more aggressively. It's my experience and belief that once trucking prices start to fall, companies tend to get into a bidding war for a "race to the bottom." Fuel doesn't seem to be part of the conversation right now, so if fuel stays relatively stable, freight companies might feel more inclined to be more aggressive with their pricing.
- Revenues are dropping as a result of input prices declining. Units sold have declined due to a drop in demand due to historical high prices. However, we think that consumers will return with this drop in selling prices.
- Even though new-vehicle availability is improving, margins are declining, resulting in a decrease in selling prices.
- Higher interest rates are starting to affect profitability due to increased costs to finance new-vehicle inventories.
- The business environment has become challenging. Customers’ confidence is low and the desire to spend even lower. Businesses in the area are struggling to cover their overhead.
- Continuing to expand and compete in the health care industry requires venturing into specialty spaces and partnering with smaller pharmacy benefit managers. Competition is necessary for control of prices and increased access to health care. The industry requires more regulation and higher emphasis on antitrust violations.
- A labor shortage is making things hard on our business.
Historical Data
Historical data can be downloaded dating back to January 2007.
Indexes
Download indexes for all indicators. For the definitions of all variables, see data definitions.
Texas Service Sector Outlook Survey |
Texas Retail Outlook Survey |
| Unadjusted | Unadjusted |
| Seasonally adjusted | Seasonally adjusted |
All Data
Download indexes and components of the indexes (percentage of respondents reporting increase, decrease, or no change). For the definitions of all variables, see data definitions.
Texas Service Sector Outlook Survey |
Texas Retail Outlook Survey |
| Unadjusted | Unadjusted |
| Seasonally adjusted | Seasonally adjusted |
Questions regarding the Texas Service Sector Outlook Survey can be addressed to Jesus Cañas at jesus.canas@dal.frb.org.
Sign up for our email alert to be automatically notified as soon as the latest Texas Service Sector Outlook Survey is released on the web.