
Texas Service Sector Outlook Survey
Texas service sector growth holds steady in May; price and wage pressures ease
For this month’s survey, Texas business executives were asked supplemental questions on wages, prices and costs. Results for these questions from the Texas Manufacturing Outlook Survey, Texas Service Sector Outlook Survey and Texas Retail Outlook Survey have been released together. Read the special questions results.
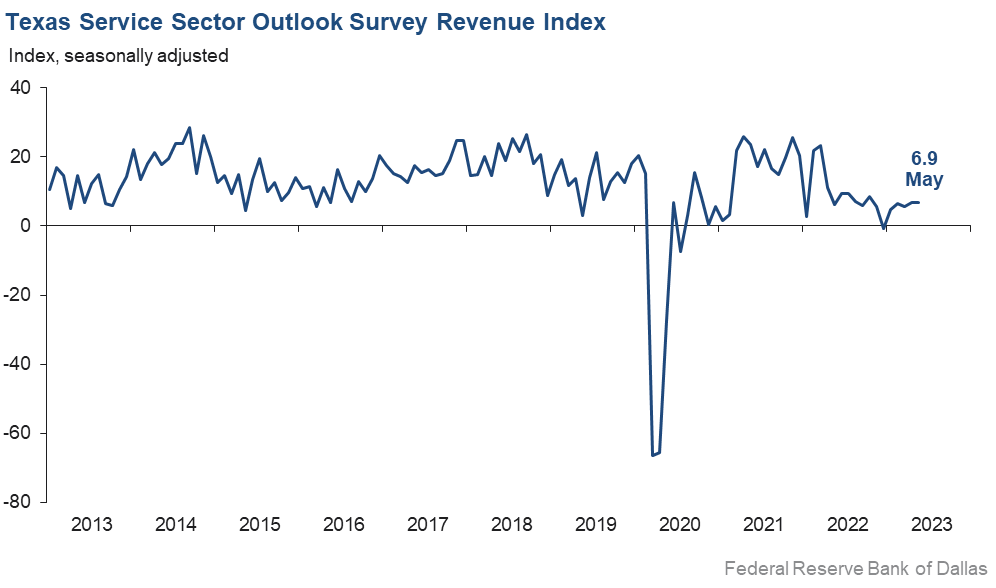
Growth in Texas service sector activity continued in May, according to business executives responding to the Texas Service Sector Outlook Survey. The revenue index, a key measure of state service sector conditions, was unchanged at 6.9, suggesting activity grew at the same rate as the previous month.
Labor market indicators pointed to continued employment growth and a slight decline in part-time employment and workweeks. The employment index edged down one point to 4.2, indicating a slight moderation in employment growth in May. The part-time employment index rose three points to -1.0, while the hours worked index fell from -0.3 to -1.4.
Perceptions of broader business conditions continued to worsen in May. The general business activity index remained negative and fell three points to -17.3. The company outlook index remained the same at -9.5, while the outlook uncertainty index was flat at 15.8—close to its series average of 13.6.
Price and wage pressures eased in May. The input prices index ticked down from 35.5 to 31.8, and the selling prices index fell two points to 13.8, though both indexes remained above their series averages. The wages and benefits index inched down two points to 16.6—near its average reading of 15.7.
Respondents’ expectations regarding future business activity were mixed in May. The future general business activity index remained negative but largely unchanged at -13.2. The future revenue index stayed positive and increased three points to 28.5. Other future service sector activity indexes such as employment and capital expenditures remained in positive territory, reflecting expectations for continued growth in the next six months.

Texas Retail Outlook Survey
Texas retail sales deteriorate in May
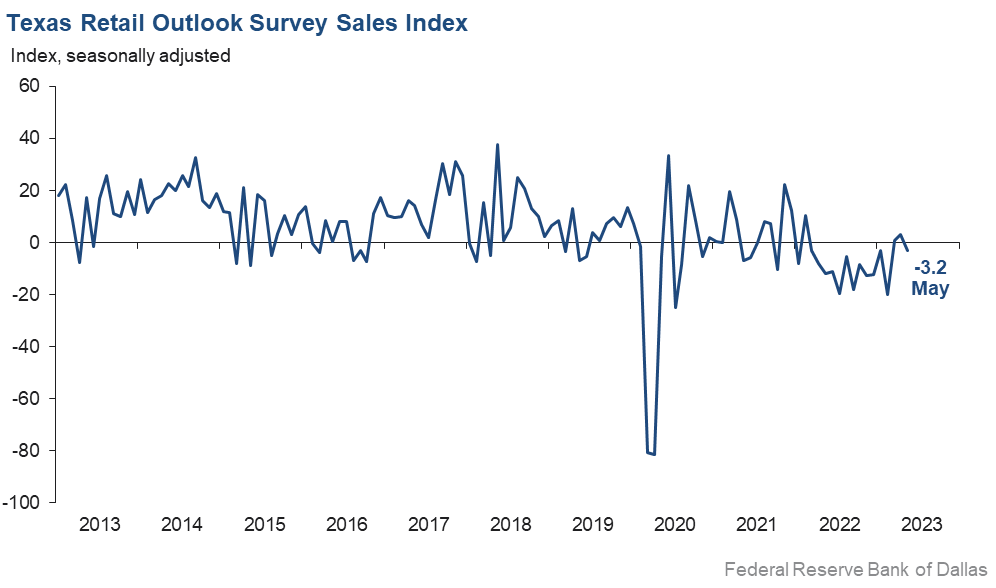
Retail sales declined in May, according to business executives responding to the Texas Retail Outlook Survey. The sales index, a key measure of state retail activity, fell six points to -3.2. Retailers’ inventories increased at a faster rate than last month, with the index jumping from 2.8 to 17.0.
Retail labor market indicators reflected a contraction in employment and continued shortening of workweeks in May. The employment index fell five points to -3.3 while the part-time employment index dropped 10 points to -9.3. The hours worked index remained in negative territory but rose five points to -2.2.
Retailers’ perceptions of broader business conditions continued to worsen in May, though pessimism waned. The general business activity index remained negative but rose five points to -22.3. The company outlook index increased from -16.1 to -9.2, and the outlook uncertainty index ticked up from 11.8 to 12.9.
Price pressures eased, but wage pressures increased considerably in May. The selling prices index fell nine points to 8.7, and the input prices index dropped 13 points to 24.6. However, the wages and benefits index jumped 12 points to 21.6.
Expectations for future retail growth worsened in May. The future general business activity index fell five points to -25.6, and the future sales index dropped 19 points to -3.6. Other indexes of future retail activity such as employment and capital expenditures also fell but remained in positive territory, reflecting expectations for slower growth in retail activity later in the year.
The Texas Retail Outlook Survey is a component of the Texas Service Sector Outlook Survey that uses information only from respondents in the retail and wholesale sectors.
Next release: June 27, 2023
Data were collected May 16–24, and 306 Texas service sector business executives, of which 64 were retailers, responded to the survey. The Dallas Fed conducts the Texas Service Sector Outlook Survey monthly to obtain a timely assessment of the state’s service sector activity. Firms are asked whether revenue, employment, prices, general business activity and other indicators increased, decreased or remained unchanged over the previous month.
Survey responses are used to calculate an index for each indicator. Each index is calculated by subtracting the percentage of respondents reporting a decrease from the percentage reporting an increase. When the share of firms reporting an increase exceeds the share reporting a decrease, the index will be greater than zero, suggesting the indicator has increased over the prior month. If the share of firms reporting a decrease exceeds the share reporting an increase, the index will be below zero, suggesting the indicator has decreased over the prior month. An index will be zero when the number of firms reporting an increase is equal to the number of firms reporting a decrease. Data have been seasonally adjusted as necessary.
Texas Service Sector Outlook Survey
Historical data are available from January 2007 to the most current release month.
| Business Indicators Relating to Facilities and Products in Texas Current (versus previous month) | ||||||||
| Indicator | May Index | Apr Index | Change | Series Average | Trend* | % Reporting Increase | % Reporting No Change | % Reporting Decrease |
Revenue | 6.9 | 6.9 | 0.0 | 11.0 | 5(+) | 27.0 | 52.9 | 20.1 |
Employment | 4.2 | 5.5 | –1.3 | 6.5 | 2(+) | 14.7 | 74.8 | 10.5 |
Part–Time Employment | –1.0 | –3.7 | +2.7 | 1.5 | 2(–) | 4.8 | 89.4 | 5.8 |
Hours Worked | –1.4 | –0.3 | –1.1 | 2.8 | 3(–) | 5.6 | 87.4 | 7.0 |
Wages and Benefits | 16.6 | 18.4 | –1.8 | 15.7 | 36(+) | 20.8 | 75.0 | 4.2 |
Input Prices | 31.8 | 35.5 | –3.7 | 27.7 | 37(+) | 36.2 | 59.4 | 4.4 |
Selling Prices | 13.8 | 16.1 | –2.3 | 7.6 | 34(+) | 21.6 | 70.6 | 7.8 |
Capital Expenditures | 11.5 | 10.3 | +1.2 | 10.1 | 34(+) | 20.4 | 70.7 | 8.9 |
| General Business Conditions Current (versus previous month) | ||||||||
| Indicator | May Index | Apr Index | Change | Series Average | Trend** | % Reporting Improved | % Reporting No Change | % Reporting Worsened |
Company Outlook | –9.5 | –9.4 | –0.1 | 4.8 | 12(–) | 10.8 | 68.9 | 20.3 |
General Business Activity | –17.3 | –14.4 | –2.9 | 3.0 | 12(–) | 11.6 | 59.5 | 28.9 |
| Indicator | May Index | Apr Index | Change | Series Average | Trend* | % Reporting Increase | % Reporting No Change | % Reporting Decrease |
Outlook Uncertainty | 15.8 | 16.1 | –0.3 | 13.6 | null | 27.1 | 61.6 | 11.3 |
| Business Indicators Relating to Facilities and Products in Texas Future (six months ahead) | ||||||||
| Indicator | May Index | Apr Index | Change | Series Average | Trend* | % Reporting Increase | % Reporting No Change | % Reporting Decrease |
Revenue | 28.5 | 26.0 | +2.5 | 37.7 | 37(+) | 45.2 | 38.2 | 16.7 |
Employment | 25.4 | 22.1 | +3.3 | 23.2 | 37(+) | 35.3 | 54.8 | 9.9 |
Part–Time Employment | 2.7 | –0.2 | +2.9 | 6.8 | 1(+) | 11.4 | 79.9 | 8.7 |
Hours Worked | 5.3 | 1.1 | +4.2 | 5.9 | 37(+) | 11.4 | 82.5 | 6.1 |
Wages and Benefits | 38.4 | 42.9 | –4.5 | 37.4 | 37(+) | 43.0 | 52.4 | 4.6 |
Input Prices | 37.1 | 47.7 | –10.6 | 44.7 | 197(+) | 46.2 | 44.6 | 9.1 |
Selling Prices | 25.9 | 27.6 | –1.7 | 24.6 | 37(+) | 35.8 | 54.3 | 9.9 |
Capital Expenditures | 13.6 | 16.0 | –2.4 | 23.4 | 36(+) | 25.5 | 62.6 | 11.9 |
| General Business Conditions Future (six months ahead) | ||||||||
| Indicator | May Index | Apr Index | Change | Series Average | Trend** | % Reporting Improved | % Reporting No Change | % Reporting Worsened |
Company Outlook | –1.3 | –3.8 | +2.5 | 15.9 | 3(–) | 21.4 | 56.0 | 22.7 |
General Business Activity | –13.2 | –13.0 | –0.2 | 12.6 | 13(–) | 16.2 | 54.4 | 29.4 |
Historical data are available from January 2007 to the most current release month.
| Business Indicators Relating to Facilities and Products in Texas Retail (versus previous month) | ||||||||
| Indicator | May Index | Apr Index | Change | Series Average | Trend* | % Reporting Increase | % Reporting No Change | % Reporting Decrease |
| Retail Activity in Texas | ||||||||
Sales | –3.2 | 3.2 | –6.4 | 4.4 | 1(–) | 25.2 | 46.5 | 28.4 |
Employment | –3.3 | 1.6 | –4.9 | 1.9 | 1(–) | 10.3 | 76.1 | 13.6 |
Part–Time Employment | –9.3 | –0.5 | –8.8 | –1.6 | 3(–) | 1.9 | 86.9 | 11.2 |
Hours Worked | –2.2 | –7.0 | +4.8 | –1.9 | 6(–) | 7.2 | 83.4 | 9.4 |
Wages and Benefits | 21.6 | 9.3 | +12.3 | 11.2 | 34(+) | 24.1 | 73.4 | 2.5 |
Input Prices | 24.6 | 37.7 | –13.1 | 22.6 | 37(+) | 37.2 | 50.2 | 12.6 |
Selling Prices | 8.7 | 17.3 | –8.6 | 13.9 | 36(+) | 29.3 | 50.1 | 20.6 |
Capital Expenditures | 11.2 | 4.4 | +6.8 | 8.1 | 28(+) | 22.9 | 65.4 | 11.7 |
Inventories | 17.0 | 2.8 | +14.2 | 2.3 | 12(+) | 34.9 | 47.2 | 17.9 |
| Companywide Retail Activity | ||||||||
Companywide Sales | –5.7 | –0.9 | –4.8 | 5.7 | 15(–) | 22.5 | 49.3 | 28.2 |
Companywide Internet Sales | –3.8 | –4.6 | +0.8 | 4.7 | 8(–) | 10.9 | 74.4 | 14.7 |
| General Business Conditions, Retail Current (versus previous month) | ||||||||
| Indicator | May Index | Apr Index | Change | Series Average | Trend** | % Reporting Improved | % Reporting No Change | % Reporting Worsened |
Company Outlook | –9.2 | –16.1 | +6.9 | 2.4 | 15(–) | 9.9 | 71.0 | 19.1 |
General Business Activity | –22.3 | –27.1 | +4.8 | –1.5 | 13(–) | 10.1 | 57.5 | 32.4 |
| Outlook Uncertainty Current (versus previous month) | ||||||||
| Indicator | May Index | Apr Index | Change | Series Average | Trend* | % Reporting Increase | % Reporting No Change | % Reporting Decrease |
Outlook Uncertainty | 12.9 | 11.8 | +1.1 | 11.0 | null | 22.6 | 67.7 | 9.7 |
| Business Indicators Relating to Facilities and Products in Texas, Retail Future (six months ahead) | ||||||||
| Indicator | May Index | Apr Index | Change | Series Average | Trend* | % Reporting Increase | % Reporting No Change | % Reporting Decrease |
| Retail Activity in Texas | ||||||||
Sales | –3.6 | 15.7 | –19.3 | 31.4 | 1(–) | 27.7 | 41.0 | 31.3 |
Employment | 2.7 | 15.7 | –13.0 | 13.0 | 37(+) | 18.2 | 66.3 | 15.5 |
Part–Time Employment | –4.4 | –4.9 | +0.5 | 1.6 | 6(–) | 9.4 | 76.8 | 13.8 |
Hours Worked | –11.9 | –3.3 | –8.6 | 2.6 | 8(–) | 3.7 | 80.7 | 15.6 |
Wages and Benefits | 18.5 | 39.8 | –21.3 | 29.2 | 37(+) | 24.3 | 69.9 | 5.8 |
Input Prices | 18.3 | 43.4 | –25.1 | 34.3 | 37(+) | 38.3 | 41.7 | 20.0 |
Selling Prices | 1.7 | 22.6 | –20.9 | 29.7 | 37(+) | 27.1 | 47.5 | 25.4 |
Capital Expenditures | 1.7 | 3.7 | –2.0 | 17.5 | 36(+) | 20.3 | 61.0 | 18.6 |
Inventories | 10.9 | 22.3 | –11.4 | 10.8 | 37(+) | 35.9 | 39.1 | 25.0 |
| Companywide Retail Activity | ||||||||
Companywide Sales | –6.3 | 12.2 | –18.5 | 29.9 | 1(–) | 21.2 | 51.3 | 27.5 |
Companywide Internet Sales | –11.6 | 4.6 | –16.2 | 21.8 | 1(–) | 14.0 | 60.5 | 25.6 |
| General Business Conditions, Retail Future (six months ahead) | ||||||||
| Indicator | May Index | Apr Index | Change | Series Average | Trend** | % Reporting Improved | % Reporting No Change | % Reporting Worsened |
Company Outlook | –13.4 | –11.5 | –1.9 | 15.7 | 13(–) | 16.2 | 54.2 | 29.6 |
General Business Activity | –25.6 | –20.8 | –4.8 | 11.1 | 14(–) | 12.8 | 48.8 | 38.4 |
*Shown is the number of consecutive months of expansion or contraction in the underlying indicator. Expansion is indicated by a positive index reading and denoted by a (+) in the table. Contraction is indicated by a negative index reading and denoted by a (–) in the table.
**Shown is the number of consecutive months of improvement or worsening in the underlying indicator. Improvement is indicated by a positive index reading and denoted by a (+) in the table. Worsening is indicated by a negative index reading and denoted by a (–) in the table.
Data have been seasonally adjusted as necessary.
Texas Service Sector Outlook Survey
Texas Retail Outlook Survey
Texas Service Sector Outlook Survey
Comments from survey respondents
These comments are from respondents’ completed surveys and have been edited for publication.
- Congressional inaction on raising the debt limit is disconcerting to clients, which impacts the prospects of utilizing our services.
- We are looking to obtain at least one federal contract in the next four months.
- [There is] increased uncertainty and stress due to the lack of qualified workers to meet growing demand. [There are] enough disruptions and remote work; we need the stability of an in-office workforce to manage productivity and work ethic.
- Our current outlook for 2023 is high interest and inflation rates to follow into the end of the year. [There will be] more market fluctuations to follow through the next six months.
- Our clients are continuing to delay decisions to work with us.
- The economic outlook and activity have not changed and, generally, the market is in a buying holding pattern due to the uncertainty and potential for additional negative economic factors.
- We have a good month; then we have a bad month. Real estate projects are not happening for a variety of factors. Interest rates are having a huge impact, while rents are flat. Land pricing and construction costs remain high. Finally, banks are requiring greater participation, and equity partners want bigger returns. All this conspires to create fewer opportunities for development.
- Things are getting very busy, and it is getting harder and harder to find good talent.
- We are concerned about how the federal debt ceiling crisis will be resolved and about future interest rate increases by the Federal Reserve.
- Although revenue has not decreased month over month, we anticipate that will happen in the months to come. Our residential division has recovered slightly from the second half of 2022, but inventory remains low and interest rates high. The commercial real estate market is starting to feel the pressure of the regional bank issues and has slowed dramatically. Commercial orders are down 45 percent over 2022, and revenue is about the same. We are afraid that the worst is yet to come for these markets due to the uncertainty of interest rates and the financial stability of the regional banks.
- We are seeing a drop in revenue, but our revenue is a lagging indicator of current activity. This summer should see an increase in activity, but that revenue might not hit until the second half of 2023.
- Despite talk of recession and economic downtown, there is no apparent evidence of such.
- Businesses are preparing for a recession by looking for ways to cut back, which in some ways, works to create a self-fulfilling prophecy.
- The uncertainty surrounding the default of the U.S debt. is disconcerting. The environment in Washington creates a level of uncertainty, which is troubling, and it’s impossible to forecast or predict future projects.
- We are government contractors; our prices are fixed for the duration of the contract.
- Wages and access to capital continue to be factors. Credit ratings continue to be affected by the availability of funding for businesses with a challenged credit rating. Rising interest rates are not helping.
- With manufacturing declining and the consumer shifting to services consumption versus purchases, the demand for boxes and packaging has decreased.
- Inflation has really been a concern for us and our vendors. It's becoming very difficult to absorb the increase in prices at every level.
- Cost of services sold remains high without the ability to raise prices without adversely affecting demand for services.
- Continued wage inflation is a big challenge.
- The booking pace for leisure travel is down to last year’s throughout the summer, and prices in the market have begun to lower.
- Demand is softening, and we are still having issues staffing certain positions at the hotel. From our perspective, our lack of action on immigration is causing undue strain on our business and the overall economy.
- We are seeing a noticeable slowdown in the level of business activity in our manufacturing industry clients, especially in the consumer goods and auto-industry-related companies.
- Our two main challenges have been employee related and the increasing cost of technology. Our outlook for the next six months of staying positive is based on the hope we will fill four open positions by the end of June 2023. Once we get the right people in the right seats, we should be in fairly good shape. The second challenge is the increasing cost of technology, which is always a threat to us being a small company. Our uncertainty has increased due to the simple fact that it is difficult to find hard-working talent.
- Equity and debt capital providers for commercial real estate development and acquisitions continue to stop making new investments and/or reduce commitments.
- We and our vendors are having increased difficulty getting paid timely. Several highly leveraged apartment owners we provide management services for are on the brink of collapse. Rising insurance and interest rates along with higher property taxes have put them in a negative cash flow situation that is not going to get better soon. Their choice is to find additional capital or let the lender take properties back and wipe out their equity. Some are trying to sell but are finding the discount buyers’ demand unacceptable as well.
- From the 475 properties listed for sale, one-quarter are over $500,000 and are slow selling; there are more active area sales agents than properties available, so there is tough competition and pressure on commissions.
- [There are] concerns about the impact of student loan repayment reducing consumer spending. Also, [there is] general uncertainty regarding the stability of our economy, now increased by the debt ceiling talks. Our industry's main question: "Have we hit bottom yet?" We fully expected things to pick up, but just hear more stories of competitors either losing money or going out of business.
- Even though a potential global slowdown looms ahead, nearshoring gives us hope the border area will remain the same or better.
- The banking crisis and compounding impact of the high cost of capital, general commercial uncertainty and consumer spending fluctuations are culminating to place heavy pressure on our business, which has moved us to lay off hundreds of employees this year. There is a very real scenario where we will not be able to grow or even operate at current levels. Inflation has not been an acute problem for us or our customers, but the cost of capital and economic pessimism are having a profound impact on us and our customers' businesses.
- Disregarding the debt ceiling fight, we see business conditions otherwise as very stable, both month to month and through to the end of the year.
- Continued inflation and bank closures are impacting purchasing decisions, creating more due diligence reviews, and they generally have decision-makers more hesitant to make business decisions.
- The anticipation of a possible recession has had a negative impact on the business environment. Loan activity is continuing to slow down, and interest expense is compressing profit margins.
- Higher interest rates and other increased costs continue to negatively impact operating profits. Reorganization efforts eliminated positions to reduce the workforce and salary/benefit costs.
- Our diversification has allowed us to stay level on growth—revenue and head count—as one line of business has seen reduced results, others have seen increased returns helped by high interest rates.
- We are seeing signs of slower consumer spending at restaurants, and our sales have been slowing since March.
- We continue to experience supply issues and shipping issues with new vehicles that hurt overall availability. The short supply of vehicles continues to hold up pricing and restrict volume, thus hurting used-car supply.
- Interest rates have killed business along with high inflation.
- The rising rate environment is affecting those customers that need to find suitable transportation. Those customers with the ability to pay cash are still in the market. Inventory levels are rising slightly, but continued rate increases could lead to a flip to prepandemic times of excess inventory versus [lack of] demand by the end of the year.
- Our cost of capital is about $600,000 more than last year as a result of high interest rates. We have already canceled three new projects.
- Lower commodity prices along with the depressed housing market is the main cause for an approximately 30 percent fall in both sales and profits compared with 2022.
- The cost of doing business per transaction is increasing as the max retail price is coming down in the next month.
- Changes in legislation surrounding PBMs [pharmacy benefit managers] and the requirement for more transparency has lessened the grips that PBMs have had on the industry. Patients are getting more aggressive with demanding they have more control and freedom to choose a closer, more consistent specialty pharmacy to service them. Policies are helping the mission to break down PBMs and the monopoly they hold on the industry.
- The labor shortage is really hurting us. We are spending over $1,500 per month advertising for two truck-driving jobs.
- Business is still not consistent from day to day. We will see what happens after the kids get out of school [for the summer]. I have some customers who have really cut back.
- We feel that the extreme reduction in office workers has affected lunch sales in a semi-permanent way, and we don’t think it will correct itself until 2026. We adjusted hours at all our restaurants and will offer brunch items on Fridays, but it is not working. In order to stay in business, we are making large and small capital improvements and controlling costs, and we eliminated some positions.
- We continue below 2019 [levels] in customer volume Mondays–Thursdays due to a lack of back to office [customers] and business travel, which is still below prepandemic [levels]. Hiring remains ridiculously difficult, and upward wage pressure continues unabated. Many new hires are unwilling to do what is necessary for the business.
- Sales continue to increase over the prior year, [but there have been] no price increases in 2023. The general business outlook for 2023 will continue to be positive. The cost of goods has remained the same; however, the price of liquid eggs is expected to decrease by 20 percent, which is good since egg burritos are 45 percent of my business.
- We still see higher wages and higher input cost of sales. We are also struggling with enough workers in our industry.
Historical Data
Historical data can be downloaded dating back to January 2007.
Indexes
Download indexes for all indicators. For the definitions of all variables, see data definitions.
Texas Service Sector Outlook Survey |
Texas Retail Outlook Survey |
| Unadjusted | Unadjusted |
| Seasonally adjusted | Seasonally adjusted |
All Data
Download indexes and components of the indexes (percentage of respondents reporting increase, decrease, or no change). For the definitions of all variables, see data definitions.
Texas Service Sector Outlook Survey |
Texas Retail Outlook Survey |
| Unadjusted | Unadjusted |
| Seasonally adjusted | Seasonally adjusted |
Questions regarding the Texas Service Sector Outlook Survey can be addressed to Jesus Cañas at jesus.canas@dal.frb.org.
Sign up for our email alert to be automatically notified as soon as the latest Texas Service Sector Outlook Survey is released on the web.