
Texas Service Sector Outlook Survey
Texas service sector activity strengthens
For this month’s survey, Texas business executives were asked supplemental questions on wages, prices, outlook concerns and remote work. Results for these questions from the Texas Manufacturing Outlook Survey, Texas Service Sector Outlook Survey and Texas Retail Outlook Survey have been released together. Read the special questions results.
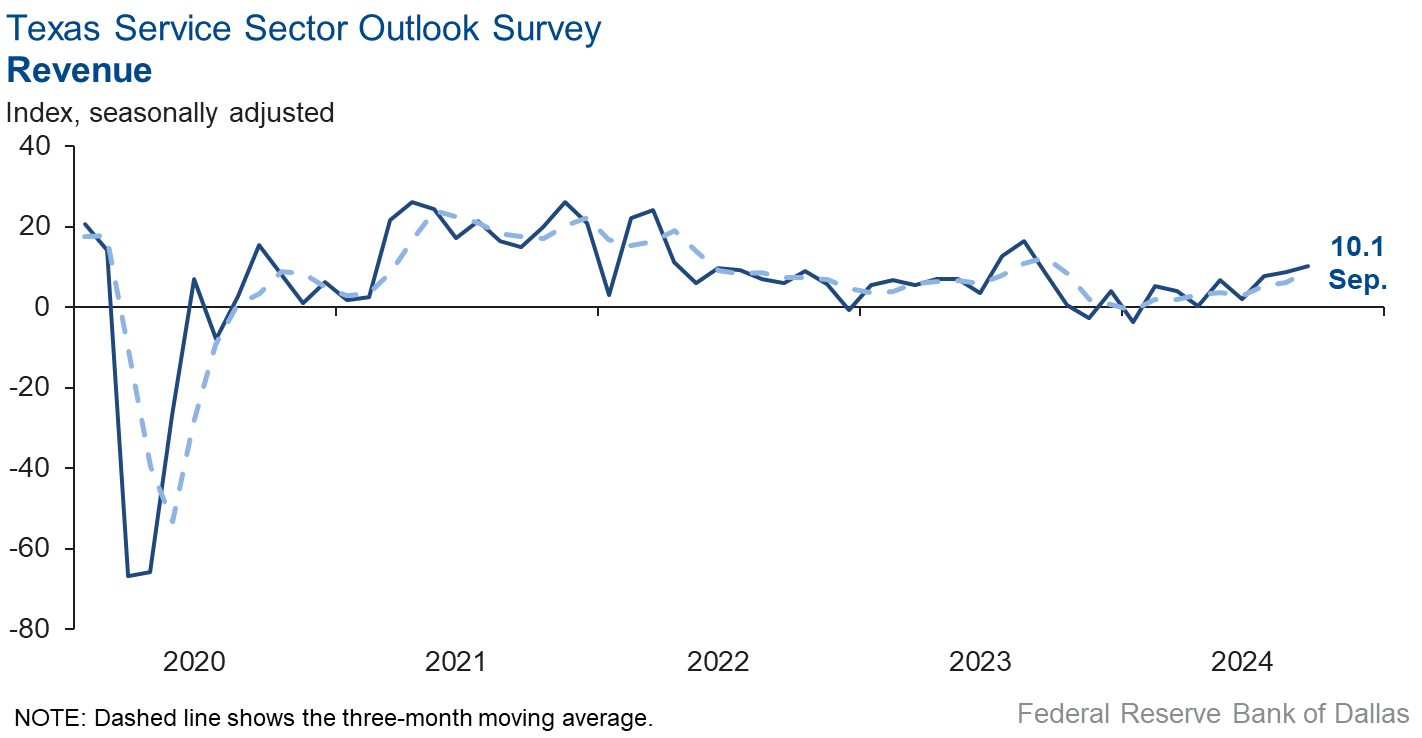
Texas service sector activity accelerated in September, according to business executives responding to the Texas Service Sector Outlook Survey. The revenue index, a key measure of state service sector conditions, rose to 10.1, the highest level in 13 months.
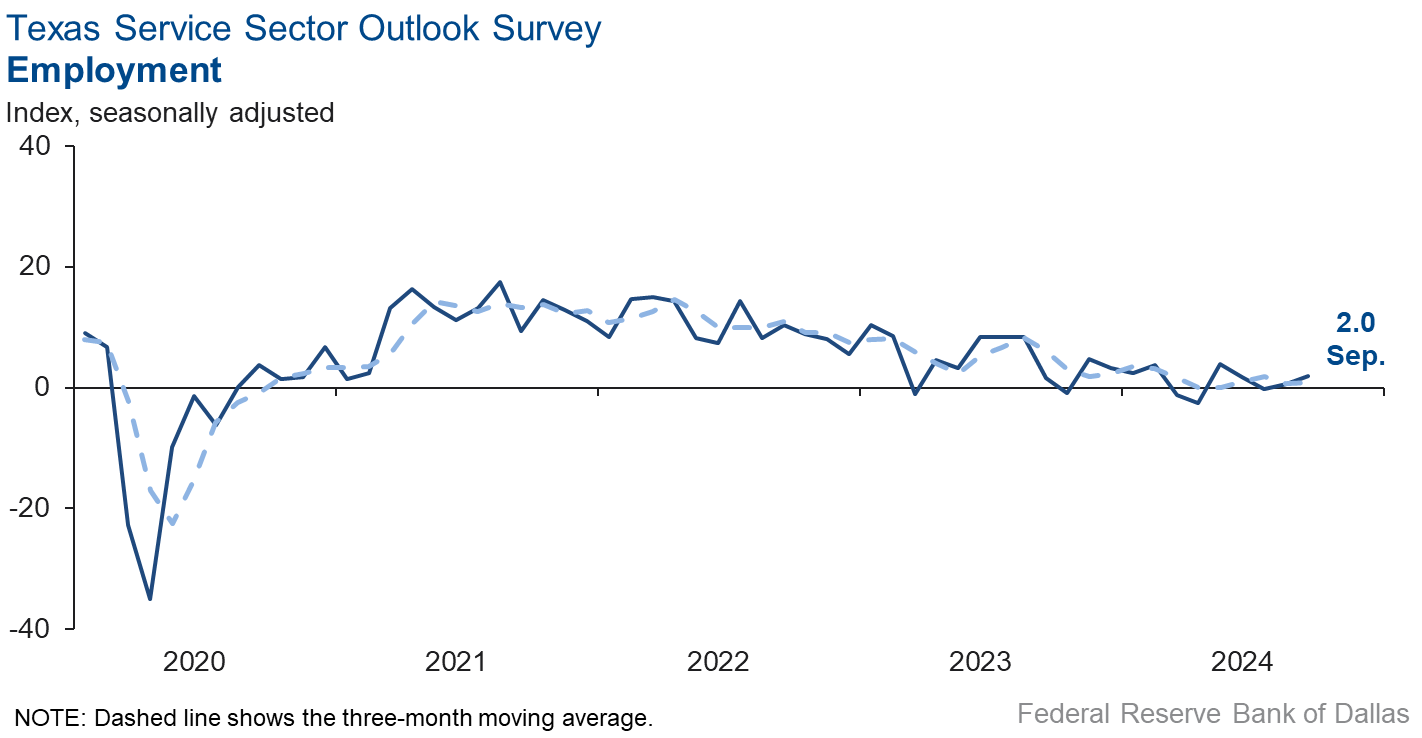
Labor market measures suggested little growth in employment in September and no change in hours worked. The employment index held fairly steady at 2.0 while the part-time employment index was flat. The hours-worked index was unchanged at -0.8.
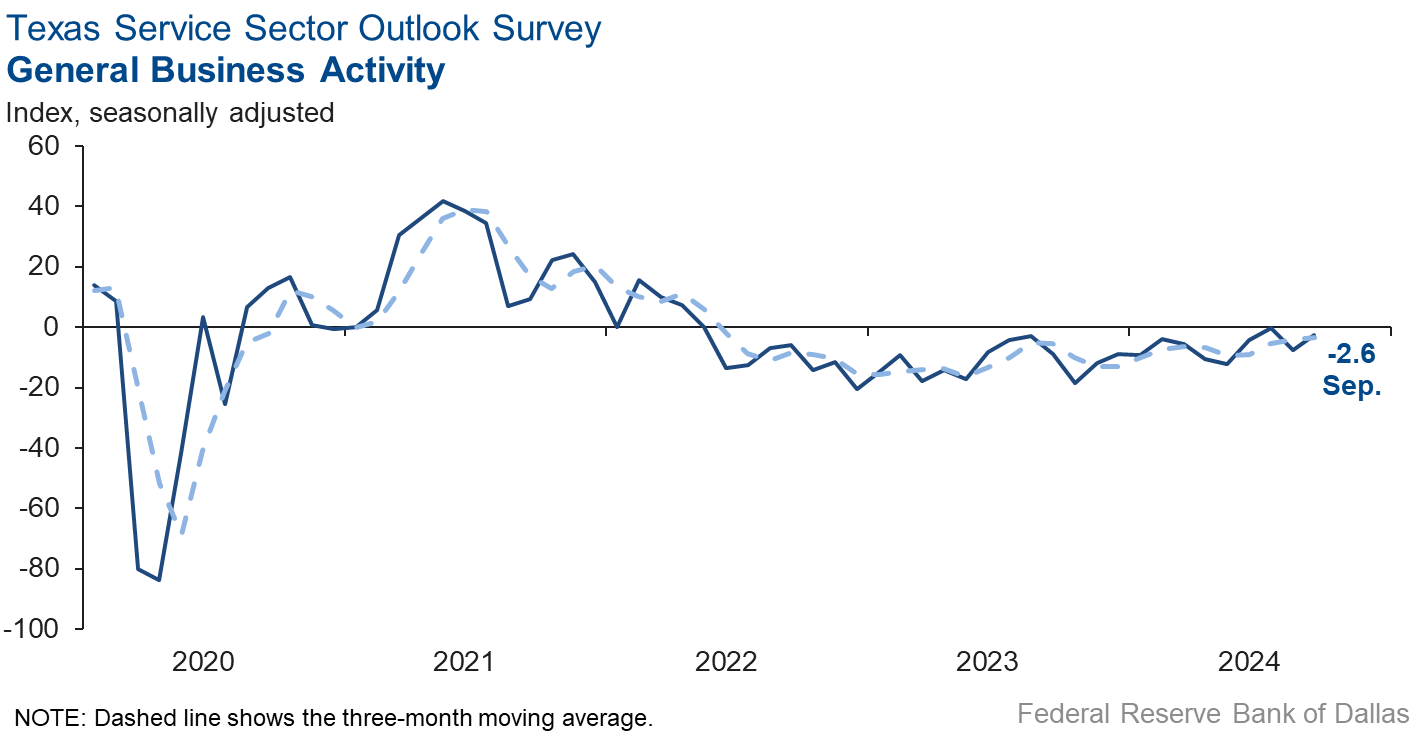
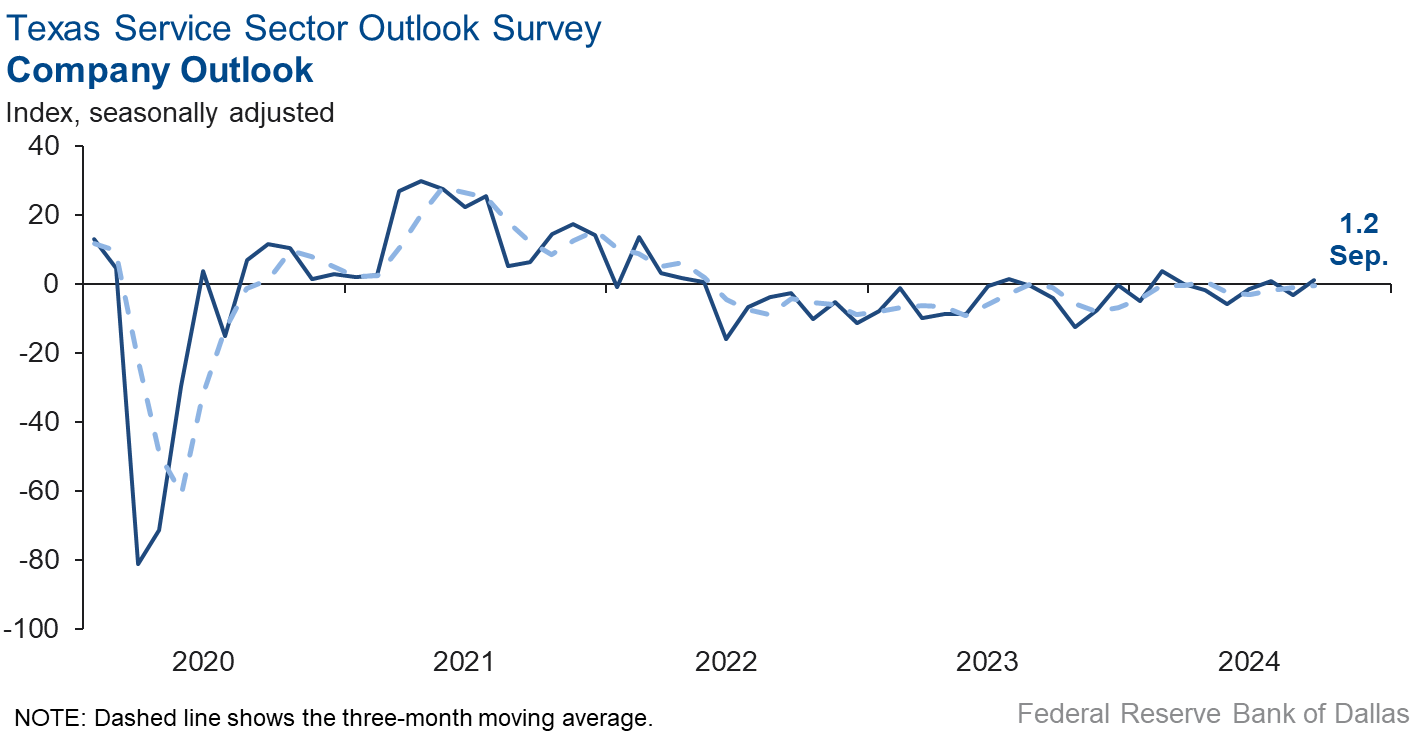
Perceptions of broader business conditions were mixed in September. The general business activity index improved to -2.6, with the negative reading still signaling worsening activity. The company outlook index increased four points to 1.2. The outlook uncertainty index fell five points to 9.4.
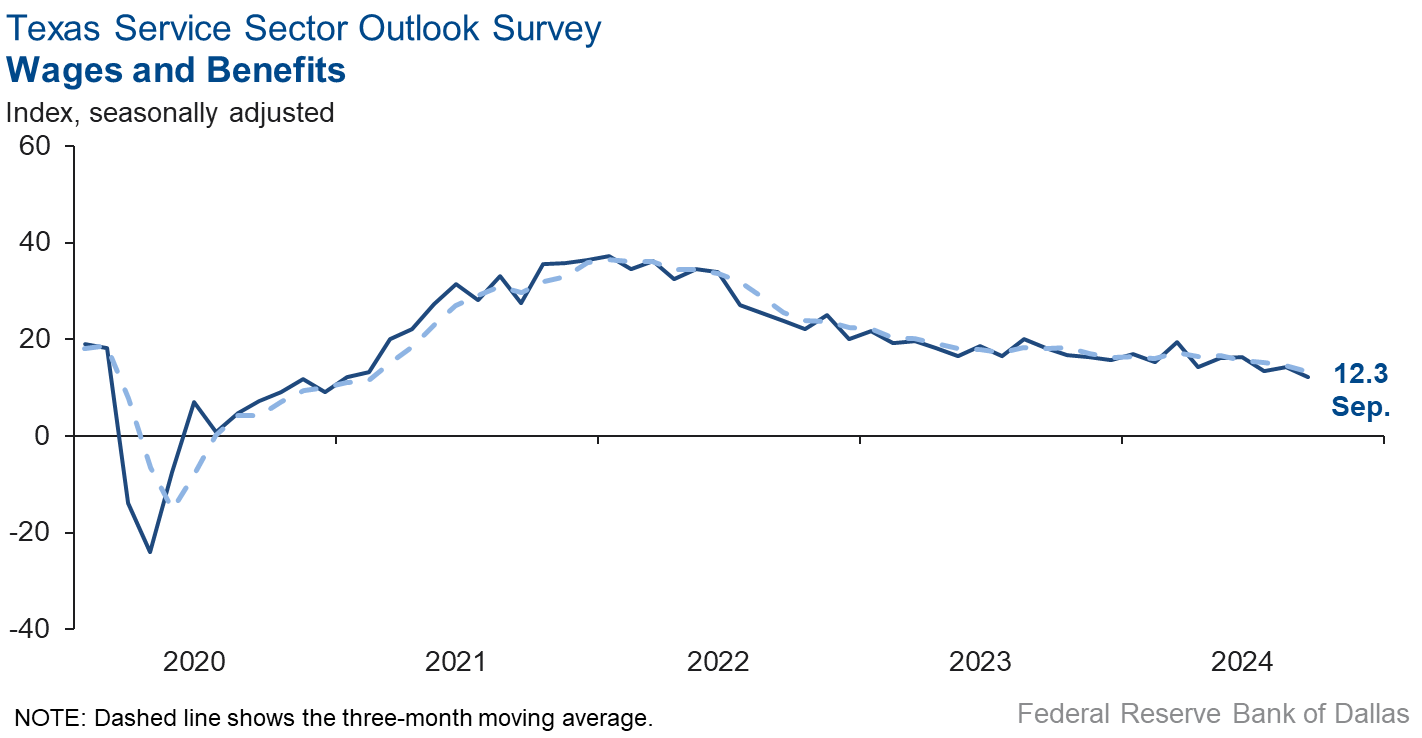
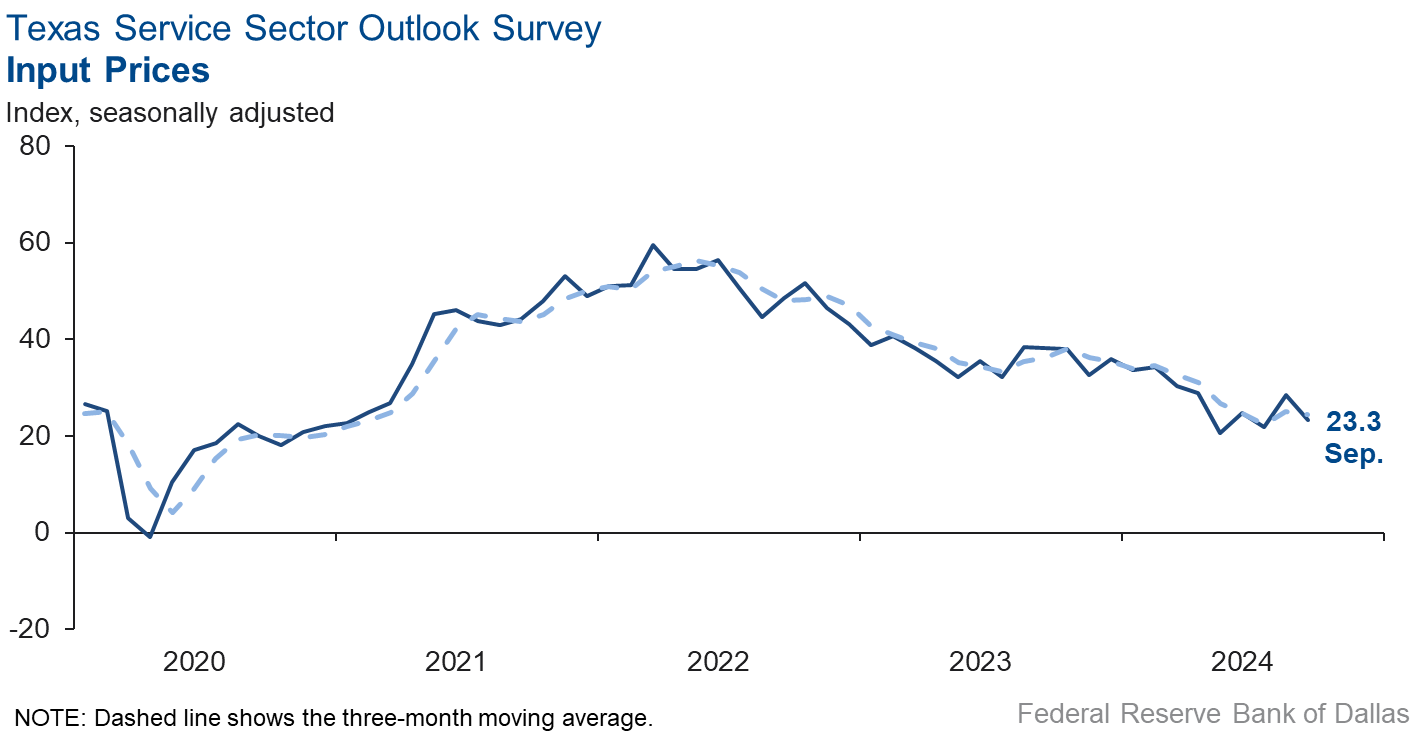
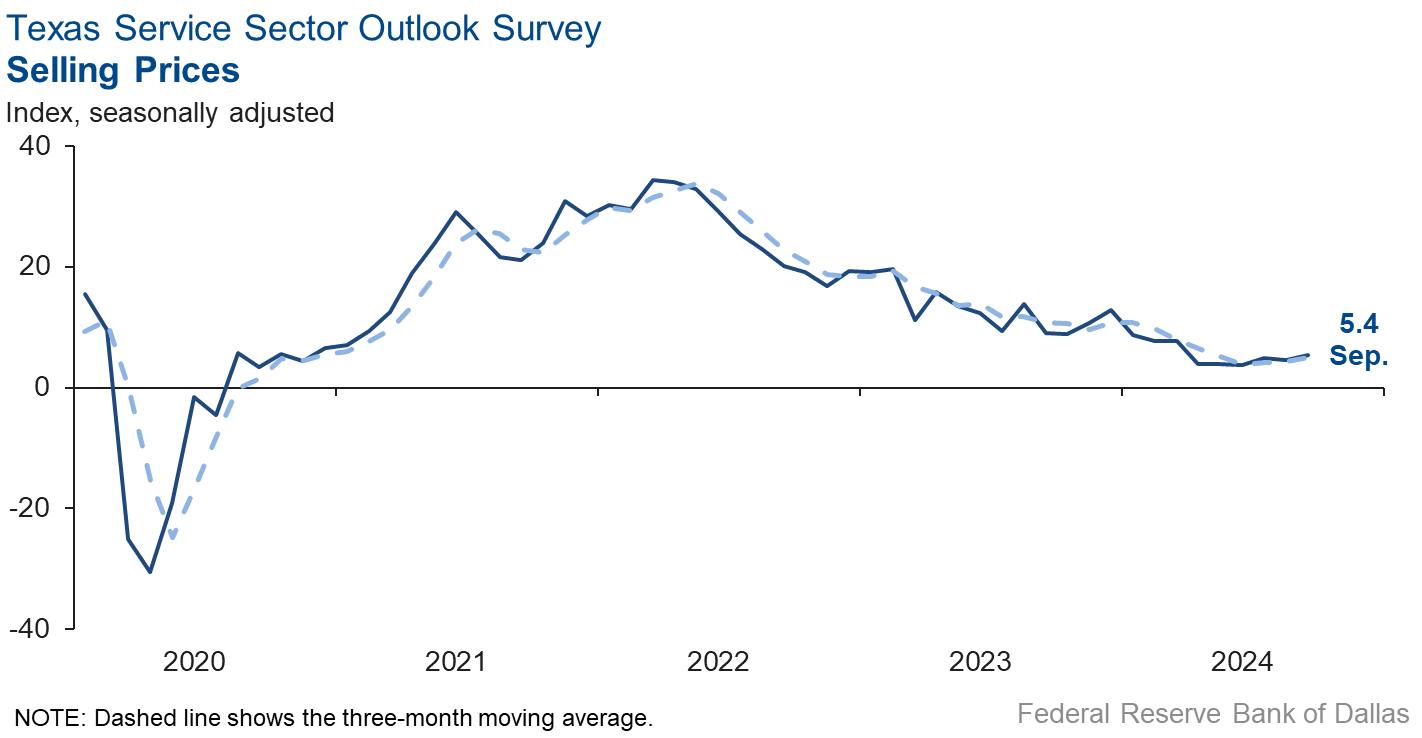
Wage and selling price pressures held steady, while input price pressures eased in September. The selling price index was basically unchanged at 5.4, while the input price index fell five points to 23.3. The wages and benefits index fell two points to 12.3.
Respondents’ expectations regarding future business activity reflected optimism in September. The future general business activity index jumped 13 points to 16.0, while the future revenue index increased four points to 35.1. Other future service-sector activity indexes such as employment and capital expenditures remained in positive territory, reflecting expectations for continued growth in the next six months.
Texas Retail Outlook Survey
Texas retail sales contraction continues
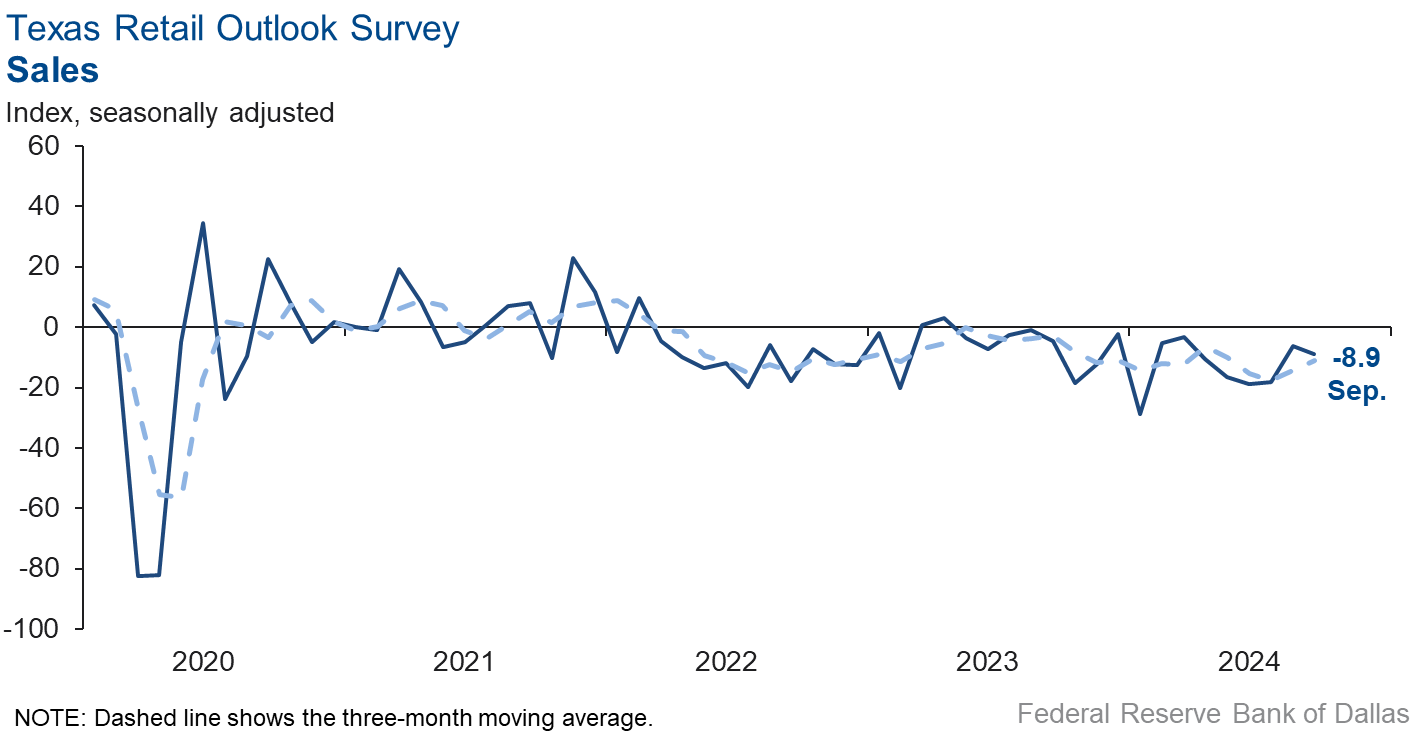
Retail sales activity declined in September, according to business executives responding to the Texas Retail Outlook Survey. The sales index, a key measure of state retail activity, fell three points to -8.9. Retailers’ inventories were unchanged over the month, with an index reading near zero.
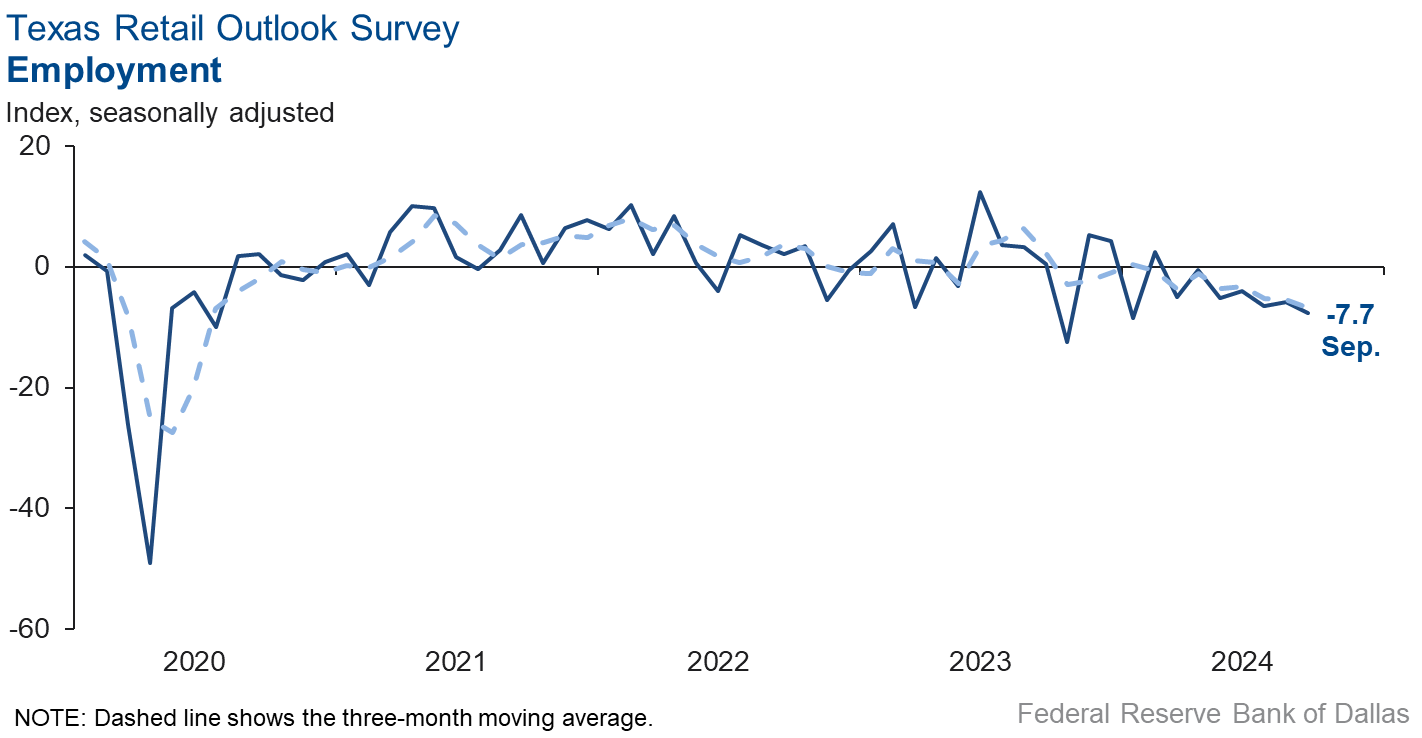
Retail labor market indicators suggested a contraction in employment and workweeks this month. The employment index fell two points to -7.7, while the part-time employment index remained in negative territory but increased to -5.0. The hours-worked index was basically unchanged at -9.9.
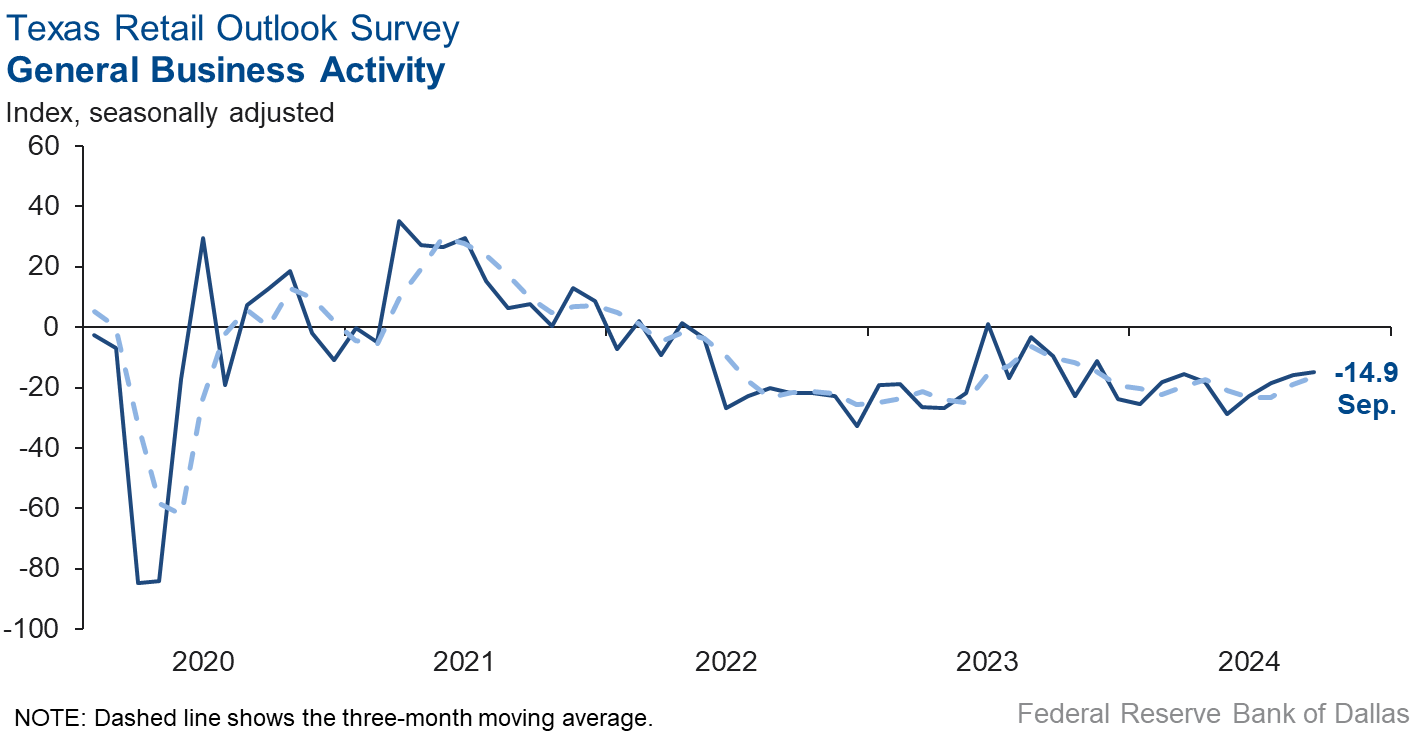
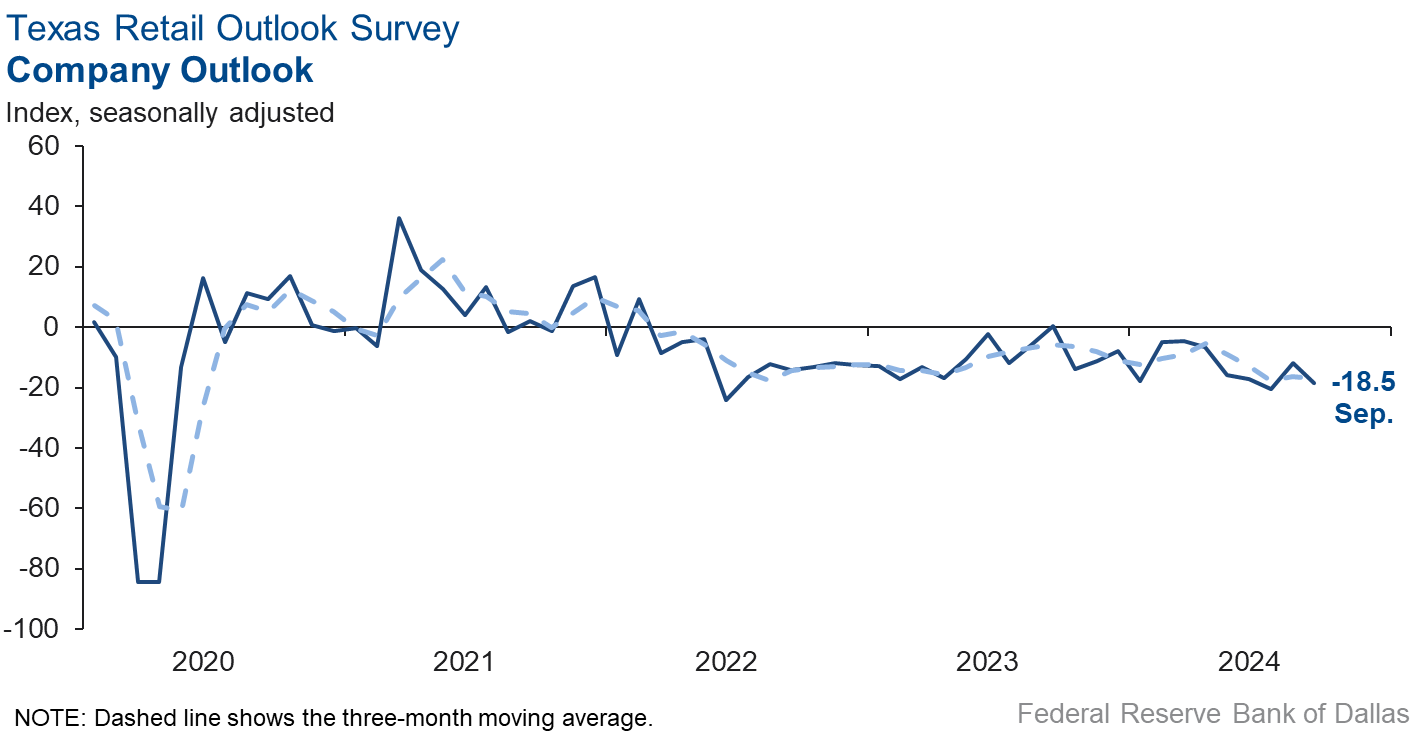
Retailers continued to perceive a worsening of broader business conditions in September. The general business activity index was practically unchanged at -14.9. The company outlook index fell seven points to -18.5, and uncertainty in outlooks increased.
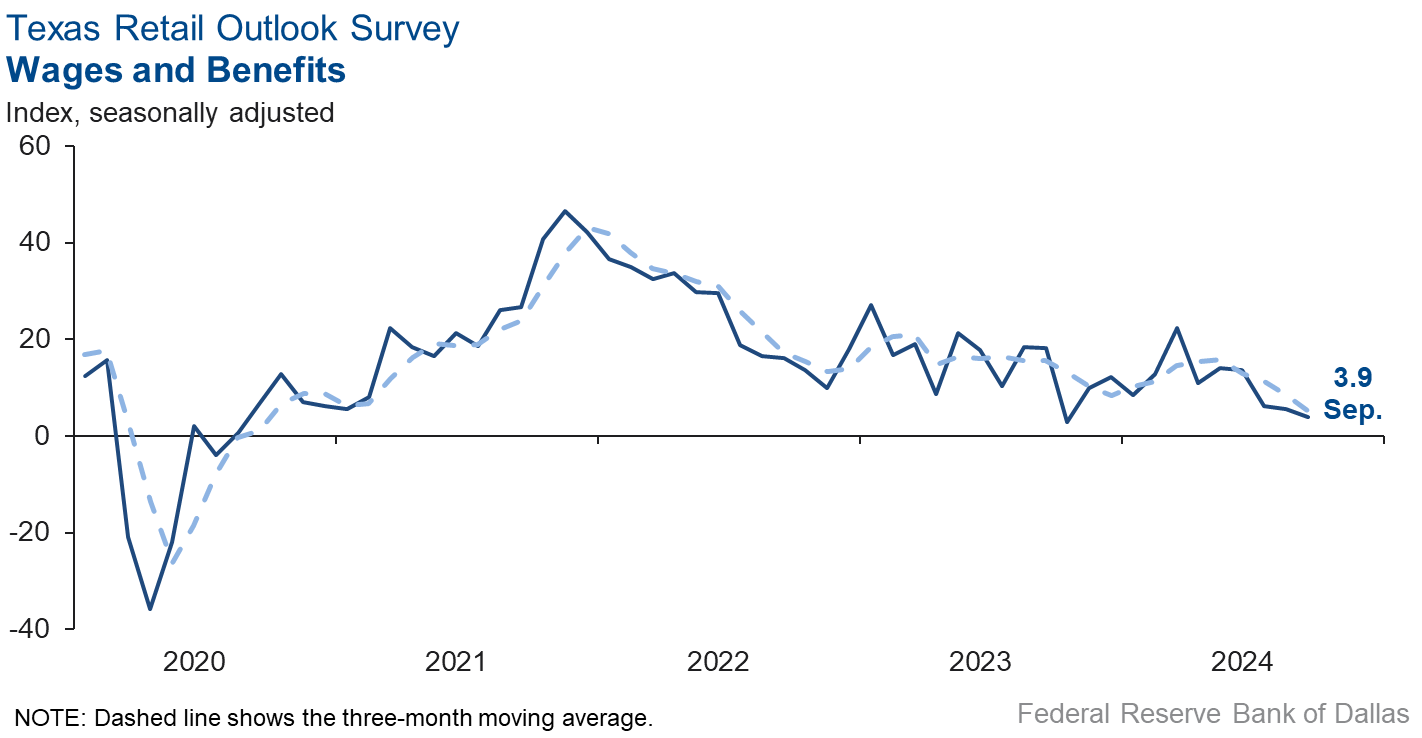
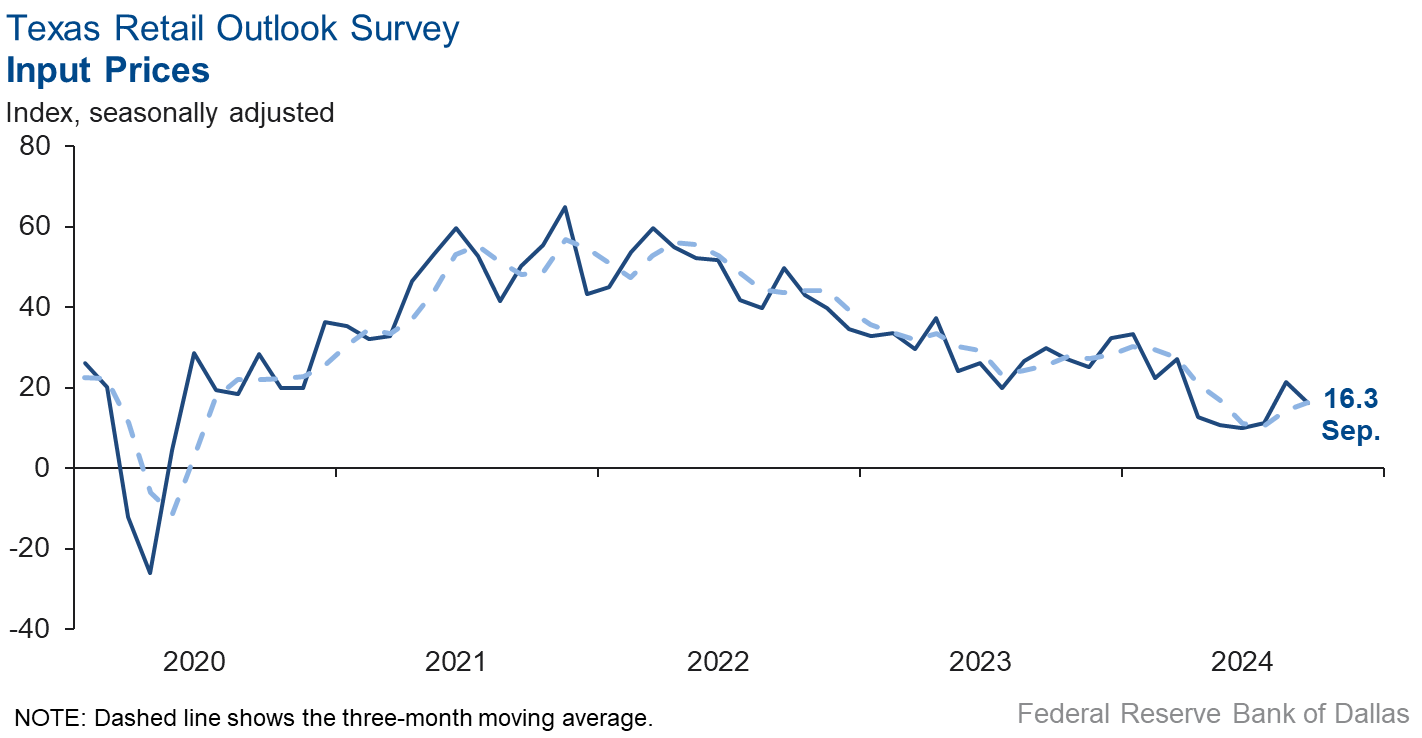
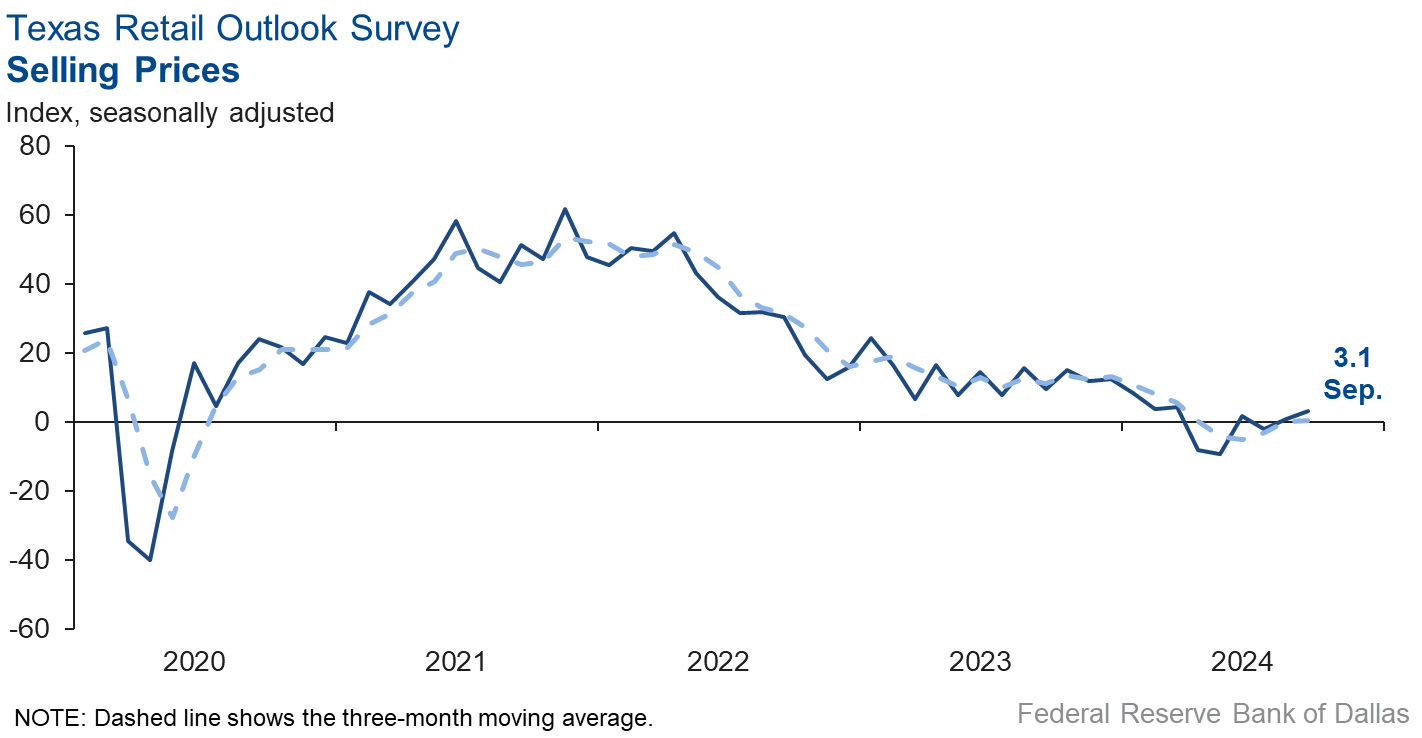
Selling price growth increased slightly in September, while input price growth moderated. Wage pressures held steady from the prior month. The selling price index increased two points to 3.1, while the input price index fell five points to 16.3. The wages and benefits index was essentially unchanged at 3.9.
Expectations for future business conditions in retail were mixed in September. The future general business activity index dipped into negative territory, falling four points to -1.8, while the future sales index was positive and largely unchanged at 15.8. The future employment index remained in negative territory for the third month in a row, and the capital expenditures index with its near-zero reading signaled no growth in capital expenditures six months from now.
Next release: October 29, 2024
Data were collected September 17–25, and 260 of the 401 Texas service sector business executives surveyed submitted responses. The Dallas Fed conducts the Texas Service Sector Outlook Survey monthly to obtain a timely assessment of the state’s service sector activity. Firms are asked whether revenue, employment, prices, general business activity and other indicators increased, decreased or remained unchanged over the previous month.
Survey responses are used to calculate an index for each indicator. Each index is calculated by subtracting the percentage of respondents reporting a decrease from the percentage reporting an increase. When the share of firms reporting an increase exceeds the share reporting a decrease, the index will be greater than zero, suggesting the indicator has increased over the prior month. If the share of firms reporting a decrease exceeds the share reporting an increase, the index will be below zero, suggesting the indicator has decreased over the prior month. An index will be zero when the number of firms reporting an increase is equal to the number of firms reporting a decrease. Data have been seasonally adjusted as necessary.
Data have been seasonally adjusted as necessary.
Texas Service Sector Outlook Survey
Historical data are available from January 2007 to the most current release month.
| Business Indicators Relating to Facilities and Products in Texas Current (versus previous month) | ||||||||
| Indicator | Sep Index | Aug Index | Change | Series Average | Trend* | % Reporting Increase | % Reporting No Change | % Reporting Decrease |
Revenue | 10.1 | 8.7 | +1.4 | 10.6 | 8(+) | 27.3 | 55.5 | 17.2 |
Employment | 2.0 | 0.6 | +1.4 | 6.2 | 2(+) | 12.6 | 76.8 | 10.6 |
Part–Time Employment | –0.4 | –4.9 | +4.5 | 1.3 | 5(–) | 4.9 | 89.8 | 5.3 |
Hours Worked | –0.8 | –0.7 | –0.1 | 2.6 | 3(–) | 7.1 | 85.0 | 7.9 |
Wages and Benefits | 12.3 | 14.2 | –1.9 | 15.8 | 52(+) | 16.3 | 79.7 | 4.0 |
Input Prices | 23.3 | 28.4 | –5.1 | 27.9 | 53(+) | 28.1 | 67.1 | 4.8 |
Selling Prices | 5.4 | 4.5 | +0.9 | 7.6 | 50(+) | 15.9 | 73.6 | 10.5 |
Capital Expenditures | 7.6 | 5.3 | +2.3 | 9.9 | 50(+) | 13.9 | 79.8 | 6.3 |
| General Business Conditions Current (versus previous month) | ||||||||
| Indicator | Sep Index | Aug Index | Change | Series Average | Trend** | % Reporting Improved | % Reporting No Change | % Reporting Worsened |
Company Outlook | 1.2 | –3.1 | +4.3 | 4.3 | 1(+) | 18.0 | 65.2 | 16.8 |
General Business Activity | –2.6 | –7.7 | +5.1 | 2.2 | 28(–) | 17.5 | 62.4 | 20.1 |
| Indicator | Sep Index | Aug Index | Change | Series Average | Trend* | % Reporting Increase | % Reporting No Change | % Reporting Decrease |
Outlook Uncertainty | 9.4 | 13.9 | –4.5 | 13.4 | 40(+) | 23.6 | 62.2 | 14.2 |
| Business Indicators Relating to Facilities and Products in Texas Future (six months ahead) | ||||||||
| Indicator | Sep Index | Aug Index | Change | Series Average | Trend* | % Reporting Increase | % Reporting No Change | % Reporting Decrease |
Revenue | 35.1 | 31.3 | +3.8 | 37.3 | 53(+) | 49.8 | 35.6 | 14.7 |
Employment | 16.0 | 17.1 | –1.1 | 23.0 | 53(+) | 26.5 | 63.0 | 10.5 |
Part–Time Employment | 0.9 | 1.8 | –0.9 | 6.6 | 4(+) | 7.1 | 86.7 | 6.2 |
Hours Worked | 6.6 | 4.1 | +2.5 | 5.8 | 53(+) | 11.4 | 83.8 | 4.8 |
Wages and Benefits | 37.1 | 33.5 | +3.6 | 37.4 | 53(+) | 40.6 | 55.9 | 3.5 |
Input Prices | 32.9 | 36.6 | –3.7 | 44.4 | 213(+) | 40.2 | 52.5 | 7.3 |
Selling Prices | 14.6 | 18.0 | –3.4 | 24.5 | 53(+) | 27.6 | 59.4 | 13.0 |
Capital Expenditures | 13.8 | 13.9 | –0.1 | 22.8 | 52(+) | 24.6 | 64.6 | 10.8 |
| General Business Conditions Future (six months ahead) | ||||||||
| Indicator | Sep Index | Aug Index | Change | Series Average | Trend** | % Reporting Improved | % Reporting No Change | % Reporting Worsened |
Company Outlook | 17.4 | 12.4 | +5.0 | 15.4 | 11(+) | 33.2 | 51.0 | 15.8 |
General Business Activity | 16.0 | 3.3 | +12.7 | 11.9 | 5(+) | 32.2 | 51.6 | 16.2 |
Historical data are available from January 2007 to the most current release month.
| Business Indicators Relating to Facilities and Products in Texas Retail (versus previous month) | ||||||||
| Indicator | Sep Index | Aug Index | Change | Series Average | Trend* | % Reporting Increase | % Reporting No Change | % Reporting Decrease |
| Retail Activity in Texas | ||||||||
Sales | –8.9 | –6.2 | –2.7 | 3.3 | 17(–) | 20.4 | 50.3 | 29.3 |
Employment | –7.7 | –5.9 | –1.8 | 1.6 | 7(–) | 8.1 | 76.1 | 15.8 |
Part–Time Employment | –5.0 | –18.6 | +13.6 | –1.6 | 2(–) | 3.9 | 87.2 | 8.9 |
Hours Worked | –9.9 | –8.6 | –1.3 | –2.3 | 9(–) | 5.6 | 78.9 | 15.5 |
Wages and Benefits | 3.9 | 5.5 | –1.6 | 11.2 | 50(+) | 14.4 | 75.1 | 10.5 |
Input Prices | 16.3 | 21.4 | –5.1 | 22.6 | 53(+) | 28.2 | 59.9 | 11.9 |
Selling Prices | 3.1 | 0.8 | +2.3 | 13.3 | 2(+) | 22.3 | 58.5 | 19.2 |
Capital Expenditures | 7.5 | 1.7 | +5.8 | 7.6 | 2(+) | 15.9 | 75.7 | 8.4 |
Inventories | 0.6 | 15.8 | –15.2 | 2.7 | 2(+) | 19.9 | 60.8 | 19.3 |
| Companywide Retail Activity | ||||||||
Companywide Sales | –6.8 | –12.9 | +6.1 | 4.5 | 6(–) | 19.6 | 54.0 | 26.4 |
Companywide Internet Sales | –0.3 | –10.9 | +10.6 | 3.9 | 2(–) | 18.8 | 62.1 | 19.1 |
| General Business Conditions, Retail Current (versus previous month) | ||||||||
| Indicator | Sep Index | Aug Index | Change | Series Average | Trend** | % Reporting Improved | % Reporting No Change | % Reporting Worsened |
Company Outlook | –18.5 | –11.8 | –6.7 | 1.4 | 12(–) | 10.2 | 61.1 | 28.7 |
General Business Activity | –14.9 | –15.9 | +1.0 | –2.6 | 15(–) | 11.7 | 61.7 | 26.6 |
| Outlook Uncertainty Current (versus previous month) | ||||||||
| Indicator | Sep Index | Aug Index | Change | Series Average | Trend* | % Reporting Increase | % Reporting No Change | % Reporting Decrease |
Outlook Uncertainty | 18.2 | 8.7 | +9.5 | 11.1 | 2(+) | 27.3 | 63.6 | 9.1 |
| Business Indicators Relating to Facilities and Products in Texas, Retail Future (six months ahead) | ||||||||
| Indicator | Sep Index | Aug Index | Change | Series Average | Trend* | % Reporting Increase | % Reporting No Change | % Reporting Decrease |
| Retail Activity in Texas | ||||||||
Sales | 15.8 | 14.2 | +1.6 | 30.4 | 16(+) | 35.6 | 44.6 | 19.8 |
Employment | –6.7 | –4.2 | –2.5 | 12.6 | 3(–) | 9.0 | 75.3 | 15.7 |
Part–Time Employment | –7.5 | –1.5 | –6.0 | 1.5 | 4(–) | 3.0 | 86.5 | 10.5 |
Hours Worked | –2.6 | –3.3 | +0.7 | 2.4 | 2(–) | 6.7 | 84.0 | 9.3 |
Wages and Benefits | 20.4 | 14.9 | +5.5 | 29.0 | 53(+) | 26.9 | 66.6 | 6.5 |
Input Prices | 24.5 | 26.7 | –2.2 | 33.7 | 53(+) | 35.8 | 52.8 | 11.3 |
Selling Prices | 3.8 | 13.3 | –9.5 | 28.6 | 53(+) | 26.4 | 50.9 | 22.6 |
Capital Expenditures | –0.2 | 4.9 | –5.1 | 16.6 | 1(–) | 18.8 | 62.2 | 19.0 |
Inventories | 12.3 | 21.4 | –9.1 | 10.8 | 11(+) | 27.6 | 57.1 | 15.3 |
| Companywide Retail Activity | ||||||||
Companywide Sales | 5.8 | 16.2 | –10.4 | 28.8 | 16(+) | 28.3 | 49.2 | 22.5 |
Companywide Internet Sales | 2.5 | 9.7 | –7.2 | 21.0 | 8(+) | 17.5 | 67.5 | 15.0 |
| General Business Conditions, Retail Future (six months ahead) | ||||||||
| Indicator | Sep Index | Aug Index | Change | Series Average | Trend** | % Reporting Improved | % Reporting No Change | % Reporting Worsened |
Company Outlook | –6.3 | 3.5 | –9.8 | 14.8 | 1(–) | 17.9 | 57.9 | 24.2 |
General Business Activity | –1.8 | 2.2 | –4.0 | 10.2 | 1(–) | 24.5 | 49.3 | 26.3 |
*Shown is the number of consecutive months of expansion or contraction in the underlying indicator. Expansion is indicated by a positive index reading and denoted by a (+) in the table. Contraction is indicated by a negative index reading and denoted by a (–) in the table.
**Shown is the number of consecutive months of improvement or worsening in the underlying indicator. Improvement is indicated by a positive index reading and denoted by a (+) in the table. Worsening is indicated by a negative index reading and denoted by a (–) in the table.
Data have been seasonally adjusted as necessary.
Texas Service Sector Outlook Survey
Texas Retail Outlook Survey
Texas Service Sector Outlook Survey
Comments from survey respondents
These comments are from respondents’ completed surveys and have been edited for publication.
- I feel the economy is getting better.
- Our employees are very overworked. We have had a very difficult time finding qualified engineers. Our main emphasis for the next six months will be to fill some key positions.
- The shortage in the experienced professional workforce continues. We're in a medium market, and there is staff poaching going on. Competitors are throwing money and flex-hour options to entice employees to change jobs.
- The anticipated rate decrease may improve business activity in the fourth quarter.
- The recent rate decrease will ease some of the trepidation of the upcoming fiscal year. Hopefully, in the coming months, this will translate into available funding for business expansion.
- The November election is the determiner of how things will improve or not.
- The overall business activity has increased slightly in the commercial real estate market but has slowed in the residential real estate. We are encouraged by the increase in the commercial sector and feel the residential sector will see some improvement in the months to come. A decrease in the interest rate is much needed.
- The rate cut will help our clients’ cash flow and thus create more spending/revenue.
- Uncertainty is high. We are putting capital into our company for the first time since its inception to keep the operations afloat. A lot of our workers are contractors, and they're really suffering.
- The rising cost of living in Dallas has impacted both our employees' financial situations and the labor costs required to retain them in an increasingly competitive market. High housing prices in particular have hindered our ability to attract and retain skilled technicians from across the U.S.
- Expectation of lower interest rates is driving most of the behavior currently.
- Our issues include new employees passing drug tests. Hiring quality employees is becoming more and more difficult.
- For more than 20 years we have seen the market soften in October of a federal election year. It has not proven to be outcome-dependent, but it forces an earlier slowdown than is typical in the fourth quarter, which is already soft due to the impacts of the holidays.
- Interest rates going down could spark a lot of home purchases. In general, that would help us, as more of our clients want to sell property than buy. The uncertainty is up because we do not know if that will happen.
- Demographic shifts and international issues are starting to impact college enrollment in Texas. We had been immune to these in the last few years, but we’re now feeling the effects.
- We feel strongly that inflationary pressures are moving in the right direction, and the employment picture seems to be more favorable to a full-employment scenario.
- The cost of services has increased specifically in the area of electric utility charges, which have increased 100 percent over the past contract period. The company outlook has worsened based on the challenge to our nonprofit status by the county.
- The number of employees going back to school/college lessened our hours for those employees, and part-time employee hours increased as a result.
- We are in a very unclear moment in terms of the economy and where consumers’ minds are. There is still a perception of high prices, but it looks like inflation may be easing. It may level out if the Fed reduces interest rates and more economic data show we are back in the 2-3 percent range for inflation.
- The two biggest policy factors that worry us are immigration demagoguery choking off the much-needed labor supply and tariffs fouling up our smooth and cost-efficient supply chain from Korea.
- In our multifamily property management business, we are finding greater success working with lenders. As high interest rates continue to catch up to borrowers with floating-rate debt, lenders are being forced to step in and take control, either through foreclosure or accepting deeds in lieu of. They seem to be increasingly accepting the fact that they will have to support assets financially for the next year or so until the market catches up enough for them to unload the collateral at a price that keeps them mostly whole. Rate cuts aren't going to save them at this point (unless the cuts are huge), but rate cuts will help the cycle begin anew.
- Lower permanent mortgage rates are one precursor to improved commercial real estate activity.
- Our business is weather dependent. Summer was milder, so revenue decreased.
- The new judicial reform in Mexico has increased the level of uncertainty for all companies doing business on both sides of the border. Our legal team in Mexico City suggested caution in relation to future investment.
- Houston port strikes are a week away, adding to the uncertainty. The trucking industry is still in the throes of a recession due to excess trucking capacity in the market. Many, if not most, carriers are running at cost.
- The rate cut had a calming impact in the medium term. That's balanced by the impending strike at container ports, which we believe will have an outsized impact on economic conditions over the next several months.
- The interest rate environment may change and would benefit financial institutions, but regulation continues to increase substantially. The election could change the current administration’s approach to regulation depending on which party wins it. Excessive regulations have been an extreme burden for the banking industry with the greatest impact to community banks.
- Commercial real estate financing related to investment sales remains very low. However, there are expectations the cost of debt capital will go down following an anticipated reduction in short-term interest rates.
- The recent Fed reduction in interest rates has improved business confidence and outlook.
- Capital cost is prohibitive for business growth.
- We think once the presidential election is behind us and current insured property losses are lower than last year, the economy should improve. We are having more qualified candidates for hire coming into focus for us lately.
- We are very worried about our labor situation and business environment in the long term.
- We are only selling single-piece, unplanned purchases with extreme price pressure. Positive cash flow is not sustainable at this time.
- Affordability remains low. The interest rate drop will make little difference in the near term. The cost of doing business is increasing as margins decline. Year-over-year profit is down 20 percent.
- Retail traffic has slowed down noticeably in the last couple of months.
- The Fed decreasing rates will be well received. That said, we have been a big fan of raising rates. Money has been too cheap, and it finally caught up in the form of inflation.
- The energy industry continues to see more and more mergers and acquisitions, which will impact our community. With all that said, we believe as rates drop, energy activity and home sales will increase.
Historical Data
Historical data can be downloaded dating back to January 2007.
Indexes
Download indexes for all indicators. For the definitions of all variables, see data definitions.
Texas Service Sector Outlook Survey |
Texas Retail Outlook Survey |
| Unadjusted | Unadjusted |
| Seasonally adjusted | Seasonally adjusted |
All Data
Download indexes and components of the indexes (percentage of respondents reporting increase, decrease, or no change). For the definitions of all variables, see data definitions.
Texas Service Sector Outlook Survey |
Texas Retail Outlook Survey |
| Unadjusted | Unadjusted |
| Seasonally adjusted | Seasonally adjusted |
Questions regarding the Texas Service Sector Outlook Survey can be addressed to Jesus Cañas at jesus.canas@dal.frb.org.
Sign up for our email alert to be automatically notified as soon as the latest Texas Service Sector Outlook Survey is released on the web.
