
Texas Service Sector Outlook Survey
Texas service sector activity growth continues, outlook improves
For this month’s survey, Texas business executives were asked supplemental questions on credit conditions. Results for these questions from the Texas Manufacturing Outlook Survey, Texas Service Sector Outlook Survey and Texas Retail Outlook Survey have been released together. Read the special questions results.
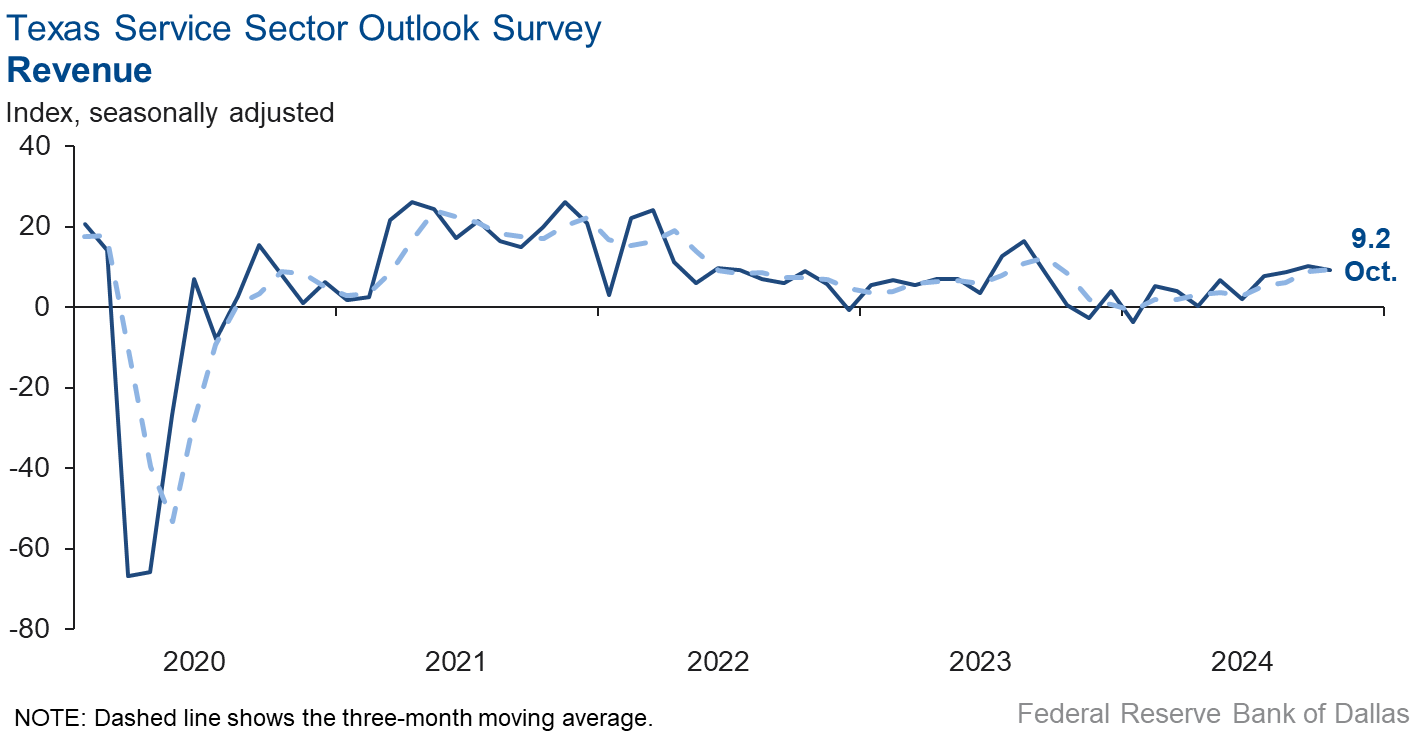
Texas service sector activity expanded at about the same pace in October as the prior month, according to business executives responding to the Texas Service Sector Outlook Survey. The revenue index, a key measure of state service sector conditions, was little changed at 9.2.
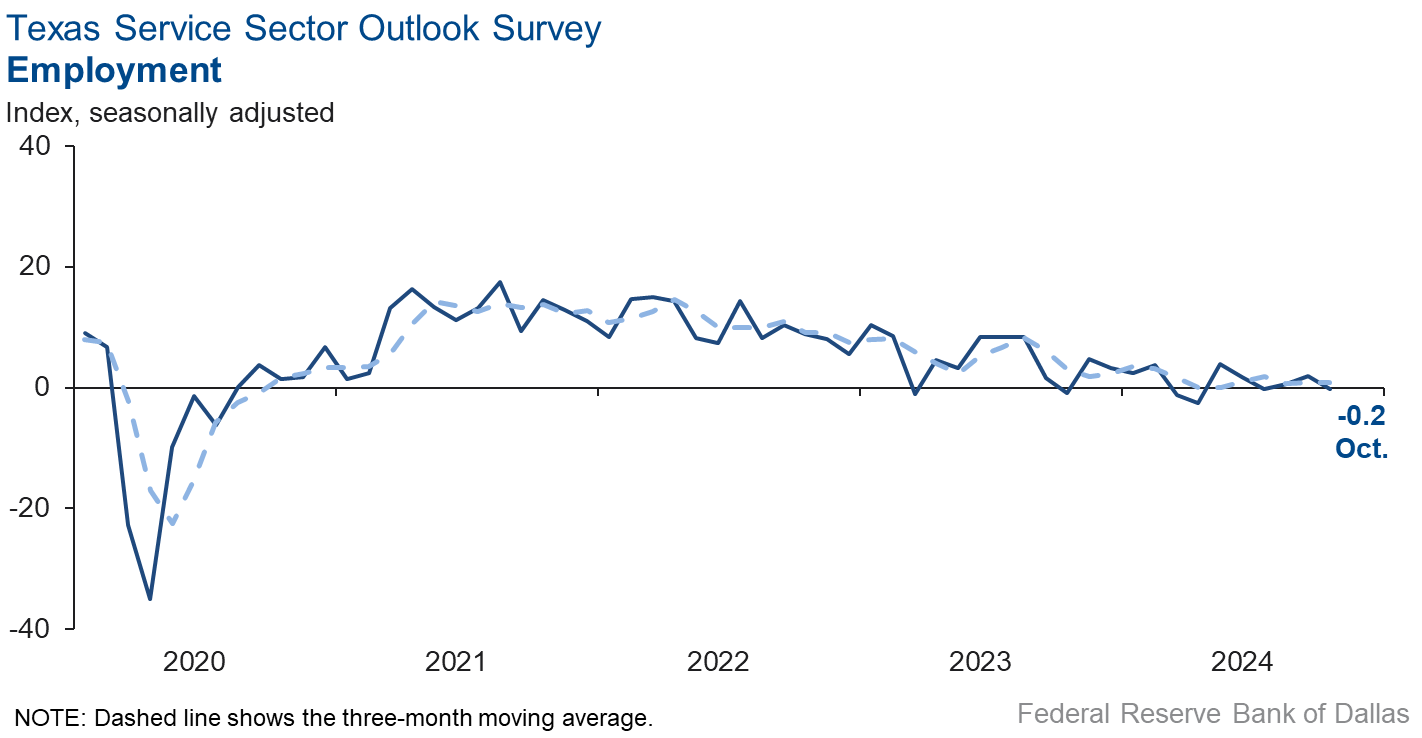
Labor market measures suggested no growth in employment in October but slight improvement in hours worked. The employment index came in at -0.2, with the near-zero reading signaling flat employment in October. The part-time employment index fell to -2.0. The hours-worked index increased to 2.5.
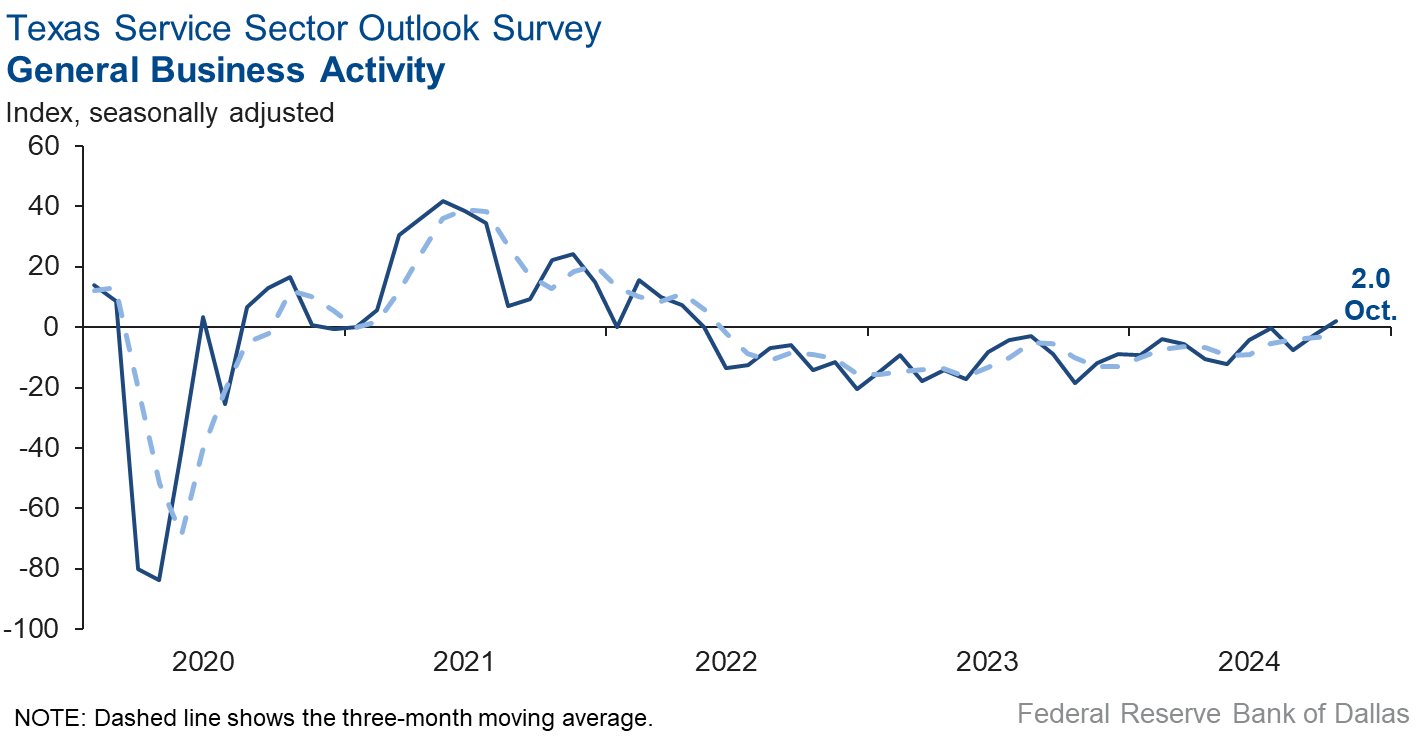
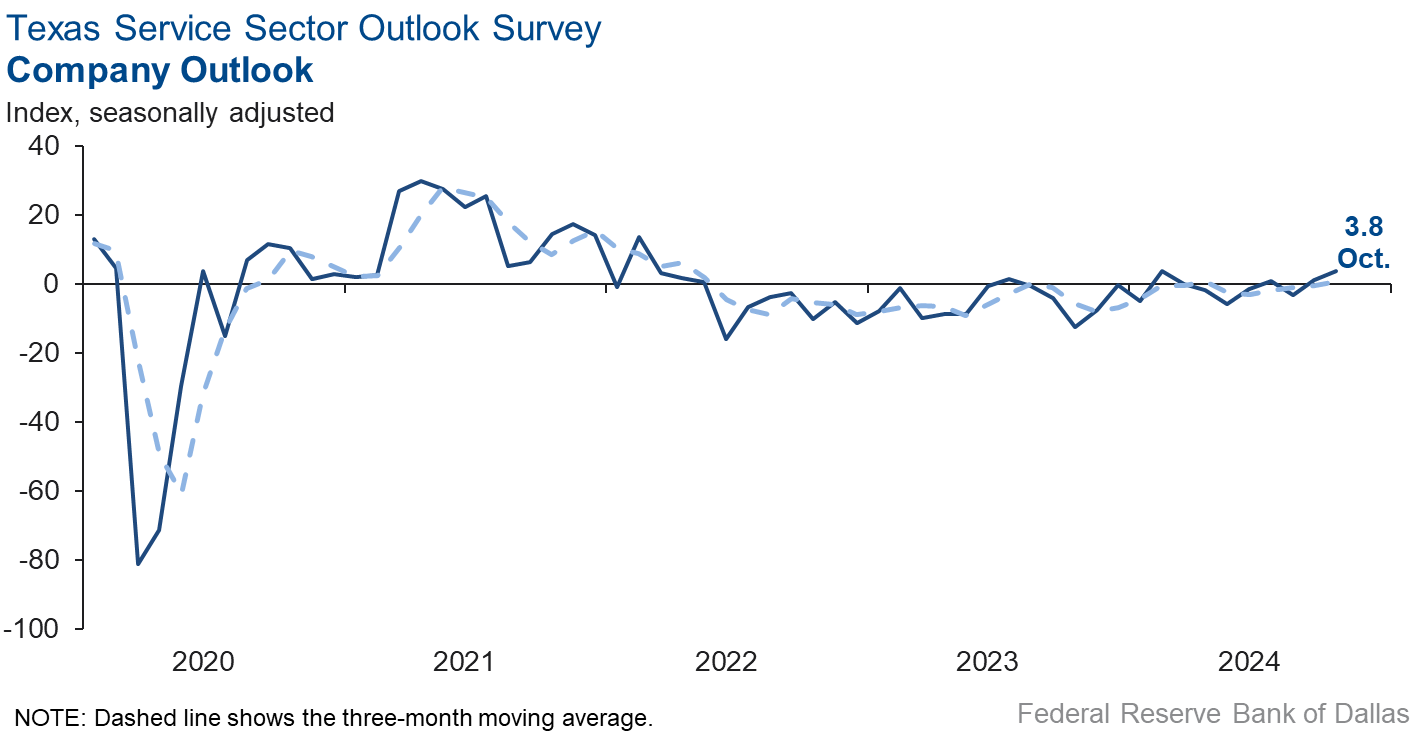
Perceptions of broader business conditions improved in October. The general business activity index increased five points to 2.0, its first positive reading in more than two years. The company outlook index increased three points to 3.8. Nevertheless, the outlook uncertainty index increased nine points to 17.9.
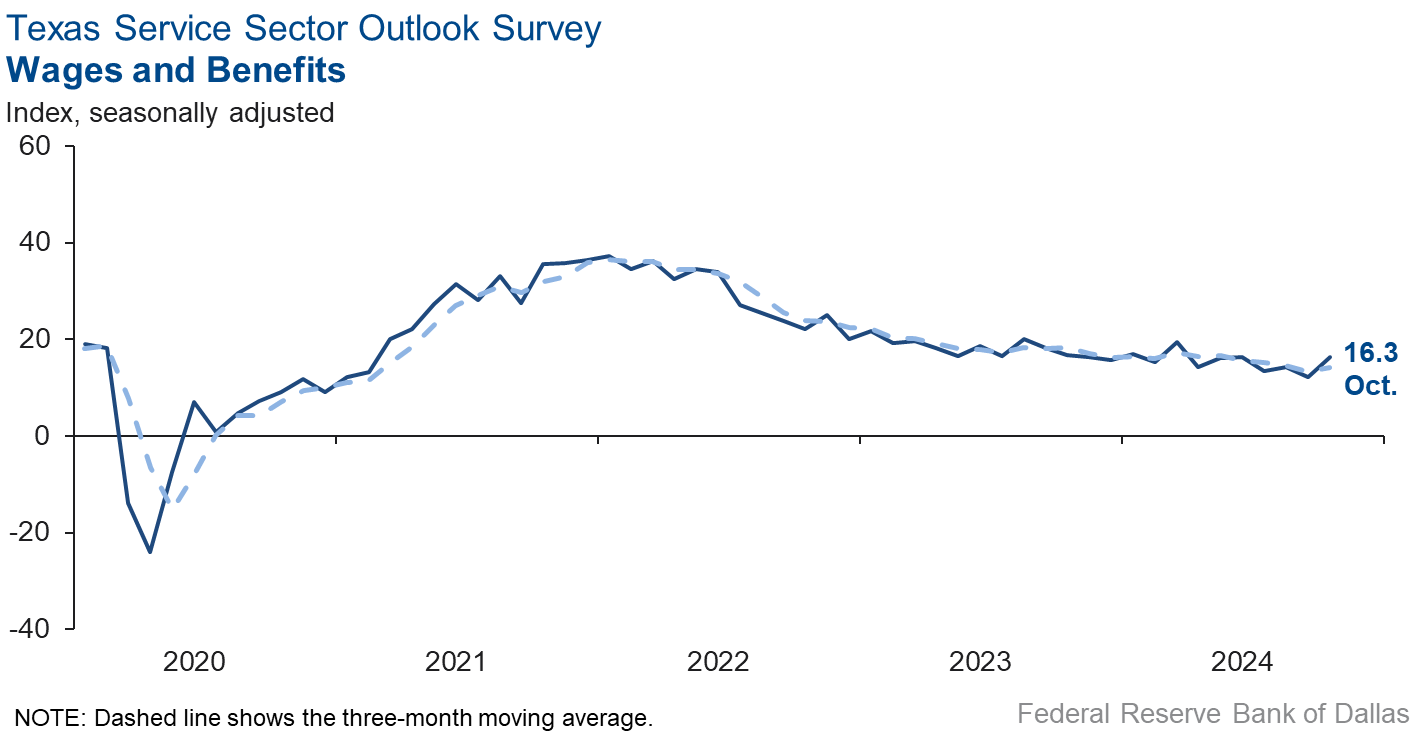
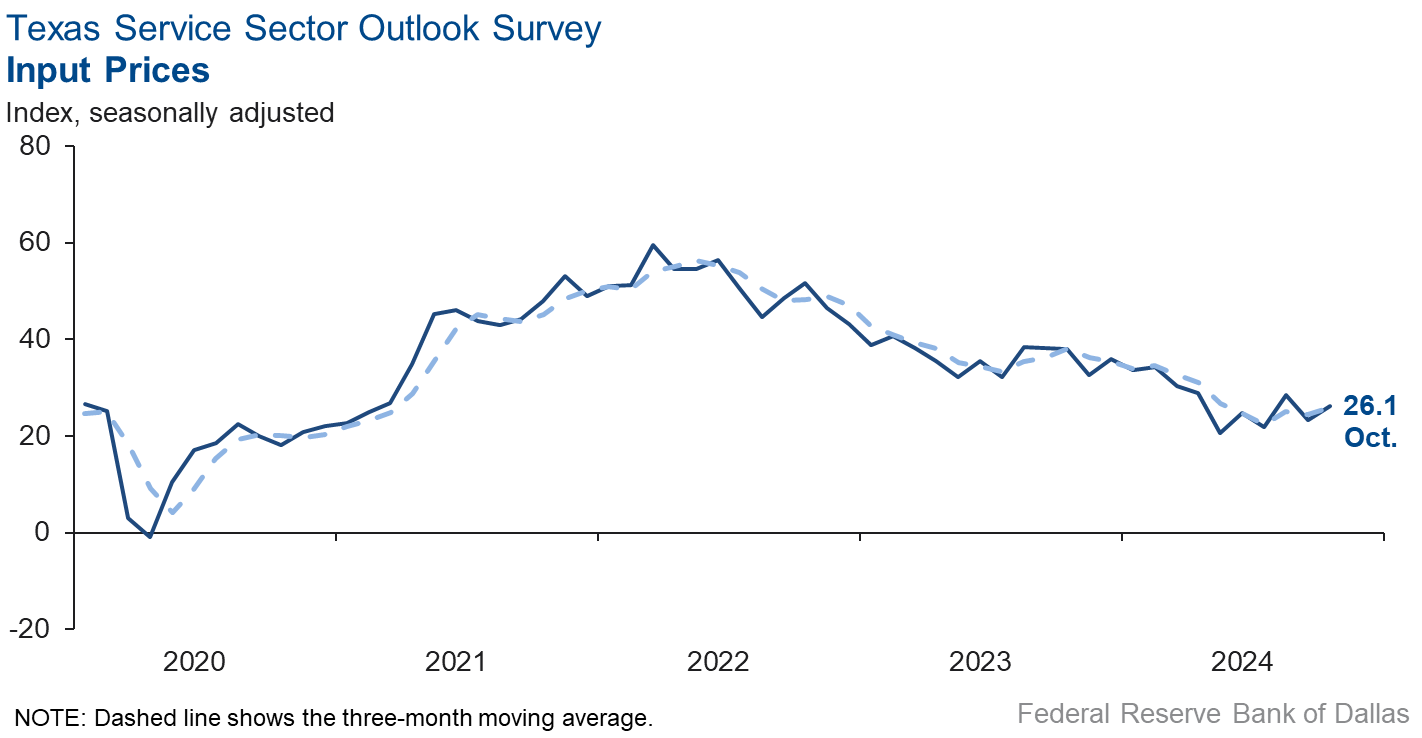
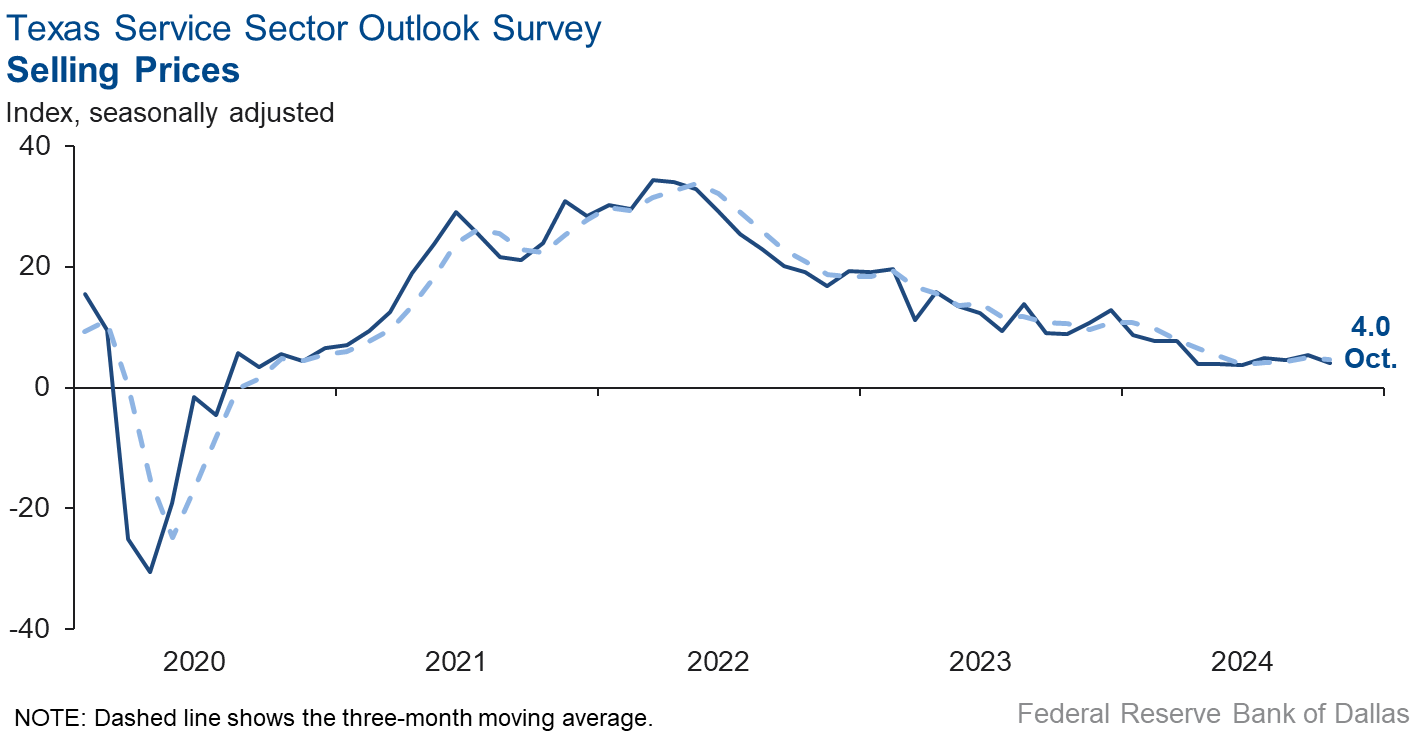
Wage and input price pressures increased, while selling price pressures held steady in October. The input price index increased three points to 26.1 and the selling price index was little changed at 4.0. The wages and benefits index increased four points to 16.3.
Respondents’ expectations regarding future business activity reflected improved optimism in October. The future general business activity index jumped nine points to 25.3, while the future revenue index increased five points to 40.1. Other future service-sector activity indexes such as employment and capital expenditures remained in positive territory and increased, reflecting expectations for continued growth in the next six months.
Texas Retail Outlook Survey
Texas retail sales fall again
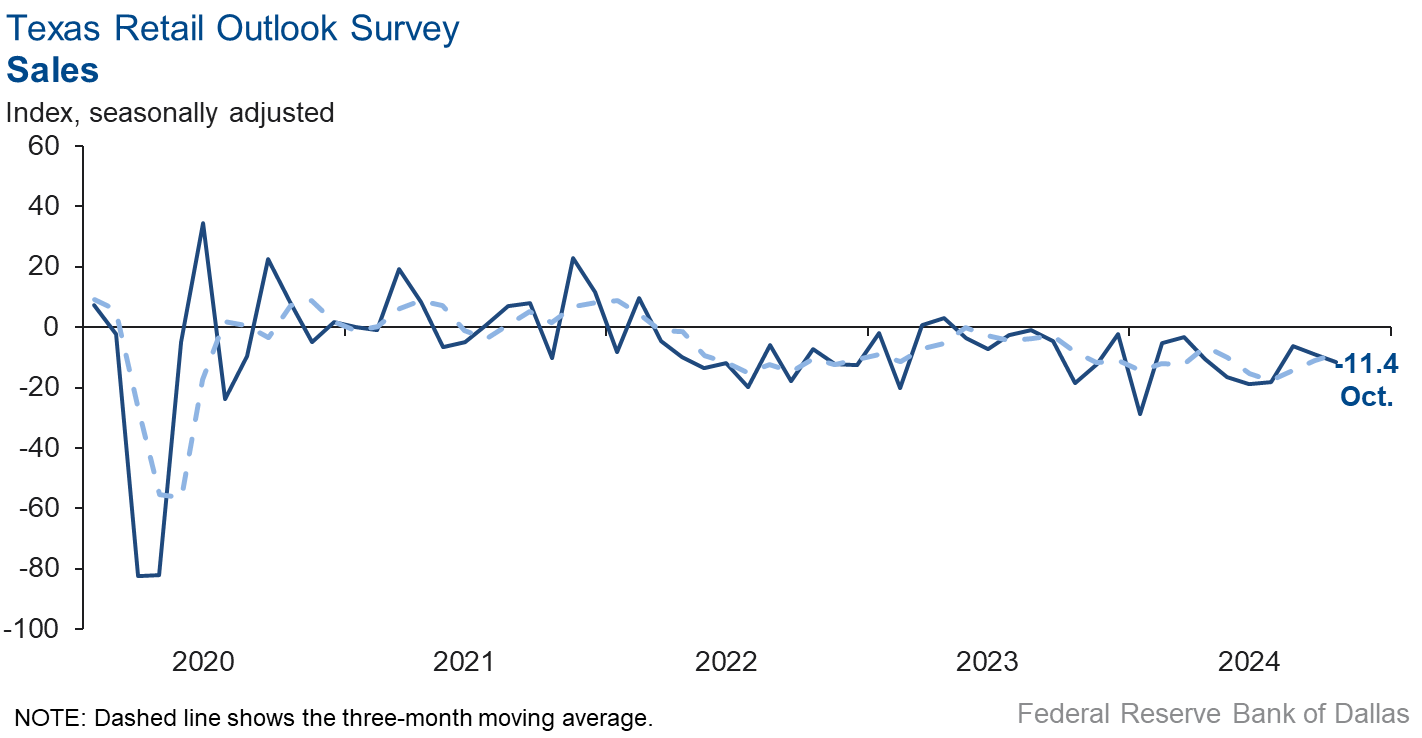
Retail sales activity declined in October, according to business executives responding to the Texas Retail Outlook Survey. The sales index, a key measure of state retail activity, fell three points to -11.4. Retailers’ inventories grew over the month, with the October index increasing to 7.6.
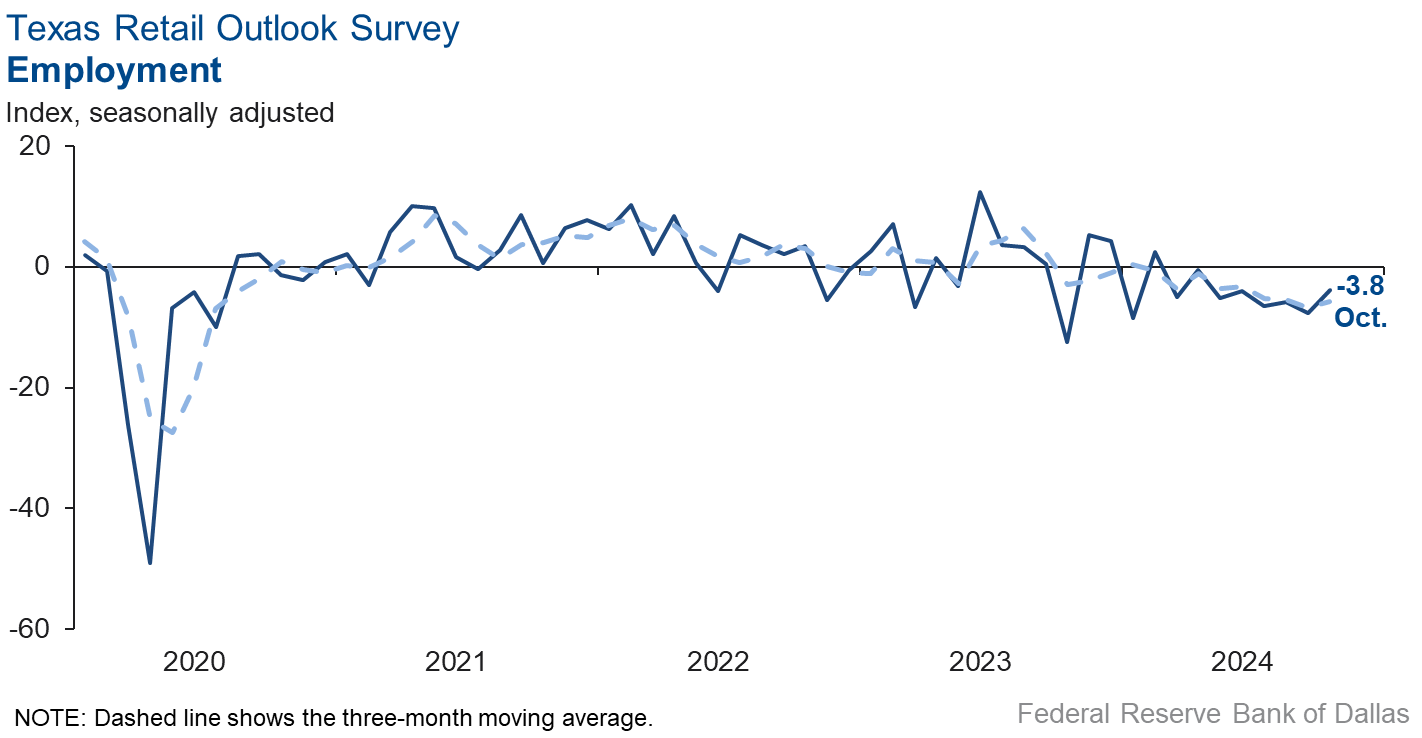
Retail labor market indicators suggested contraction in employment and flat workweeks this month. The employment index remained in negative territory but increased four points to -3.8, while the part-time employment index increased to -2.7. The hours-worked index came in at 1.0, with the near-zero reading signaling little change in work hours from October.
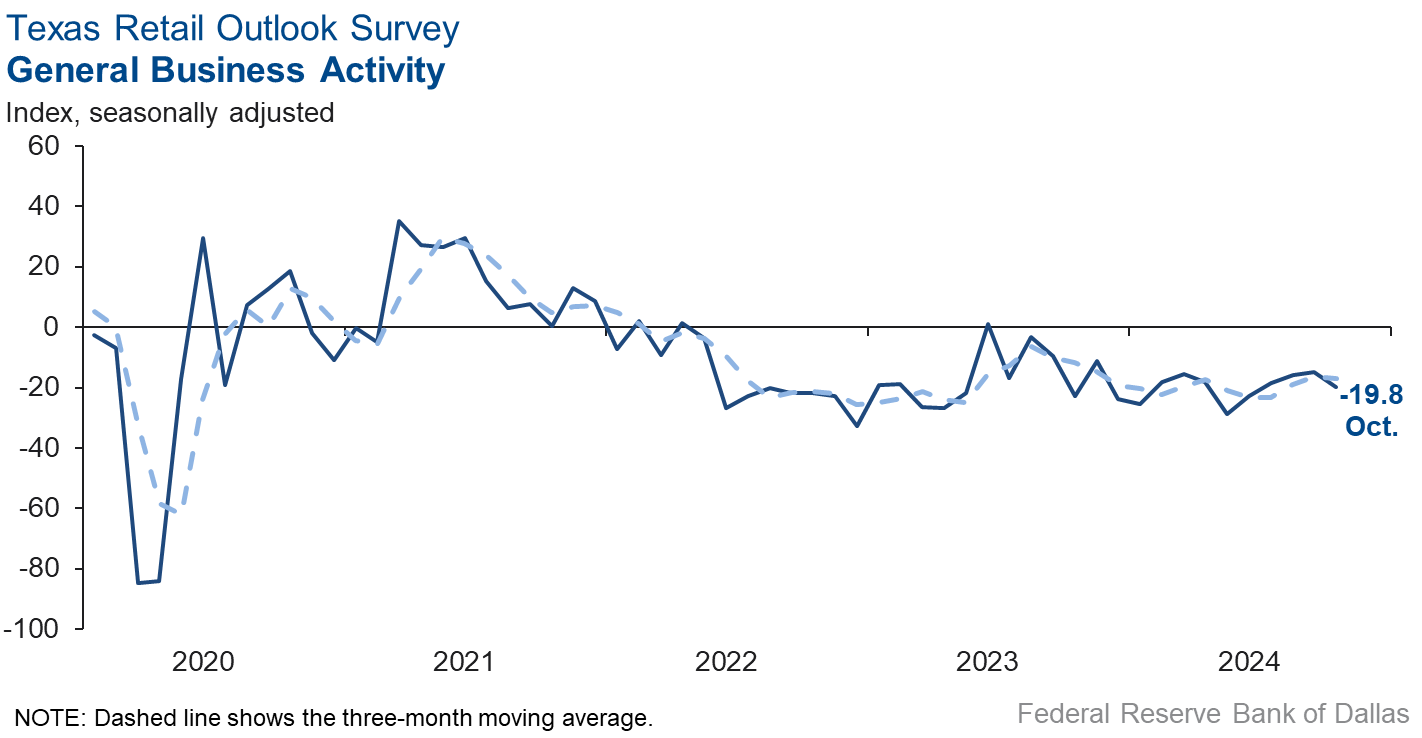
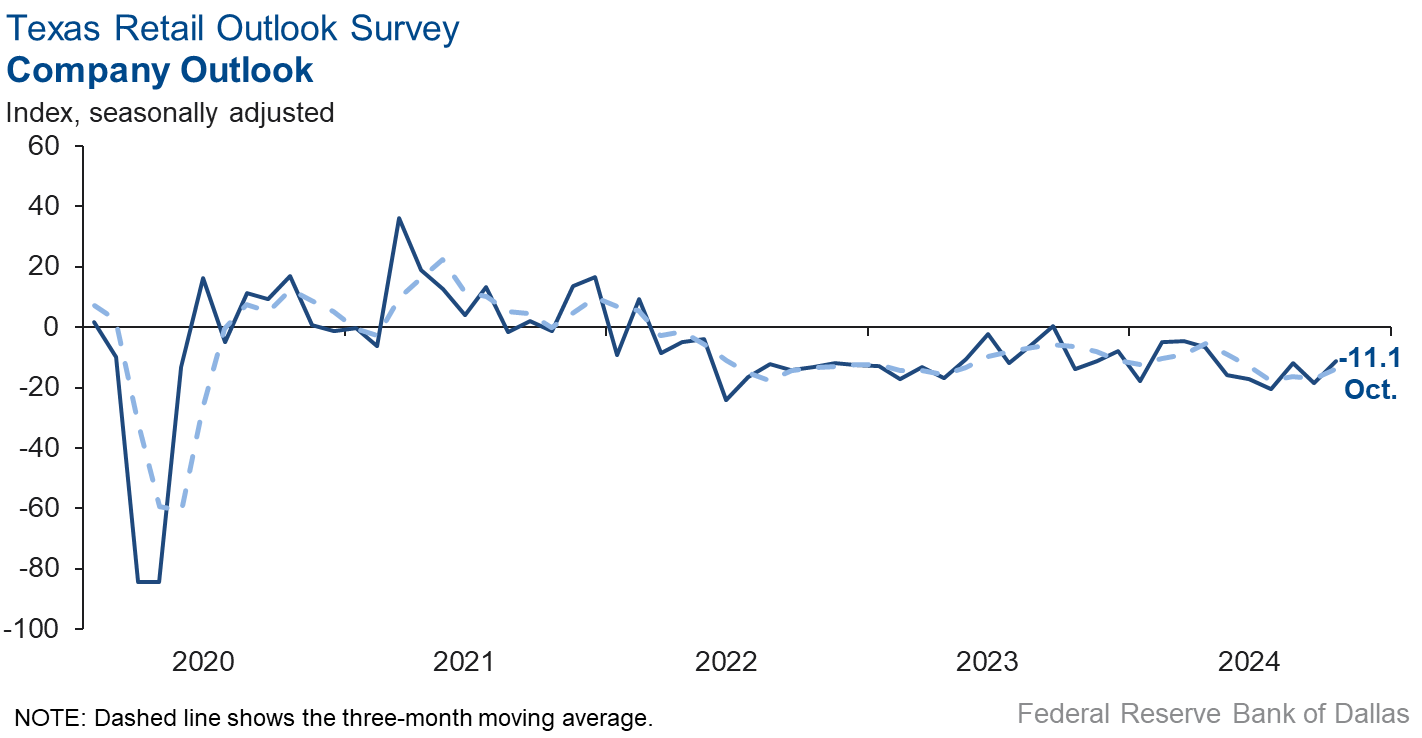
Retailers continued to perceive a worsening of broader business conditions in October. The general business activity index fell five points to -19.8. The company outlook index remained in negative territory but increased to -11.1. Uncertainty in outlooks rose.
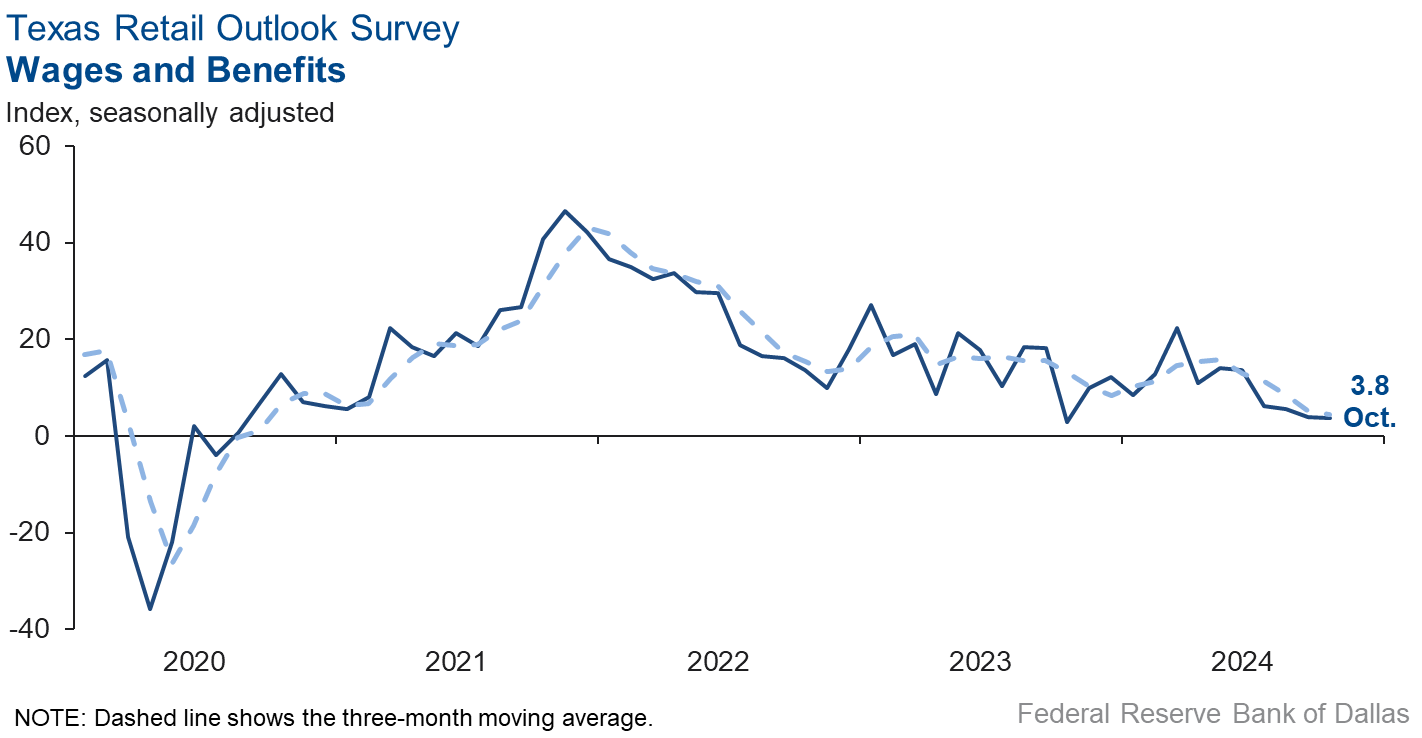
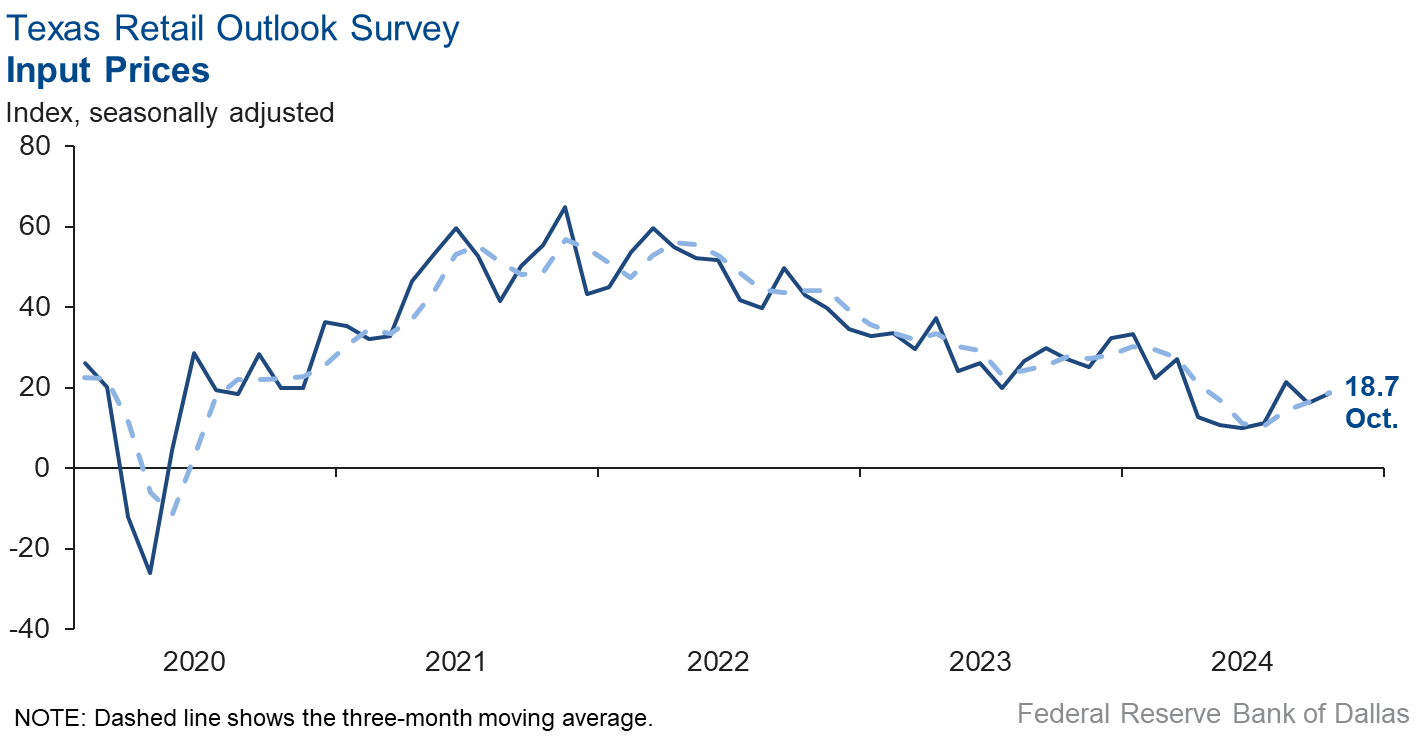
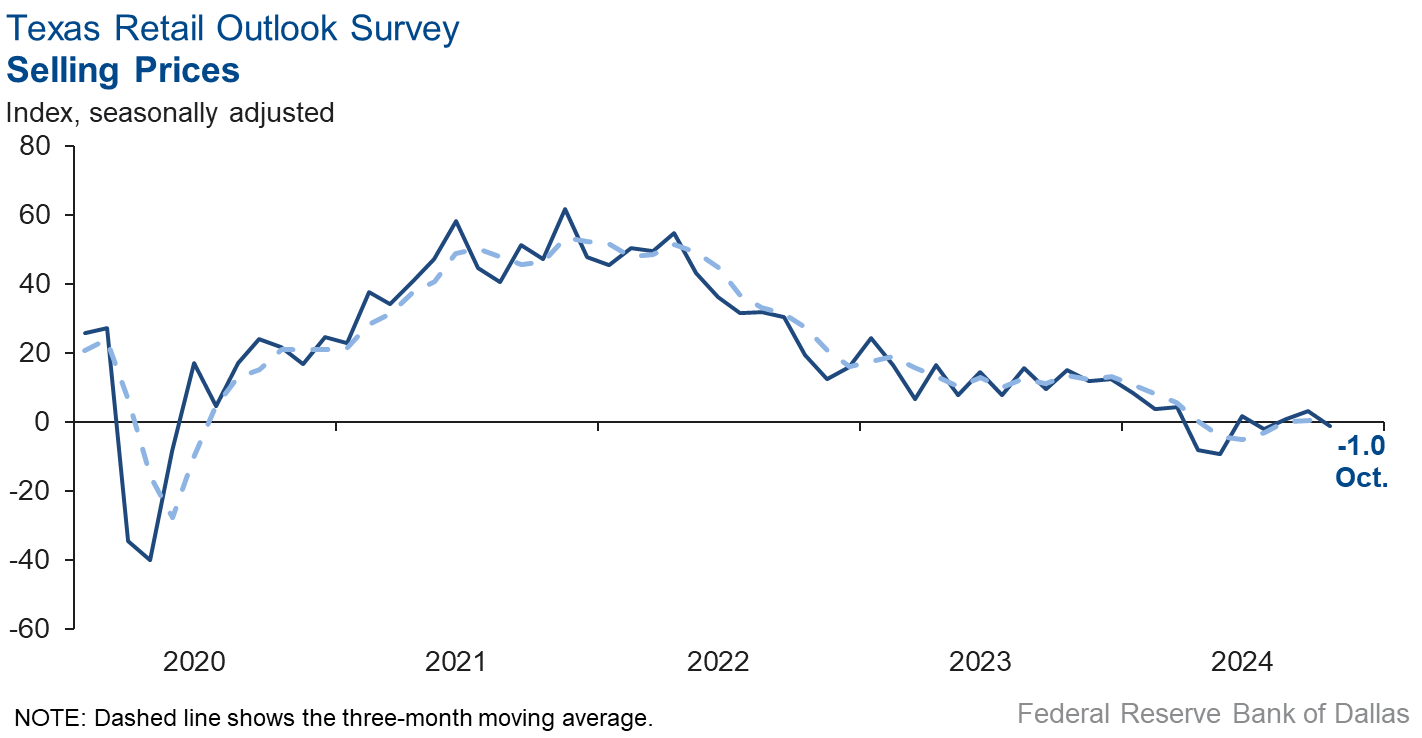
Selling prices stabilized in October, while input price growth increased slightly, and wage pressures held steady from the prior month. The selling price index fell four points to -1.0, with the near-zero reading signaling no change in prices from October. The input price index increased two points to 18.7. The wages and benefits index was essentially unchanged at 3.8.
Expectations for future business conditions improved in October. The future general business activity index jumped to 25.7, and the future sales index increased nine points to 24.8. Both the future employment index and the future capital expenditures index turned positive this month, reflecting expectations for growth in the next six months.
Next release: November 26, 2024
October 15–23, and 265 of the 401 Texas service sector business executives surveyed submitted responses. The Dallas Fed conducts the Texas Service Sector Outlook Survey monthly to obtain a timely assessment of the state’s service sector activity. Firms are asked whether revenue, employment, prices, general business activity and other indicators increased, decreased or remained unchanged over the previous month.
Survey responses are used to calculate an index for each indicator. Each index is calculated by subtracting the percentage of respondents reporting a decrease from the percentage reporting an increase. When the share of firms reporting an increase exceeds the share reporting a decrease, the index will be greater than zero, suggesting the indicator has increased over the prior month. If the share of firms reporting a decrease exceeds the share reporting an increase, the index will be below zero, suggesting the indicator has decreased over the prior month. An index will be zero when the number of firms reporting an increase is equal to the number of firms reporting a decrease.
Data have been seasonally adjusted as necessary.
Texas Service Sector Outlook Survey
Historical data are available from January 2007 to the most current release month.
| Business Indicators Relating to Facilities and Products in Texas Current (versus previous month) | ||||||||
| Indicator | Oct Index | Sep Index | Change | Series Average | Trend* | % Reporting Increase | % Reporting No Change | % Reporting Decrease |
Revenue | 9.2 | 10.1 | –0.9 | 10.6 | 9(+) | 28.0 | 53.2 | 18.8 |
Employment | –0.2 | 2.0 | –2.2 | 6.2 | 1(–) | 10.9 | 78.0 | 11.1 |
Part–Time Employment | –2.0 | –0.4 | –1.6 | 1.3 | 6(–) | 3.8 | 90.4 | 5.8 |
Hours Worked | 2.5 | –0.8 | +3.3 | 2.6 | 1(+) | 7.1 | 88.3 | 4.6 |
Wages and Benefits | 16.3 | 12.3 | +4.0 | 15.8 | 53(+) | 19.1 | 78.1 | 2.8 |
Input Prices | 26.1 | 23.3 | +2.8 | 27.9 | 54(+) | 31.3 | 63.5 | 5.2 |
Selling Prices | 4.0 | 5.4 | –1.4 | 7.6 | 51(+) | 16.0 | 72.0 | 12.0 |
Capital Expenditures | 9.2 | 7.6 | +1.6 | 9.9 | 51(+) | 15.1 | 79.0 | 5.9 |
| General Business Conditions Current (versus previous month) | ||||||||
| Indicator | Oct Index | Sep Index | Change | Series Average | Trend** | % Reporting Improved | % Reporting No Change | % Reporting Worsened |
Company Outlook | 3.8 | 1.2 | +2.6 | 4.3 | 2(+) | 14.4 | 75.0 | 10.6 |
General Business Activity | 2.0 | –2.6 | +4.6 | 2.2 | 1(+) | 15.6 | 70.8 | 13.6 |
| Indicator | Oct Index | Sep Index | Change | Series Average | Trend* | % Reporting Increase | % Reporting No Change | % Reporting Decrease |
Outlook Uncertainty | 17.9 | 9.4 | +8.5 | 13.4 | 41(+) | 23.3 | 71.3 | 5.4 |
| Business Indicators Relating to Facilities and Products in Texas Future (six months ahead) | ||||||||
| Indicator | Oct Index | Sep Index | Change | Series Average | Trend* | % Reporting Increase | % Reporting No Change | % Reporting Decrease |
Revenue | 40.1 | 35.1 | +5.0 | 37.3 | 54(+) | 52.2 | 35.7 | 12.1 |
Employment | 23.6 | 16.0 | +7.6 | 23.0 | 54(+) | 30.5 | 62.5 | 6.9 |
Part–Time Employment | 5.6 | 0.9 | +4.7 | 6.6 | 5(+) | 9.7 | 86.2 | 4.1 |
Hours Worked | 6.2 | 6.6 | –0.4 | 5.8 | 54(+) | 10.0 | 86.2 | 3.8 |
Wages and Benefits | 45.9 | 37.1 | +8.8 | 37.4 | 54(+) | 47.2 | 51.5 | 1.3 |
Input Prices | 43.9 | 32.9 | +11.0 | 44.4 | 214(+) | 51.0 | 42.0 | 7.1 |
Selling Prices | 26.2 | 14.6 | +11.6 | 24.5 | 54(+) | 35.4 | 55.4 | 9.2 |
Capital Expenditures | 22.5 | 13.8 | +8.7 | 22.8 | 53(+) | 28.0 | 66.6 | 5.5 |
| General Business Conditions Future (six months ahead) | ||||||||
| Indicator | Oct Index | Sep Index | Change | Series Average | Trend** | % Reporting Improved | % Reporting No Change | % Reporting Worsened |
Company Outlook | 25.7 | 17.4 | +8.3 | 15.5 | 12(+) | 34.8 | 56.1 | 9.1 |
General Business Activity | 25.3 | 16.0 | +9.3 | 12.0 | 6(+) | 33.9 | 57.5 | 8.6 |
Historical data are available from January 2007 to the most current release month.
| Business Indicators Relating to Facilities and Products in Texas Retail (versus previous month) | ||||||||
| Indicator | Oct Index | Sep Index | Change | Series Average | Trend* | % Reporting Increase | % Reporting No Change | % Reporting Decrease |
| Retail Activity in Texas | ||||||||
Sales | –11.4 | –8.9 | –2.5 | 3.2 | 18(–) | 22.0 | 44.7 | 33.4 |
Employment | –3.8 | –7.7 | +3.9 | 1.6 | 8(–) | 8.4 | 79.4 | 12.2 |
Part–Time Employment | –2.7 | –5.0 | +2.3 | –1.6 | 3(–) | 4.2 | 88.9 | 6.9 |
Hours Worked | 1.0 | –9.9 | +10.9 | –2.3 | 1(+) | 5.6 | 89.8 | 4.6 |
Wages and Benefits | 3.8 | 3.9 | –0.1 | 11.2 | 51(+) | 7.0 | 89.8 | 3.2 |
Input Prices | 18.7 | 16.3 | +2.4 | 22.5 | 54(+) | 28.9 | 60.9 | 10.2 |
Selling Prices | –1.0 | 3.1 | –4.1 | 13.2 | 1(–) | 23.6 | 51.8 | 24.6 |
Capital Expenditures | –1.1 | 7.5 | –8.6 | 7.6 | 1(–) | 10.9 | 77.1 | 12.0 |
Inventories | 7.6 | 0.6 | +7.0 | 2.7 | 3(+) | 30.4 | 46.8 | 22.8 |
| Companywide Retail Activity | ||||||||
Companywide Sales | –9.4 | –6.8 | –2.6 | 4.4 | 7(–) | 20.7 | 49.2 | 30.1 |
Companywide Internet Sales | –16.4 | –0.3 | –16.1 | 3.8 | 3(–) | 9.5 | 64.6 | 25.9 |
| General Business Conditions, Retail Current (versus previous month) | ||||||||
| Indicator | Oct Index | Sep Index | Change | Series Average | Trend** | % Reporting Improved | % Reporting No Change | % Reporting Worsened |
Company Outlook | –11.1 | –18.5 | +7.4 | 1.4 | 13(–) | 5.9 | 77.1 | 17.0 |
General Business Activity | –19.8 | –14.9 | –4.9 | –2.7 | 16(–) | 10.6 | 59.0 | 30.4 |
| Outlook Uncertainty Current (versus previous month) | ||||||||
| Indicator | Oct Index | Sep Index | Change | Series Average | Trend* | % Reporting Increase | % Reporting No Change | % Reporting Decrease |
Outlook Uncertainty | 27.1 | 18.2 | +8.9 | 11.3 | 3(+) | 31.3 | 64.6 | 4.2 |
| Business Indicators Relating to Facilities and Products in Texas, Retail Future (six months ahead) | ||||||||
| Indicator | Oct Index | Sep Index | Change | Series Average | Trend* | % Reporting Increase | % Reporting No Change | % Reporting Decrease |
| Retail Activity in Texas | ||||||||
Sales | 24.8 | 15.8 | +9.0 | 30.3 | 17(+) | 37.8 | 49.2 | 13.0 |
Employment | 7.1 | –6.7 | +13.8 | 12.6 | 1(+) | 13.2 | 80.7 | 6.1 |
Part–Time Employment | 1.0 | –7.5 | +8.5 | 1.5 | 1(+) | 4.1 | 92.8 | 3.1 |
Hours Worked | 5.0 | –2.6 | +7.6 | 2.4 | 1(+) | 6.6 | 91.8 | 1.6 |
Wages and Benefits | 24.1 | 20.4 | +3.7 | 29.0 | 54(+) | 25.4 | 73.3 | 1.3 |
Input Prices | 40.0 | 24.5 | +15.5 | 33.8 | 54(+) | 48.9 | 42.2 | 8.9 |
Selling Prices | 28.9 | 3.8 | +25.1 | 28.6 | 54(+) | 42.2 | 44.4 | 13.3 |
Capital Expenditures | 11.2 | –0.2 | +11.4 | 16.6 | 1(+) | 22.7 | 65.9 | 11.5 |
Inventories | 17.0 | 12.3 | +4.7 | 10.8 | 12(+) | 28.5 | 60.0 | 11.5 |
| Companywide Retail Activity | ||||||||
Companywide Sales | 29.3 | 5.8 | +23.5 | 28.8 | 17(+) | 36.9 | 55.5 | 7.6 |
Companywide Internet Sales | 21.0 | 2.5 | +18.5 | 21.0 | 9(+) | 28.9 | 63.2 | 7.9 |
| General Business Conditions, Retail Future (six months ahead) | ||||||||
| Indicator | Oct Index | Sep Index | Change | Series Average | Trend** | % Reporting Improved | % Reporting No Change | % Reporting Worsened |
Company Outlook | 25.6 | –6.3 | +31.9 | 14.9 | 1(+) | 32.2 | 61.2 | 6.6 |
General Business Activity | 25.7 | –1.8 | +27.5 | 10.3 | 1(+) | 34.4 | 56.9 | 8.7 |
*Shown is the number of consecutive months of expansion or contraction in the underlying indicator. Expansion is indicated by a positive index reading and denoted by a (+) in the table. Contraction is indicated by a negative index reading and denoted by a (–) in the table.
**Shown is the number of consecutive months of improvement or worsening in the underlying indicator. Improvement is indicated by a positive index reading and denoted by a (+) in the table. Worsening is indicated by a negative index reading and denoted by a (–) in the table.
Data have been seasonally adjusted as necessary.
Texas Service Sector Outlook Survey
Texas Retail Outlook Survey
Texas Service Sector Outlook Survey
Comments from survey respondents
These comments are from respondents’ completed surveys and have been edited for publication.
- We feel that the pace of general business has increased on the positive side.
- It’s very hard to tell if the delays in starting new projects are due to unease about the election and any disruptions in its aftermath–meaning things will go back to normal once the dust settles–or whether there is something more systemic going on that reflects a longer-term downturn in IT consulting demand.
- We saw a slight improvement in revenue. We are not sure it's sustainable.
- We are seeing many cyber scams and phishing attempts. Scammers are getting very clever, and it’s more difficult to identify.
- Post-U.S. election, the U.S. and global economies are likely to improve, per our global customer feedback.
- Still fair amount of uncertainty, especially regarding availability of capital (debt and equity) to upstream oil and gas industry. We do retained search as well as outsource recruiting for companies that have consistent needs over an extended period of time. October was a tough month. As was September, but October was worse. This year has been difficult in general. We know that companies want and need to hire, but they don't mind waiting for the right person to come along rather than using a proactive process that will save them a lot of time. We hope that after the elections, people will have an increased sense of stability and optimism.
- It is difficult to evaluate activity. We’re not sure if the hesitation about investment is because of the election, inflation or overbuilding of speculative industrial space.
- Our biggest limiting factor has been our ability to find good engineers. In the last couple of months, that seems to be getting easier. We have made some good movement in hiring.
- There is an increase in wire fraud, and we have hired a third-party company to help with this. This is an extra expense but one we feel is necessary to prevent theft. There is also an increase in identity fraud, specifically seller fraud. The change in labor laws has increased our employee expense as well.
- Business is slowing down noticeably.
- The election results or uncertainty around the results is making our clients hesitant to hire our company.
- The cost of labor in the food industry has forced the professional service industry to raise wages for entry-level workers to remain competitive. Meanwhile, high interest rates have caused many entities to slow delivery or stop construction and renovation projects, resulting in an overall slowing of business.
- There’s an overwhelming amount of time and money spent trying to stay in compliance with rules and regulations.
- The election is so close. Once that is behind us, we are very optimistic, regardless of the candidate at the top of the ticket that wins the election.
- Expectation of lower interest rates looks promising. Recent increases in 10- and 20-year treasuries are concerning.
- Corporate travel tends to slow down in our market during the fourth quarter of federal election cycles.
- Difficult to fill in the circle on revenue and employee projections for six months from now when we are still not through the election. We are cautiously optimistic, but we are not investing in additional technology or tools until we can determine where the dust settles economically post-election. There has been a slight uptick in hiring from our clients; however, the roles are one-off, difficult-to-fill roles that require unique skill sets. We have not seen an uptick in hiring for professional mainstream roles in accounting, finance, HR, marketing or administrative capacities. Candidates are still receiving multiple offers because there is still a shortage of strong, experienced candidates for professional positions.
- The political environment will remain highly uncertain until at least after the election, and possibly through January. This has some direct impact on our business.
- Our food cost continues to be high, especially for commodities like orange juice. Our outlook for the first quarter of 2025 is good but is being hurt by a renovation that will take out 60 rooms from our inventory beginning in early January.
- We think there is uncertainty about the presidential election.
- Blanket tariffs and mass deportations would be horrible for the Texas business community. We hope that professional economists will prevail over populists and keep the business conditions strong, regardless of who wins the general election.
- Hurricanes have impacted travel.
- Uncertainty may not have changed, but optimism has improved.
- We believe our outlook for the near and midterm remains pretty consistent. We do expect higher selling costs and costs to provide services, including the wages we pay, in the new year as inflation continues to put pressure on the business.
- Across 2024 we saw a slowdown in new business activity. We are hopeful that this turns around as optimism returns to the market. As a business-to-business company, we rely on the willingness and ability of companies to forward invest in new capabilities, which they have not and will not do in periods of economic uncertainty. We are still feeling the impacts of the rate environment and volatile consumer spending environment of the last 18 to 24 months. We are hopeful this will change, but we also believe that positive economic signals and appropriate Federal Reserve action are required in order to hasten the return of optimism.
- As buyers wait to make decisions until after the election and any post-election repercussions, the market feels very soft. As such, our decisions on hiring and investments are on hold.
- Not sure the rate decrease was warranted at this time. Inflation has not been cooled far enough to say it will not come back, forcing rates even much higher in the future. If this happens the Federal Reserve will most certainly cause a recession.
- We are beginning to see an increase in the number of loan inquiries from commercial property owners who have bank loans with balloon maturities that the banks have previously been willing to roll over but are now unwilling. Historically, banks have been willing to extend maturities once or twice if a balance for a loan underwritten in a much lower interest rate environment cannot be refinanced in a higher interest rate environment absent a material paydown in the loan balance. We are also beginning to see commercial real estate investment brokers presenting sales packages on behalf of banks for real estate owned property. Most long-term lenders have not materially reduced their quoted interest rates in the past three weeks.
- We see a decrease in our costs due to a drop in our funding costs.
- The geopolitical environment has created unstable economic conditions, making a forecast hard to predict. The best tactic at the moment is to squat and wait. Consumers are suffering from the high cost of food products and the price jump in insurance premiums.
- We have not seen any change in current market conditions from September to October. We remain hopeful that we will eventually be able to resume business once we have more rate cuts, which will help improve financing costs for new development.
- Ag sector income is up slightly. Retail sales are flat, tourism is down slightly.
- We’re seeing general slowdown as we approach the election. Probably normal.
- Demand remains stable. Reduction in the federal funds rate by 50 basis points has improved business outlook, confidence and profitability.
- It has been flat across the board.
- Buyers do not like uncertainty. Two wars going on is a concern for where to invest money.
- Folks are just grinding it out right now, not spending more than they have to, looking forward to additional rate decreases, hoping expectations don't have to be lowered any further, and anxious to see what our next president will do.
- Capital markets conditions are improving for real estate dealmaking, and we expect 2025 to be an improvement over 2024.
- We'll reassess next month after the election.
- People with money are still sitting on the sidelines. People without money are suffering.
- Presidential election will cause some concern.
- Trends are very concerning. Operating profits are down 20 percent. Gross revenue declined, and expenses are up significantly.
- Consumer traffic for higher cost products is decreasing. Our business is caught in the middle of inflated pricing, stubbornly high interest rates and high monthly payments.
- The election will bring change to the marketplace, no matter the outcome. If policies move toward a more protectionist bend (import tariffs), we could experience some blowback on our exports. If the dollar strengthens, we will see our customers trim their orders or order frequency. A weak dollar is good for our export business.
- Hiring new truck drivers is the biggest problem our company faces. Our employees are aging, and we are worried for the future because we can't find any qualified truck drivers. Part of the problem is the labor pool. One guy who applied had 20 jobs in 10 years. Also, it is competition with high oilfield salaries.
- Lack of business travel to downtowns and general low office occupancy continue to impact revenue. Cost of goods sold and labor costs remain high. Insurance and other operating costs are increasing. This is one of the toughest markets we have endured in 45 years of operations.
- The election is impacting the outlook for the remainder of this year and next.
- Although we are concerned about the outcome of U.S. elections, we are hopeful the swing either way will not create more uncertainly in the economy. Election and tax policy are going to be key in determining future plans.
Historical Data
Historical data can be downloaded dating back to January 2007.
Indexes
Download indexes for all indicators. For the definitions of all variables, see data definitions.
Texas Service Sector Outlook Survey |
Texas Retail Outlook Survey |
| Unadjusted | Unadjusted |
| Seasonally adjusted | Seasonally adjusted |
All Data
Download indexes and components of the indexes (percentage of respondents reporting increase, decrease, or no change). For the definitions of all variables, see data definitions.
Texas Service Sector Outlook Survey |
Texas Retail Outlook Survey |
| Unadjusted | Unadjusted |
| Seasonally adjusted | Seasonally adjusted |
Questions regarding the Texas Service Sector Outlook Survey can be addressed to Jesus Cañas at jesus.canas@dal.frb.org.
Sign up for our email alert to be automatically notified as soon as the latest Texas Service Sector Outlook Survey is released on the web.
