
Texas Service Sector Outlook Survey
Texas service sector activity holds steady
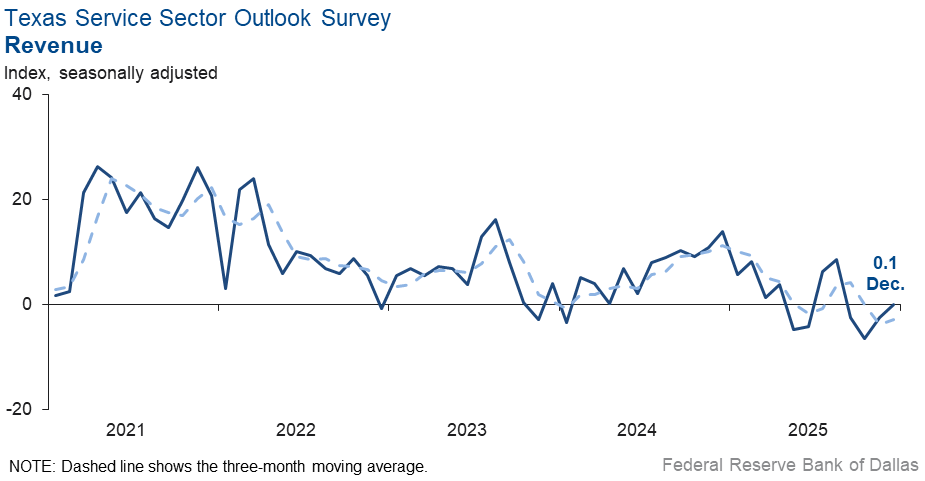
Texas service sector activity was unchanged in December, according to business executives responding to the Texas Service Sector Outlook Survey. The revenue index, a key measure of state service sector conditions, ticked up three points to zero.
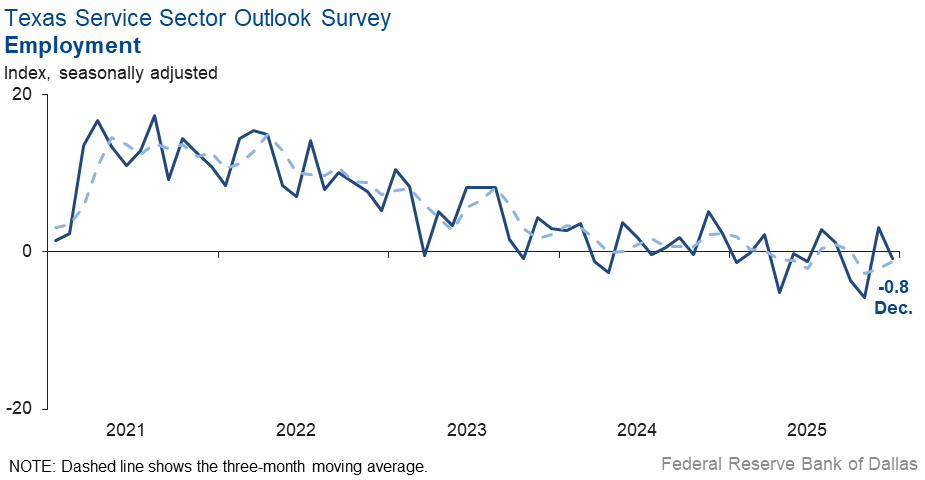
Labor market measures suggested little change in employment, though hours worked contracted this month. Both the employment and part-time employment indexes registered near-zero readings, suggesting little change in employment or part-time employment in December. Meanwhile, the hours worked index came in at -2.4.
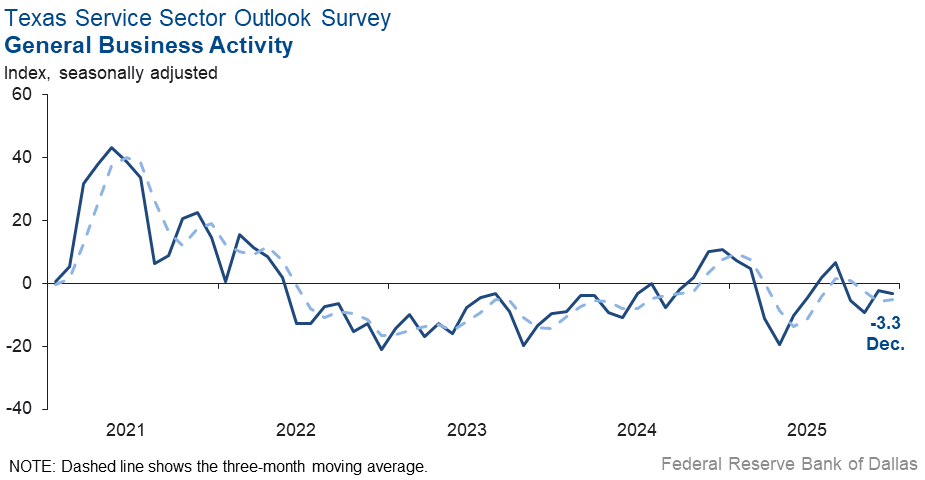
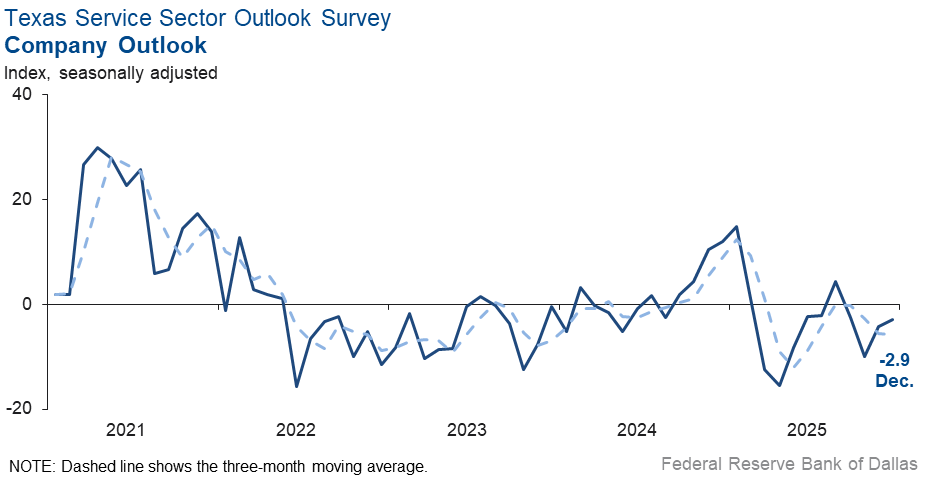
Perceptions of broader business conditions continued to worsen slightly. Both the general business activity index and the company outlook index remained negative, registering -3.3 and -2.9 respectively. The outlook uncertainty index ticked down two points to 15.9, though it still remained above the series average of 13.8.
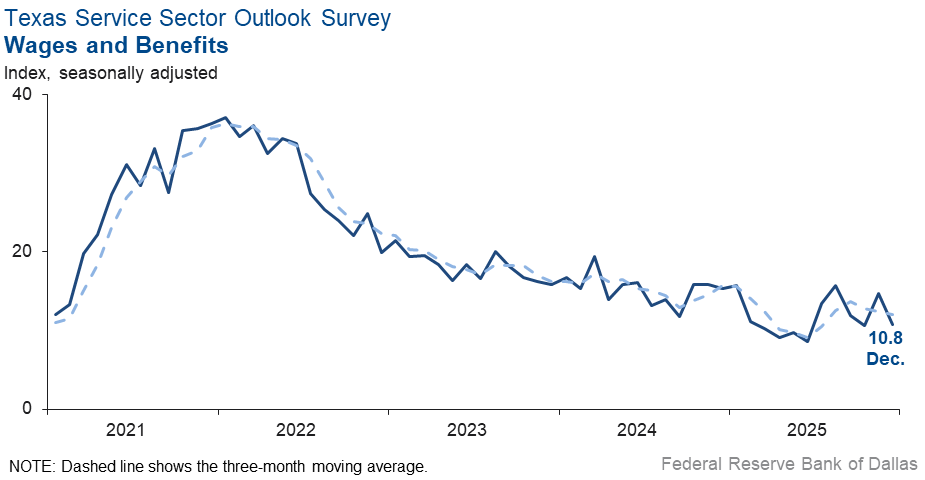
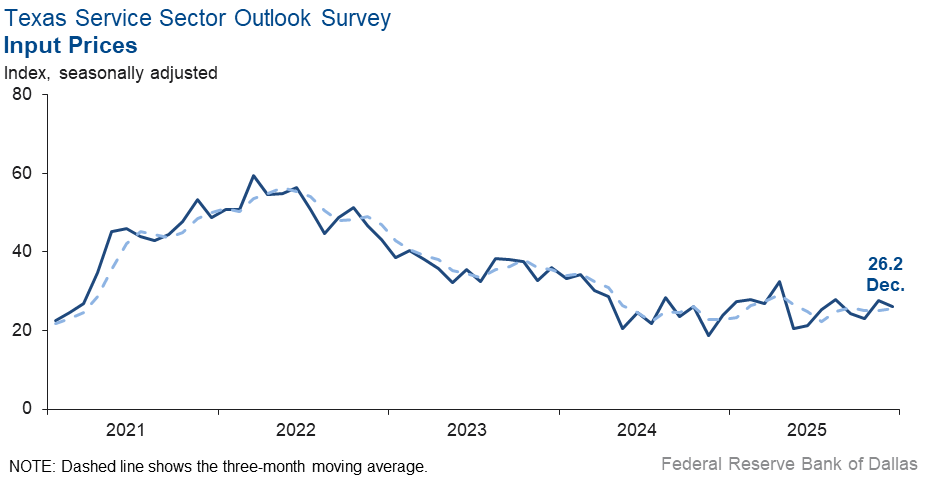
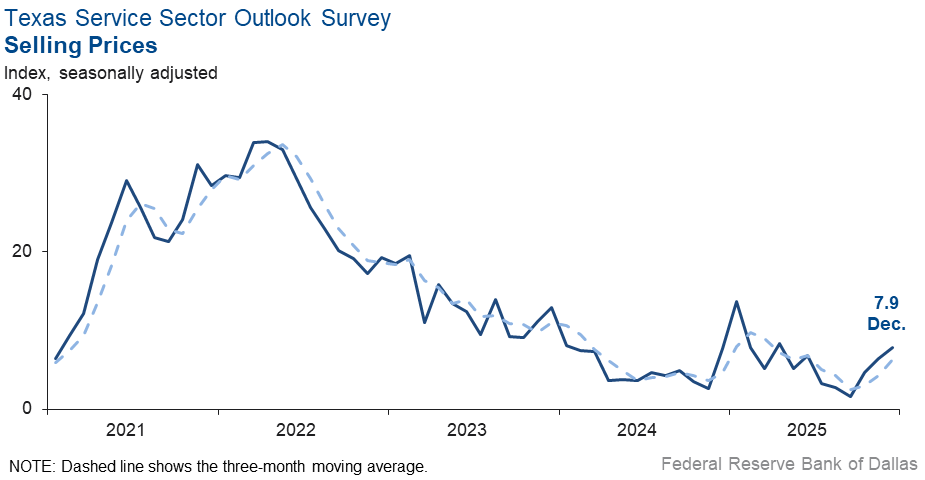
Prices and wages increased in December at about the same pace as in November. The input prices index was little changed at 26.2, and the selling prices index was also similar to November at 7.9. The wages and benefits index fell to 10.8 from 14.7.
Respondents’ expectations regarding future service sector activity remained positive. Both the future revenue index and the future general business activity index held steady, registering 35.3 and 12.0, respectively. Other future service sector activity indexes, such as employment and capital expenditures, remained in solidly positive territory.

Texas Retail Outlook Survey
Texas retail sales contract further
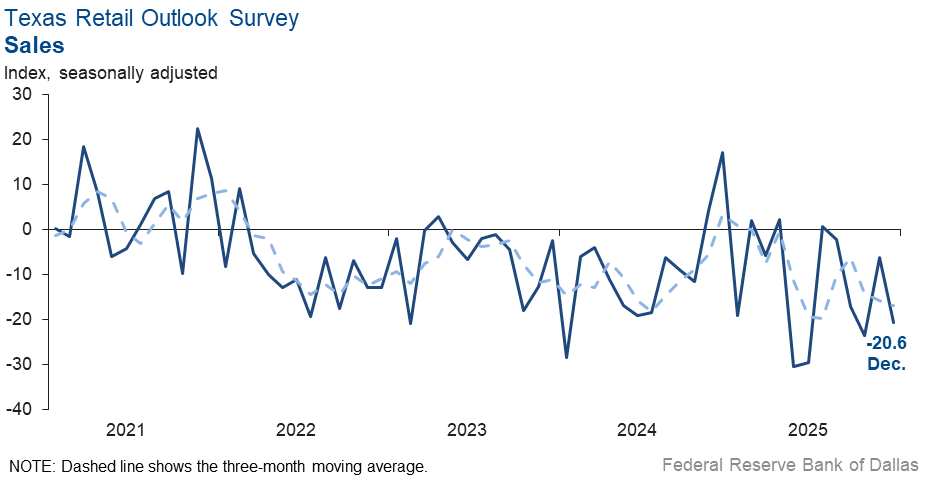
Retail sales fell sharply in December, according to business executives responding to the Texas Retail Outlook Survey. The sales index, a key measure of state retail activity, fell 14 points to -20.6. Retailers’ inventories were unchanged, with an index reading of zero signaling no change in inventories in December.
Labor market indicators suggested a decline in employment this month. The employment index fell 10 points to -6.2. The part-time employment index fell seven points to zero, suggesting no change in part-time employment in December. Meanwhile, the hours worked index was little changed with a reading of -6.3, suggesting a similar contraction in hours worked as last month.
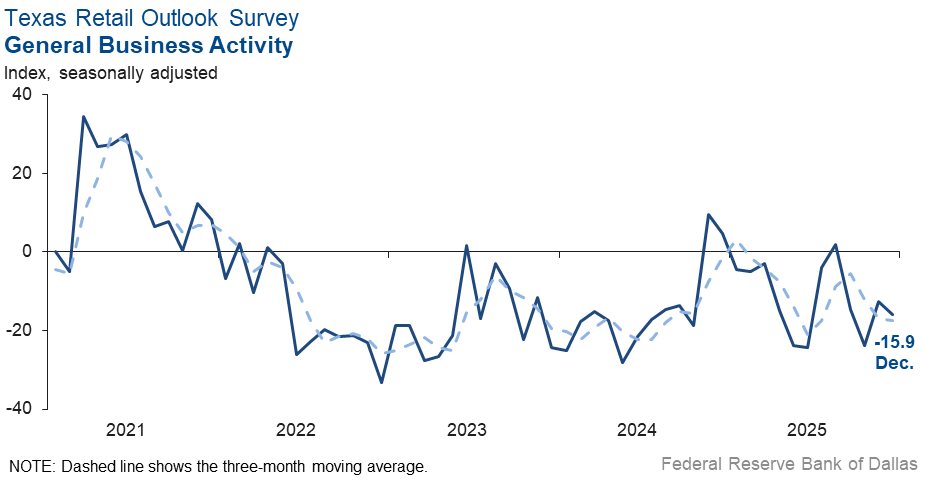
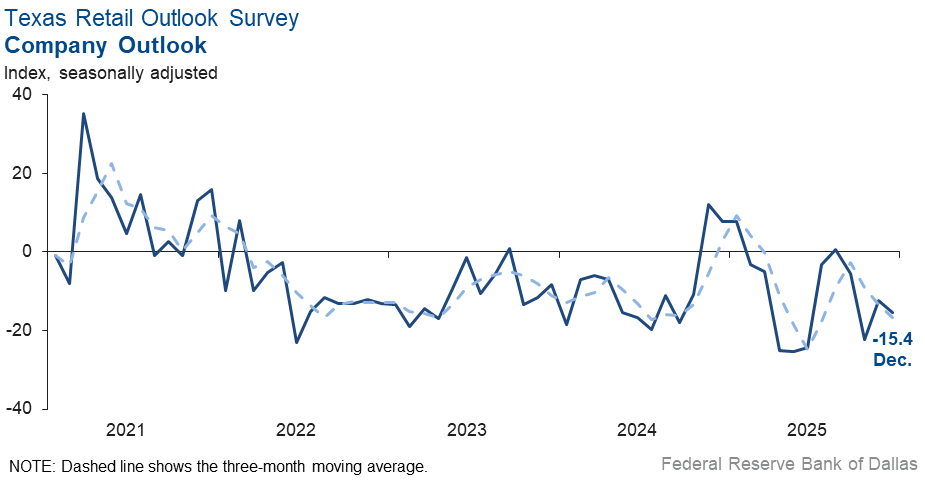
Perceptions of broader business conditions worsened, and uncertainty in outlooks increased. The general business activity index fell three points to -15.9, and the company outlook index also dipped three points to -15.4. The outlook uncertainty index increased to 21.1 from 13.2 in November.
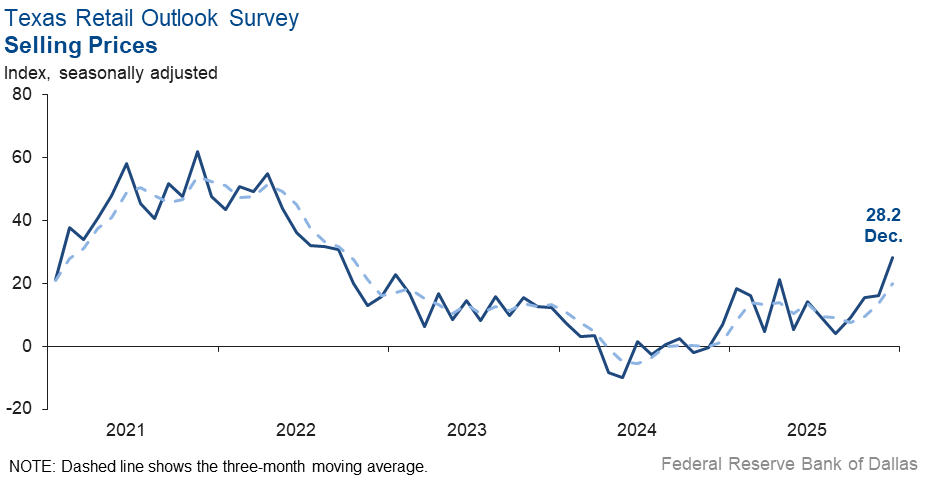
Input and selling prices climbed in December. The selling prices index jumped up 12 points to 28.2, while the input prices index rose 11 points to 38.5. The wages and benefits index also increased to 10.5 from 6.1 in November.
Expectations for future retail activity remained positive in December. The future sales index jumped 12 points to 18.8. Meanwhile, the future general business activity index came in at 2.2, similar to November. Other future retail activity indexes, such as employment and capital expenditures, remained in positive territory.
Next release: January 27, 2026
Data were collected Dec. 15–23, and 236 of the 349 Texas service sector business executives surveyed submitted responses. The Dallas Fed conducts the Texas Service Sector Outlook Survey monthly to obtain a timely assessment of the state’s service sector activity. Firms are asked whether revenue, employment, prices, general business activity and other indicators increased, decreased or remained unchanged over the previous month.
Survey responses are used to calculate an index for each indicator. Each index is calculated by subtracting the percentage of respondents reporting a decrease from the percentage reporting an increase. When the share of firms reporting an increase exceeds the share reporting a decrease, the index will be greater than zero, suggesting the indicator has increased over the prior month. If the share of firms reporting a decrease exceeds the share reporting an increase, the index will be below zero, suggesting the indicator has decreased over the prior month. An index will be zero when the number of firms reporting an increase is equal to the number of firms reporting a decrease. Data have been seasonally adjusted as necessary.
Data have been seasonally adjusted as necessary.
Texas Service Sector Outlook Survey
Historical data are available from January 2007 to the most current release month.
| Business Indicators Relating to Facilities and Products in Texas Current (versus previous month) | ||||||||
| Indicator | Dec Index | Nov Index | Change | Series Average | Trend* | % Reporting Increase | % Reporting No Change | % Reporting Decrease |
Revenue | 0.1 | –2.5 | +2.6 | 10.1 | 1(+) | 25.6 | 48.9 | 25.5 |
Employment | –0.8 | 3.1 | –3.9 | 5.8 | 1(–) | 13.8 | 71.6 | 14.6 |
Part–Time Employment | –0.8 | 0.2 | –1.0 | 1.2 | 1(–) | 5.2 | 88.8 | 6.0 |
Hours Worked | –2.4 | –0.7 | –1.7 | 2.5 | 4(–) | 8.3 | 81.0 | 10.7 |
Wages and Benefits | 10.8 | 14.7 | –3.9 | 15.5 | 67(+) | 16.1 | 78.6 | 5.3 |
Input Prices | 26.2 | 27.6 | –1.4 | 27.7 | 68(+) | 31.9 | 62.4 | 5.7 |
Selling Prices | 7.9 | 6.5 | +1.4 | 7.5 | 65(+) | 18.8 | 70.3 | 10.9 |
Capital Expenditures | 10.1 | 5.8 | +4.3 | 9.7 | 65(+) | 18.4 | 73.3 | 8.3 |
| General Business Conditions Current (versus previous month) | ||||||||
| Indicator | Dec Index | Nov Index | Change | Series Average | Trend** | % Reporting Improved | % Reporting No Change | % Reporting Worsened |
Company Outlook | –2.9 | –4.2 | +1.3 | 3.9 | 4(–) | 17.0 | 63.1 | 19.9 |
General Business Activity | –3.3 | –2.3 | –1.0 | 2.0 | 4(–) | 16.4 | 63.9 | 19.7 |
| Indicator | Dec Index | Nov Index | Change | Series Average | Trend* | % Reporting Increase | % Reporting No Change | % Reporting Decrease |
Outlook Uncertainty | 15.9 | 18.2 | –2.3 | 13.8 | 55(+) | 27.2 | 61.5 | 11.3 |
| Business Indicators Relating to Facilities and Products in Texas Future (six months ahead) | ||||||||
| Indicator | Dec Index | Nov Index | Change | Series Average | Trend* | % Reporting Increase | % Reporting No Change | % Reporting Decrease |
Revenue | 35.3 | 34.0 | +1.3 | 37.2 | 68(+) | 49.6 | 36.1 | 14.3 |
Employment | 20.4 | 20.1 | +0.3 | 22.9 | 68(+) | 29.9 | 60.6 | 9.5 |
Part–Time Employment | 3.8 | 3.8 | 0.0 | 6.4 | 6(+) | 9.7 | 84.4 | 5.9 |
Hours Worked | 6.9 | 9.3 | –2.4 | 5.9 | 8(+) | 13.6 | 79.7 | 6.7 |
Wages and Benefits | 31.1 | 33.9 | –2.8 | 37.4 | 68(+) | 37.6 | 55.9 | 6.5 |
Input Prices | 40.2 | 44.8 | –4.6 | 44.2 | 228(+) | 47.2 | 45.7 | 7.0 |
Selling Prices | 24.5 | 26.6 | –2.1 | 24.5 | 68(+) | 34.9 | 54.7 | 10.4 |
Capital Expenditures | 23.6 | 20.0 | +3.6 | 22.5 | 67(+) | 31.7 | 60.3 | 8.1 |
| General Business Conditions Future (six months ahead) | ||||||||
| Indicator | Dec Index | Nov Index | Change | Series Average | Trend** | % Reporting Improved | % Reporting No Change | % Reporting Worsened |
Company Outlook | 16.8 | 15.4 | +1.4 | 15.4 | 8(+) | 33.4 | 50.0 | 16.6 |
General Business Activity | 12.0 | 13.0 | –1.0 | 11.9 | 7(+) | 33.2 | 45.6 | 21.2 |
Historical data are available from January 2007 to the most current release month.
| Business Indicators Relating to Facilities and Products in Texas Retail (versus previous month) | ||||||||
| Indicator | Dec Index | Nov Index | Change | Series Average | Trend* | % Reporting Increase | % Reporting No Change | % Reporting Decrease |
| Retail Activity in Texas | ||||||||
Sales | –20.6 | –6.3 | –14.3 | 2.5 | 5(–) | 20.4 | 38.5 | 41.0 |
Employment | –6.2 | 3.5 | –9.7 | 1.3 | 1(–) | 10.7 | 72.4 | 16.9 |
Part–Time Employment | 0.0 | 6.8 | –6.8 | –1.6 | 1() | 7.6 | 84.8 | 7.6 |
Hours Worked | –6.3 | –7.7 | +1.4 | –2.3 | 5(–) | 8.2 | 77.3 | 14.5 |
Wages and Benefits | 10.5 | 6.1 | +4.4 | 11.1 | 6(+) | 15.7 | 79.1 | 5.2 |
Input Prices | 38.5 | 27.8 | +10.7 | 22.7 | 68(+) | 46.0 | 46.5 | 7.5 |
Selling Prices | 28.2 | 16.2 | +12.0 | 13.1 | 13(+) | 34.1 | 60.0 | 5.9 |
Capital Expenditures | 16.5 | 16.2 | +0.3 | 7.6 | 4(+) | 21.6 | 73.3 | 5.1 |
Inventories | 0.1 | 7.4 | –7.3 | 2.6 | 3(+) | 22.1 | 55.9 | 22.0 |
| Companywide Retail Activity | ||||||||
Companywide Sales | –19.8 | –7.9 | –11.9 | 3.6 | 8(–) | 18.1 | 44.0 | 37.9 |
Companywide Internet Sales | –9.9 | –18.9 | +9.0 | 3.2 | 10(–) | 16.8 | 56.5 | 26.7 |
| General Business Conditions, Retail Current (versus previous month) | ||||||||
| Indicator | Dec Index | Nov Index | Change | Series Average | Trend** | % Reporting Improved | % Reporting No Change | % Reporting Worsened |
Company Outlook | –15.4 | –12.4 | –3.0 | 0.8 | 4(–) | 15.8 | 53.0 | 31.2 |
General Business Activity | –15.9 | –12.6 | –3.3 | –3.1 | 4(–) | 15.8 | 52.5 | 31.7 |
| Outlook Uncertainty Current (versus previous month) | ||||||||
| Indicator | Dec Index | Nov Index | Change | Series Average | Trend* | % Reporting Increase | % Reporting No Change | % Reporting Decrease |
Outlook Uncertainty | 21.1 | 13.2 | +7.9 | 11.8 | 17(+) | 29.5 | 62.1 | 8.4 |
| Business Indicators Relating to Facilities and Products in Texas, Retail Future (six months ahead) | ||||||||
| Indicator | Dec Index | Nov Index | Change | Series Average | Trend* | % Reporting Increase | % Reporting No Change | % Reporting Decrease |
| Retail Activity in Texas | ||||||||
Sales | 18.8 | 6.9 | +11.9 | 29.9 | 31(+) | 41.0 | 36.7 | 22.2 |
Employment | 9.0 | 8.1 | +0.9 | 12.7 | 8(+) | 23.7 | 61.6 | 14.7 |
Part–Time Employment | 3.2 | 0.9 | +2.3 | 1.5 | 4(+) | 10.4 | 82.4 | 7.2 |
Hours Worked | –4.8 | 2.4 | –7.2 | 2.2 | 1(–) | 7.4 | 80.4 | 12.2 |
Wages and Benefits | 20.2 | 27.9 | –7.7 | 29.0 | 68(+) | 30.4 | 59.4 | 10.2 |
Input Prices | 44.5 | 35.7 | +8.8 | 34.1 | 68(+) | 52.8 | 38.9 | 8.3 |
Selling Prices | 40.5 | 33.3 | +7.2 | 28.3 | 68(+) | 48.6 | 43.2 | 8.1 |
Capital Expenditures | 24.2 | 21.4 | +2.8 | 16.5 | 8(+) | 31.6 | 61.0 | 7.4 |
Inventories | 13.0 | 10.0 | +3.0 | 10.7 | 8(+) | 27.9 | 57.2 | 14.9 |
| Companywide Retail Activity | ||||||||
Companywide Sales | 15.6 | 5.5 | +10.1 | 28.2 | 8(+) | 37.1 | 41.4 | 21.5 |
Companywide Internet Sales | 6.7 | 9.4 | –2.7 | 20.8 | 23(+) | 30.0 | 46.7 | 23.3 |
| General Business Conditions, Retail Future (six months ahead) | ||||||||
| Indicator | Dec Index | Nov Index | Change | Series Average | Trend** | % Reporting Improved | % Reporting No Change | % Reporting Worsened |
Company Outlook | 4.9 | 9.1 | –4.2 | 14.6 | 7(+) | 33.7 | 37.5 | 28.8 |
General Business Activity | 2.2 | 4.1 | –1.9 | 10.1 | 6(+) | 36.6 | 29.0 | 34.4 |
*Shown is the number of consecutive months of expansion or contraction in the underlying indicator. Expansion is indicated by a positive index reading and denoted by a (+) in the table. Contraction is indicated by a negative index reading and denoted by a (–) in the table.
**Shown is the number of consecutive months of improvement or worsening in the underlying indicator. Improvement is indicated by a positive index reading and denoted by a (+) in the table. Worsening is indicated by a negative index reading and denoted by a (–) in the table.
Data have been seasonally adjusted as necessary.
Texas Service Sector Outlook Survey
Texas Retail Outlook Survey


Texas Service Sector Outlook Survey
Comments from survey respondents
Survey participants are given the opportunity to submit comments on current issues that may be affecting their businesses. Some comments have been edited for grammar and clarity.
- High interest rates on a relative basis, federal policy uncertainty and the inflationary impact of tariffs are all serving as economic impediments.
- Overall, the job market is miserable. I cannot remember it being worse; perhaps in 2010 it was similar. But technology has changed things since then. As the owner, I'm on edge day to day, week to week, doing all I can to survive without laying off staff. But that is coming next if the economy and job market don't pick up.
- The political environment has been a big influence on the overall anxiety in the marketplace. We anticipate that the benefit of the essential changes in government fiscal management will become even more obvious in 2026 and will have a positive impact on the economic attitude.
- The higher education landscape is constantly evolving and is significantly impacted by immigration and visa policies as well as new student loan limits. Uncertainty remains extremely high.
- It looks like the restaurant sector is slowing down. Input prices and wages continue to rise.
- Lower oil prices and uncertainty of the mantra "Drill, baby, drill" affect producers, which impacts midstream companies over the long term.
- There has been an increase in queries and solicitations in the last couple of months. However, the quantity of conversion into real contracts is still uncertain, and the timing of resulting income is uncertain as well. Projections are more difficult to make into the next six months.
- December revenue is much better for us than the last three months (on a monthly basis). The year is ending OK for us (break-even). We think 2026 will be a much better year for us vs. 2025. We think overall the economy will show stronger growth, and the job market will get much better with more hiring in tech and elsewhere. We expect to begin hiring in 2026 after many years of not hiring.
- With the stymied outlook from tariffs and a new administration early in 2025, our backlog suffered (from $4 million to only $1.5 million). And now, with minority certifications going away, we will likely no longer be competitive in the marketplace and will have to close or sell in 2026.
- My clients are laying people off and cutting budgets, which is impacting my revenue. I had to lay off people and cut benefits.
- In real estate, interest rates are important. While interest rates have decreased, it hasn’t made a measurable impact. If rates continue to decrease, it should increase activity in the spring.
- While the economy is certainly not great, it seems to be holding steady. That consistency allows businesses, including our clients, to be more proactive in their planning.
- The commercial real estate market continues to improve, while the residential market remains slow for the third year in a row. We need a major shift in consumer sentiment for home ownership to get this market back. Hopefully, 2026 will be the start.
- There are the beginnings of renewals in the Dallas-Fort Worth real estate (industrial/logistics/final manufacturing) development market. Fingers crossed.
- We now focus on the energy markets. AGI [artificial general intelligence] seems to be lowering employment in knowledge-worker arenas.
- It looks like the economy is slowing. We're receiving more pressure to reduce our prices, and we need to get more work.
- We're seeing a reduction in the number of opportunities for consulting services in the public sector. Increased competition is noticeable for ongoing solicitations. The outlook seems uncertain.
- There still seems to be some apprehension in the market concerning spending, slower cycle times. As tariff concerns diminish, I expect spending and confidence to pick up in 2026.
- The impact of tariffs, along with poorly thought-out tariff strategy, continues to negatively impact the manufacturing industry, which is impacting our business.
- We are a capital goods dealer that sells heavy construction equipment. We were hoping for a big December, but as of today, no one is spending any money on construction equipment.
- As a financial services firm, we are impacted by equity and bond market fluctuations. Fourth quarter 2025 revenue is up due to market gains and improvement in bond prices. Health insurance premiums for 2026 significantly increased—20 percent-plus on average, depending on plan. This clearly increases employer and employee costs.
- Our company is in growth mode, therefore there is more uncertainty. But we are adding services and personnel coverage for 2026.
- With ongoing enforcement removing invalid commercial driver license holders and excess capacity from the industry, we should be able to stop the four-year losing streak for American truckers and start making money.
- Health insurance renewal for 2026 was a shock. Premiums went up 29 percent, which was already a big number. Congress must get something done to rein in these costs.
- It feels like the economy is doing well again.
- We are sitting tight for now. We are adjusting prices for next year based on producer price index. We are also increasing wages by two percent for cost-of-living adjustments, plus three percent on average for merit increases. We expect higher capital spending but based more on need than any change in market conditions or economic outlook.
- The government shutdown impacted our revenue significantly. We had three layoffs last month.
- The THC ban has created uncertainty. Additionally, consumers are pulling back on their purchases of alcohol [due to] rising prices for other goods impacting their wallets.
- Customers continue to ask us for new products we can export to Latin America. This is an encouraging sign, because either the U.S. and reciprocal tariffs haven't dampened their appetite for U.S. goods, or their local economies remain strong.
- We continue to see softening of consumer demand in our volume brands like Subaru, Mazda and Volkswagen. Luxury brand sales are holding up better. There is also a reduction in maintenance and repair traffic in general at all dealerships.
- Lead volumes are softening, especially with customers at the entry level of the industry. I think they are very stretched at this point, and every action being taken in Washington only makes things worse.
- We are not buying as many capital assets because new customer installations have slowed down a bit. However, I'd say they have gone from great to good.
Special questions
For this month’s survey, Texas business executives were asked supplemental questions on wages, prices, outlook concerns and artificial intelligence. Results below include responses from participants of all three surveys: Texas Manufacturing Outlook Survey, Texas Service Sector Outlook Survey and Texas Retail Outlook Survey. View individual survey results.
Historical Data
Historical data can be downloaded dating back to January 2007.
Indexes
Download indexes for all indicators. For the definitions of all variables, see data definitions.
Texas Service Sector Outlook Survey |
Texas Retail Outlook Survey |
| Unadjusted | Unadjusted |
| Seasonally adjusted | Seasonally adjusted |
All Data
Download indexes and components of the indexes (percentage of respondents reporting increase, decrease, or no change). For the definitions of all variables, see data definitions.
Texas Service Sector Outlook Survey |
Texas Retail Outlook Survey |
| Unadjusted | Unadjusted |
| Seasonally adjusted | Seasonally adjusted |
Questions regarding the Texas Service Sector Outlook Survey can be addressed to Isabel Brizuela.
Sign up for our email alert to be automatically notified as soon as the latest Texas Service Sector Outlook Survey is released on the web.