
Texas Service Sector Outlook Survey
Texas service sector activity growth picks up slightly; outlooks improve
For this month’s survey, Texas business executives were asked supplemental questions on expected demand and operating margins. Results for these questions from the Texas Manufacturing Outlook Survey, Texas Service Sector Outlook Survey and Texas Retail Outlook Survey have been released together. Read the special questions results.
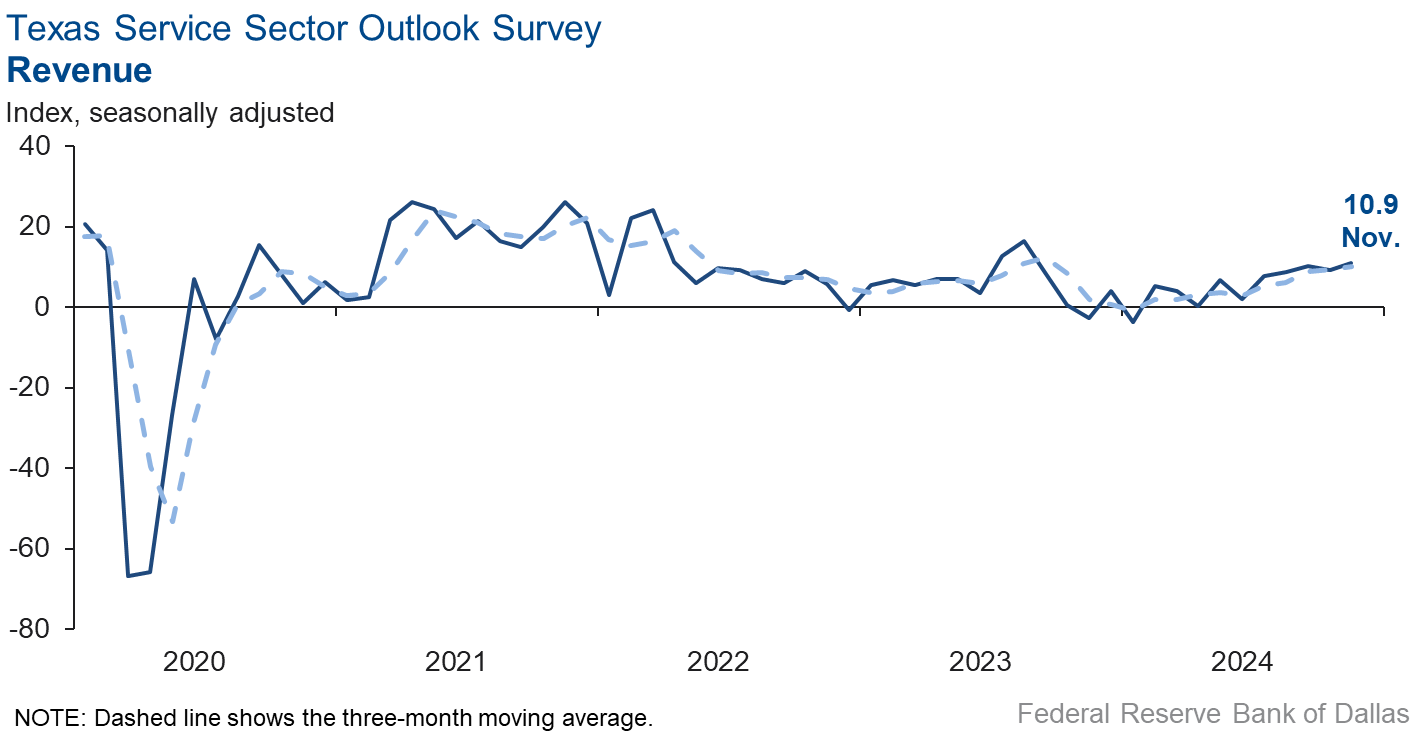
Texas service sector activity expanded at a slightly faster pace in November than the prior month, according to business executives responding to the Texas Service Sector Outlook Survey. The revenue index, a key measure of state service sector conditions, increased to 10.9.
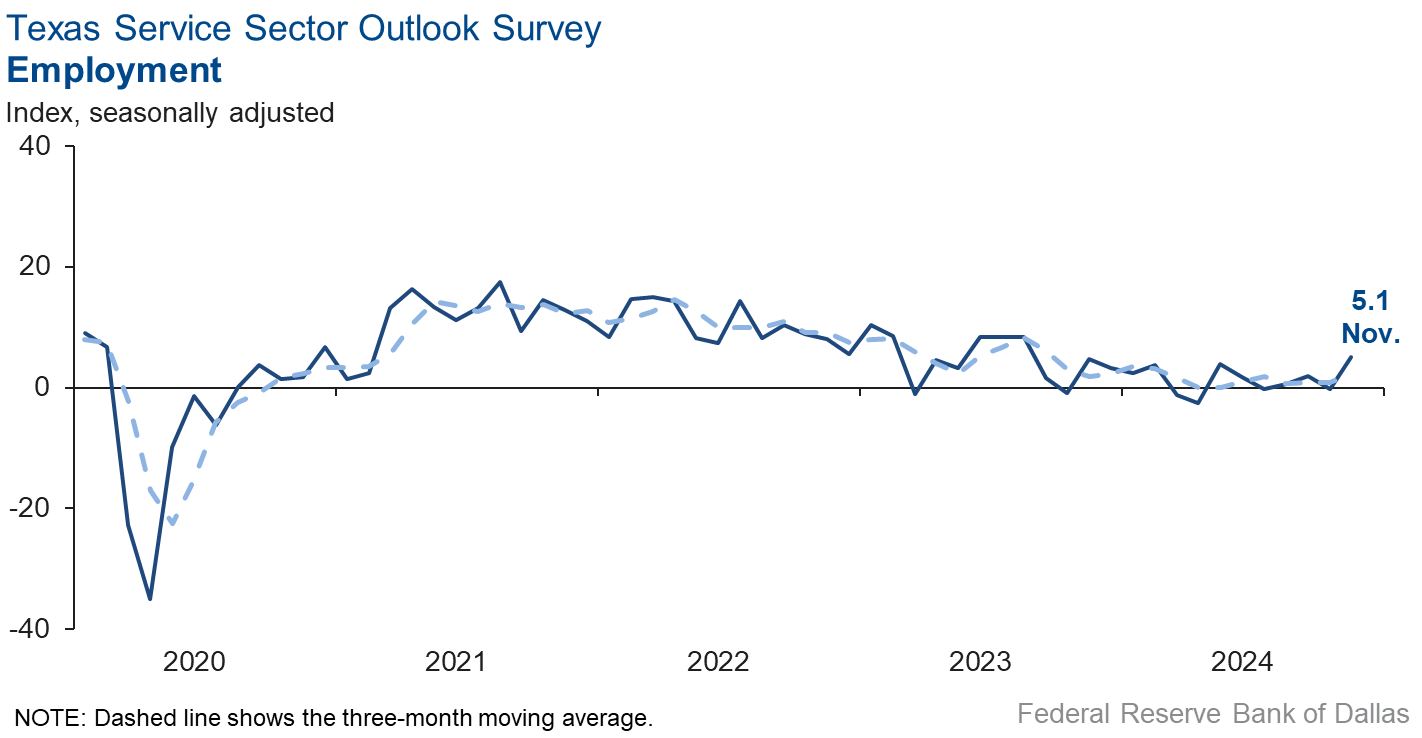
Labor market measures suggested a resumption of employment growth and an improvement in workweeks in November. The employment index jumped to 5.1 from -0.2, while the part-time employment index rose five points to 2.5. The hours worked index increased to 4.8.
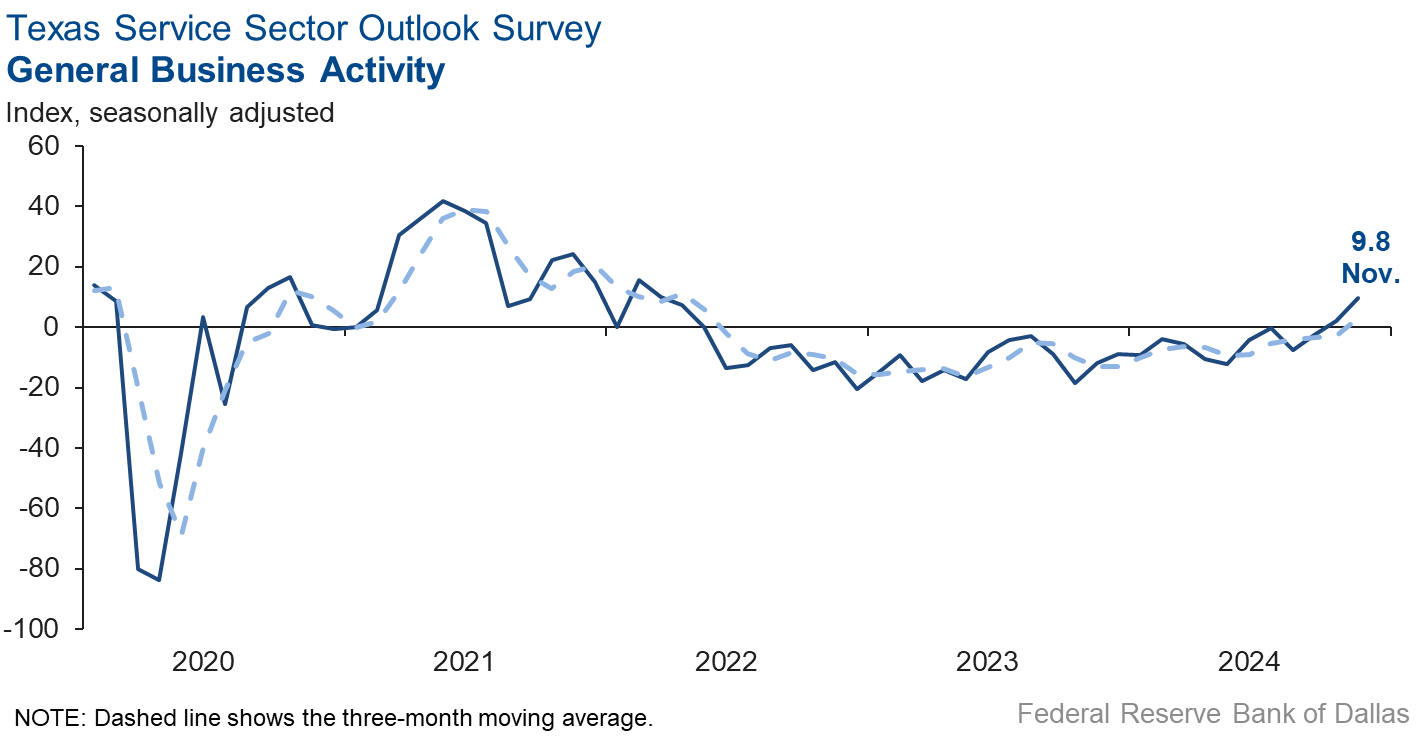
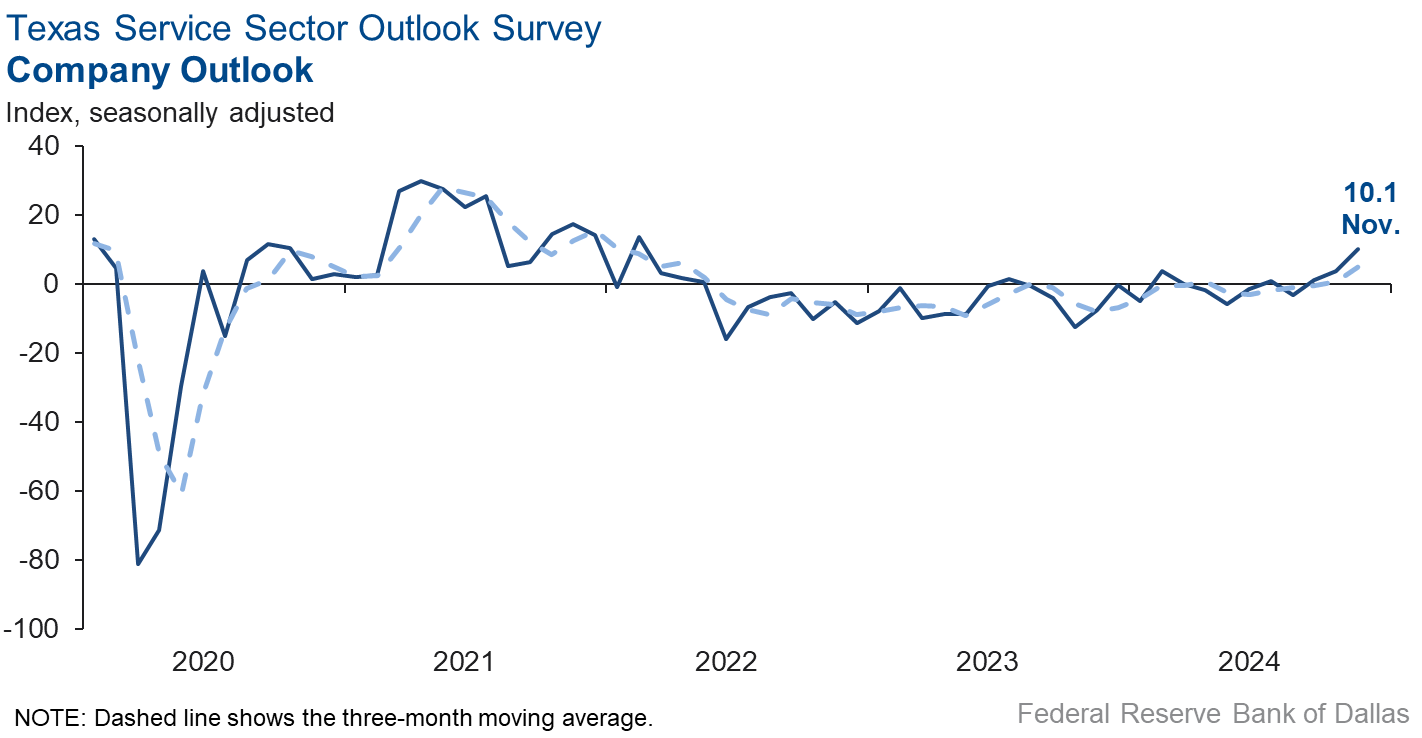
Perceptions of broader business conditions improved significantly in November. The general business activity index increased eight points to 9.8, its highest reading since early 2022. The company outlook index increased six points to 10.1, also its highest level in more than two years. Finally, the outlook uncertainty index fell 16 points to 1.8, the lowest level since mid-2021.
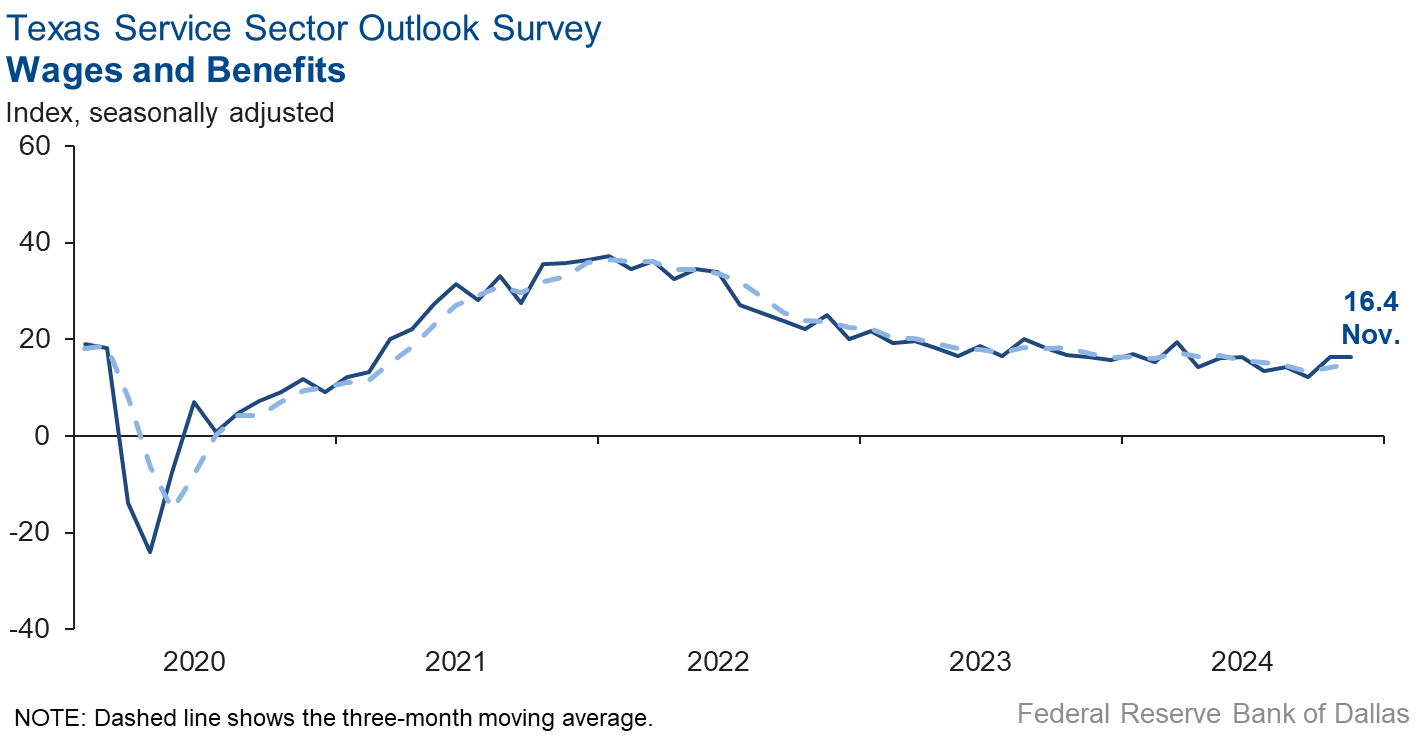
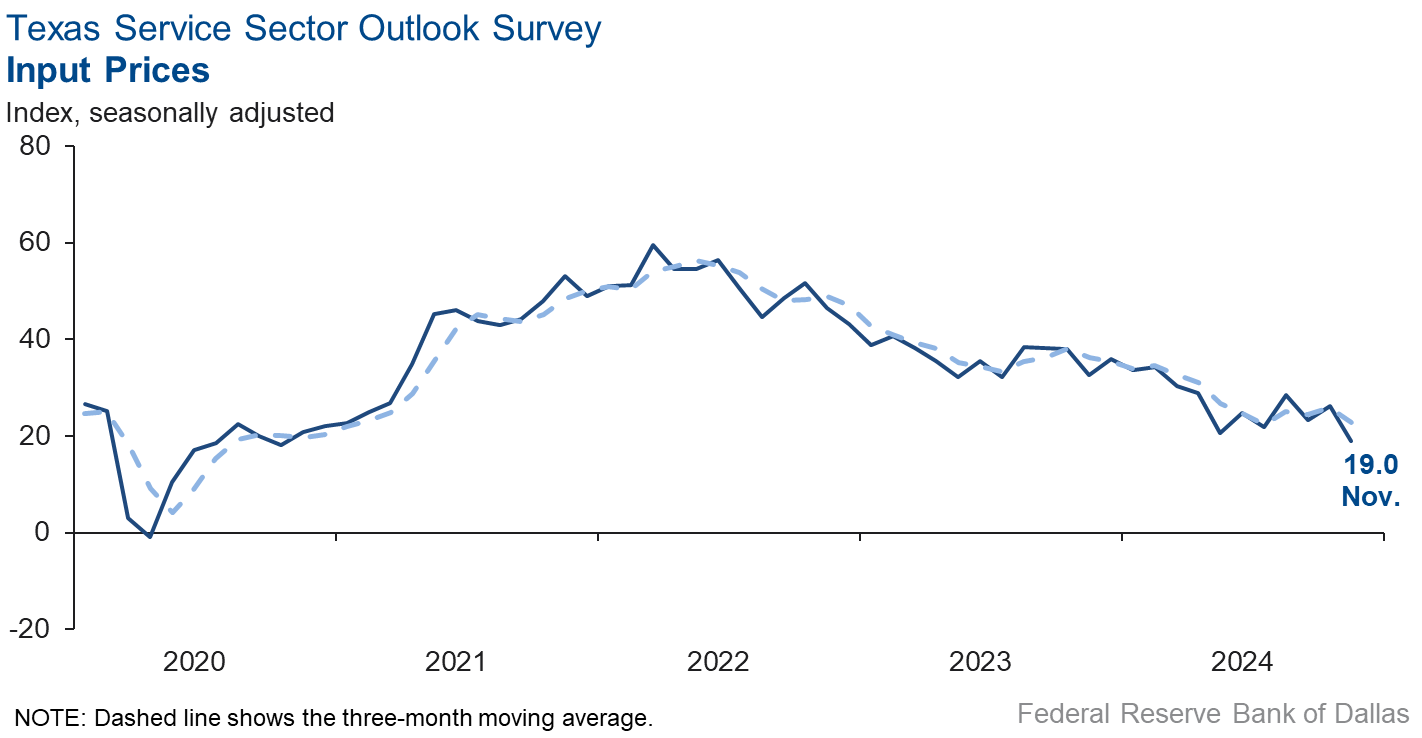
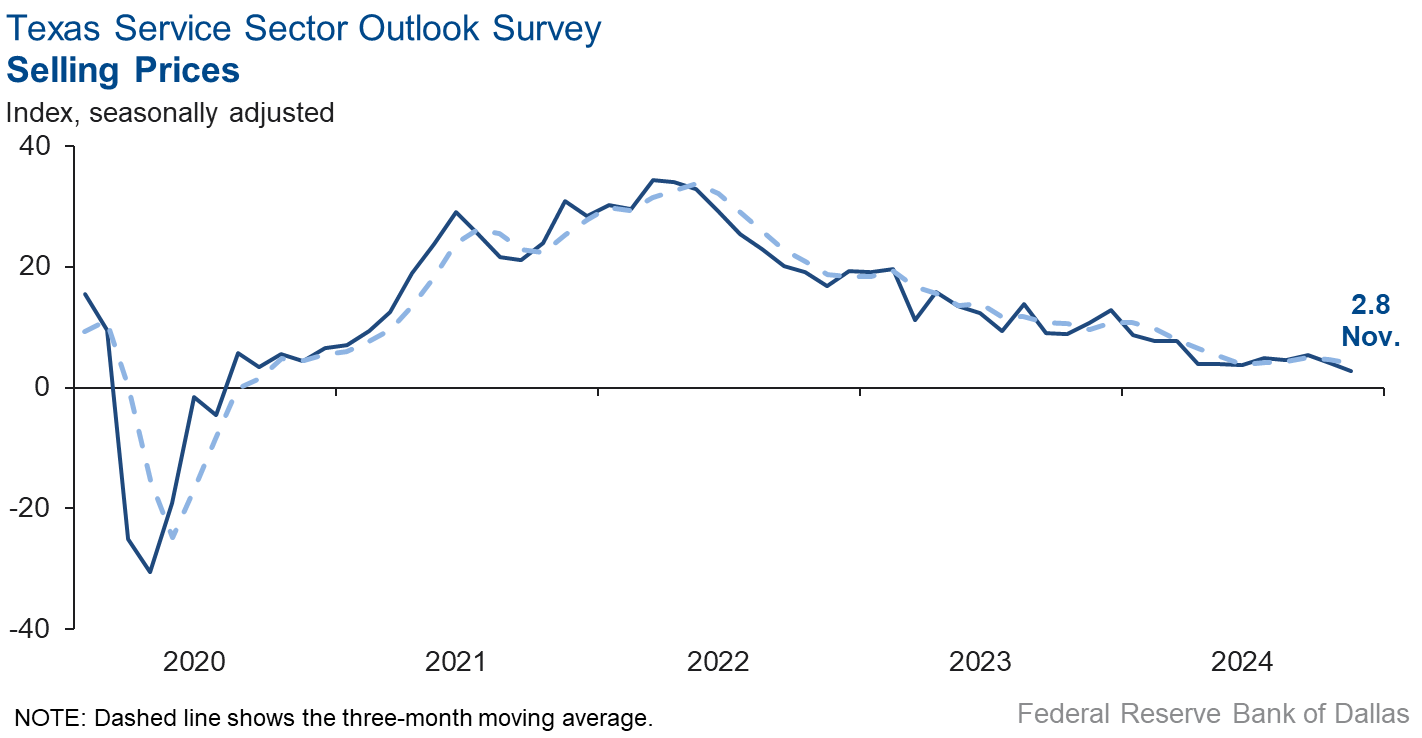
Input price pressures eased, while selling price and wage pressures held steady in November. The input price index fell seven points to 19.0 and the selling price index was little changed at 2.8. The wages and benefits index was unchanged at 16.4.
Respondents’ expectations regarding future business activity reflected improved optimism in November. The future general business activity index moved up five points to 29.8, while the future revenue index increased four points to 44.0. Other future service sector activity indexes such as employment and capital expenditures remained in positive territory and increased, reflecting expectations for sustained growth in the next six months.
Texas Retail Outlook Survey
Texas retail sales growth resumes
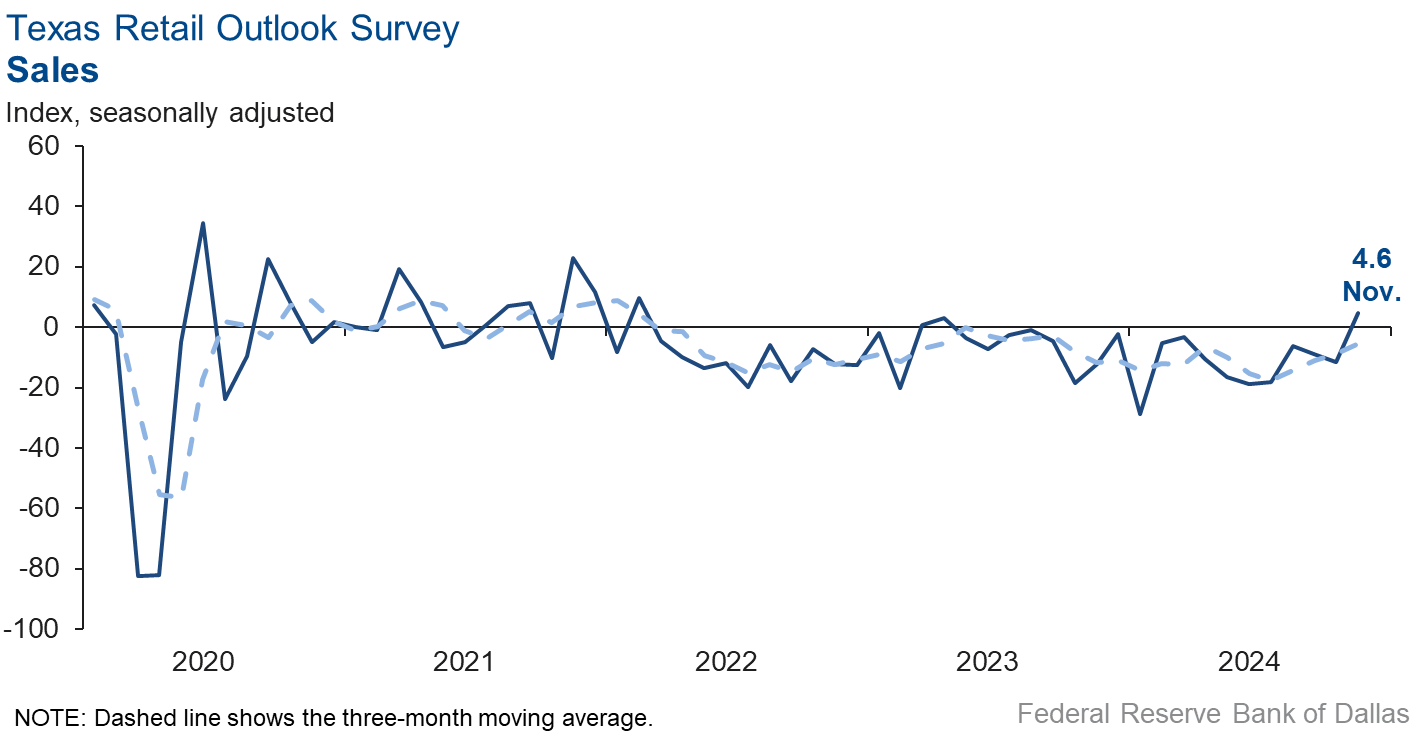
Retail sales activity rebounded in November, according to business executives responding to the Texas Retail Outlook Survey. The sales index, a key measure of state retail activity, increased 16 points to 4.6, its highest level in more than two years. Retailers’ inventories grew over the month, with the November index increasing to 16.6.
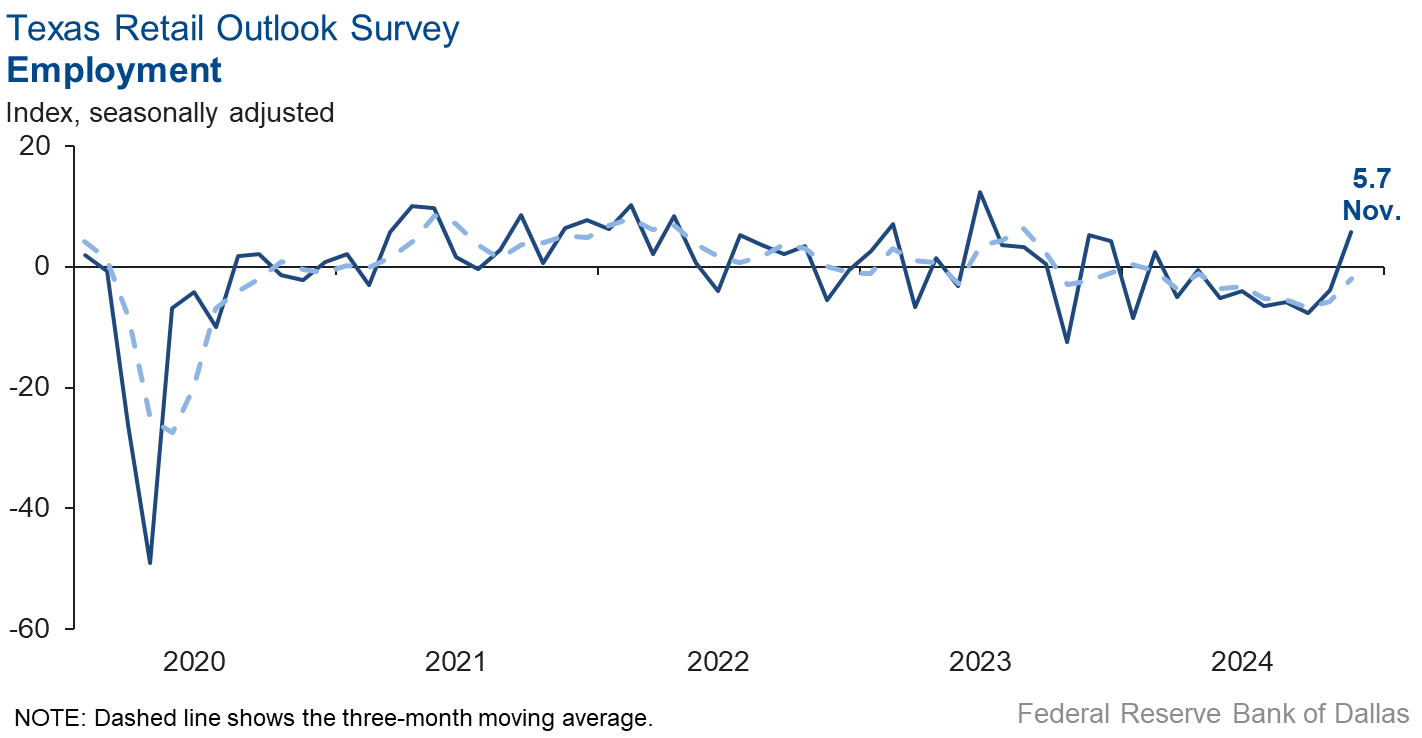
Retail labor market indicators suggested growth in employment and workweeks this month. The employment index climbed 10 points to 5.7, while the part-time employment index edged up to 1.0. The hours worked index jumped nine points to 9.9.
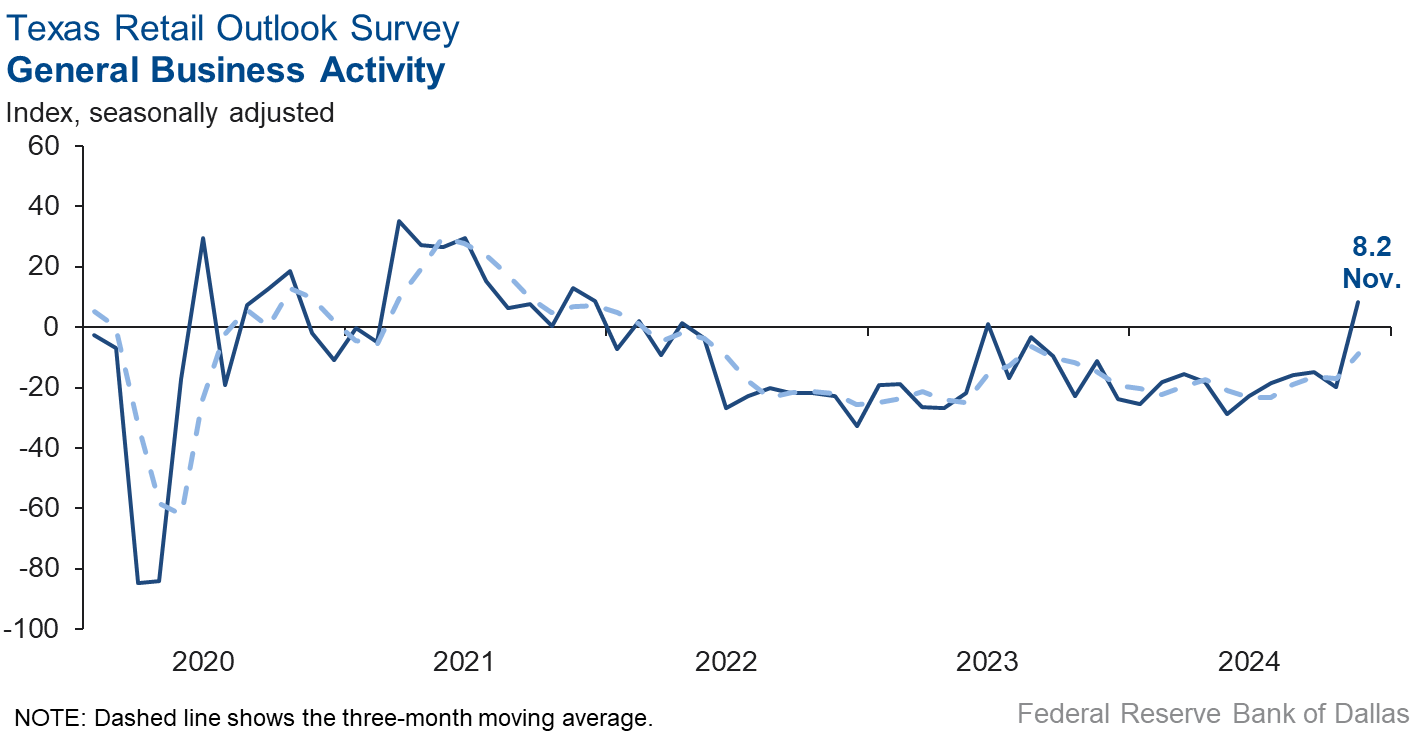
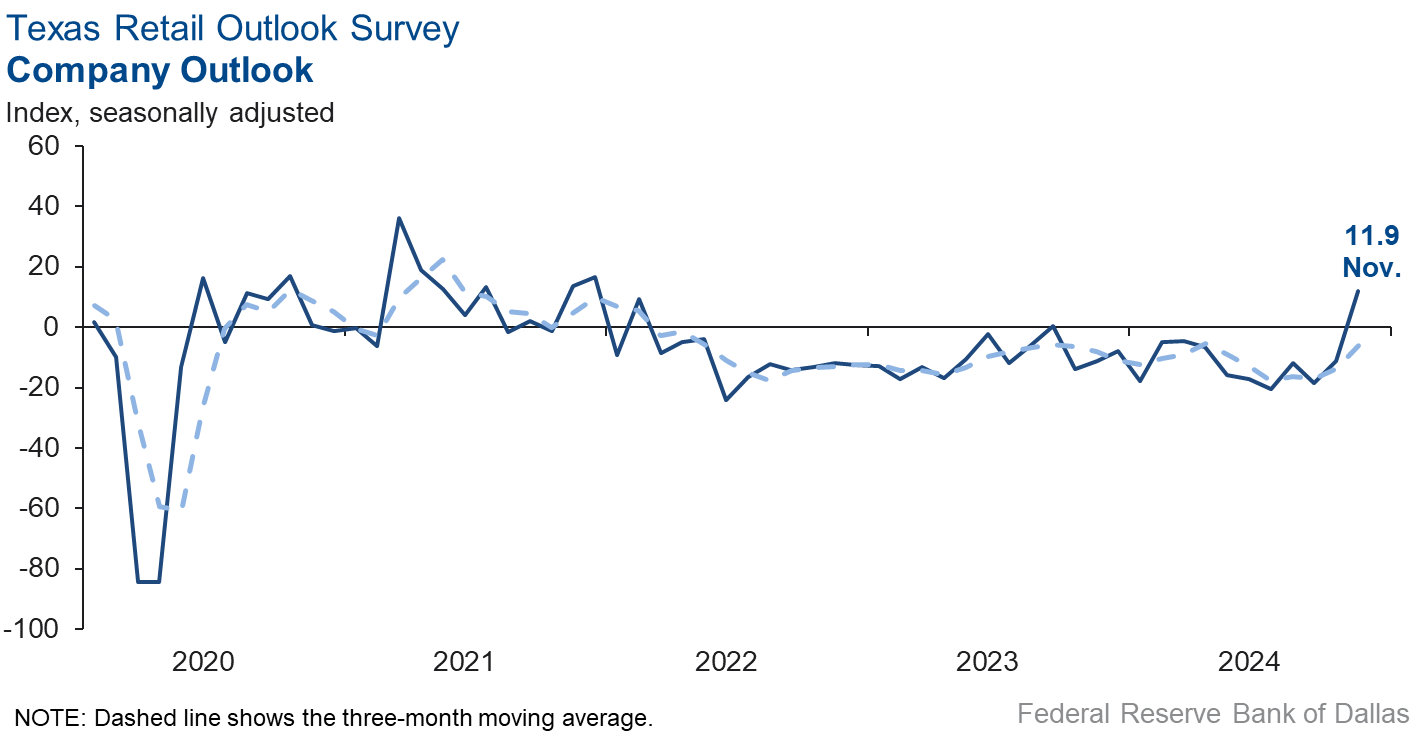
Perceptions of broader business conditions improved notably in November. The general business activity index rebounded to 8.2 from -19.8. The company outlook index increased 23 points to 11.9. Uncertainty in outlooks fell.
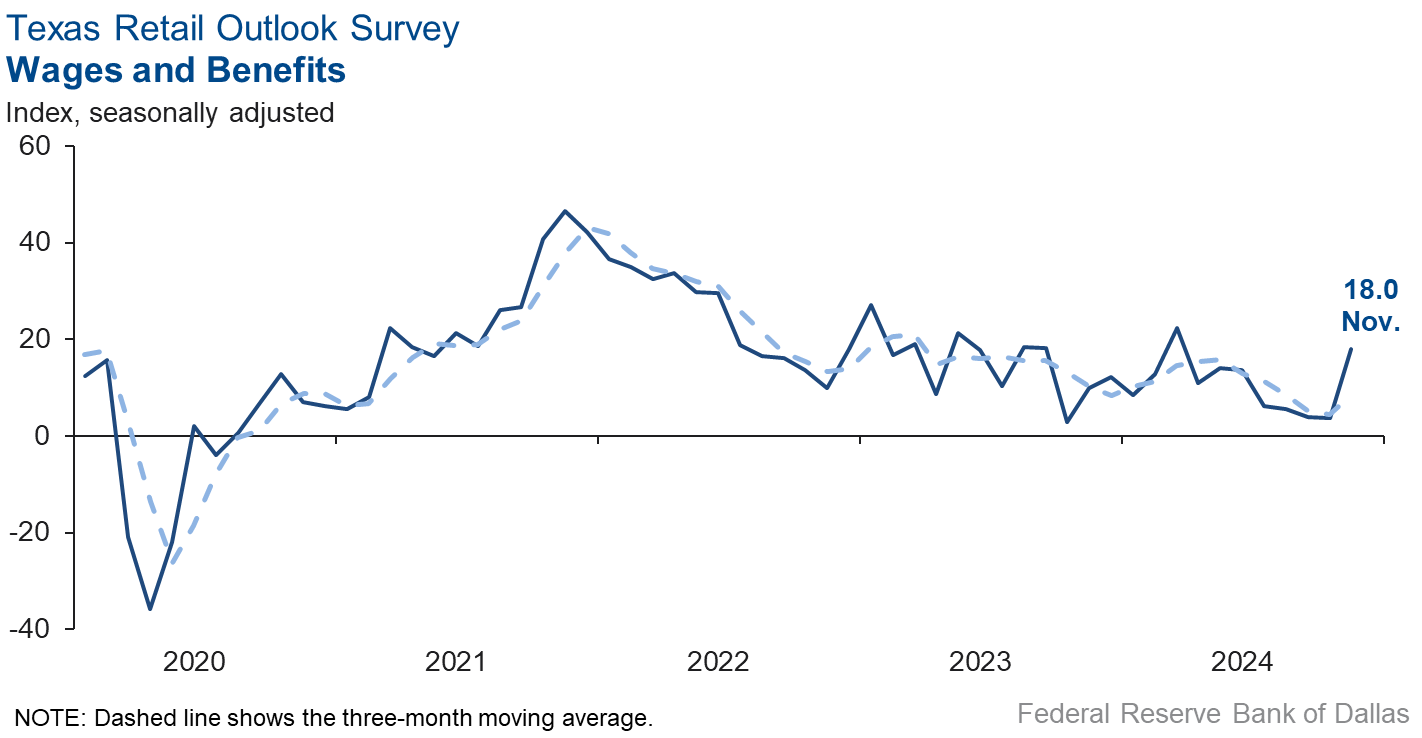
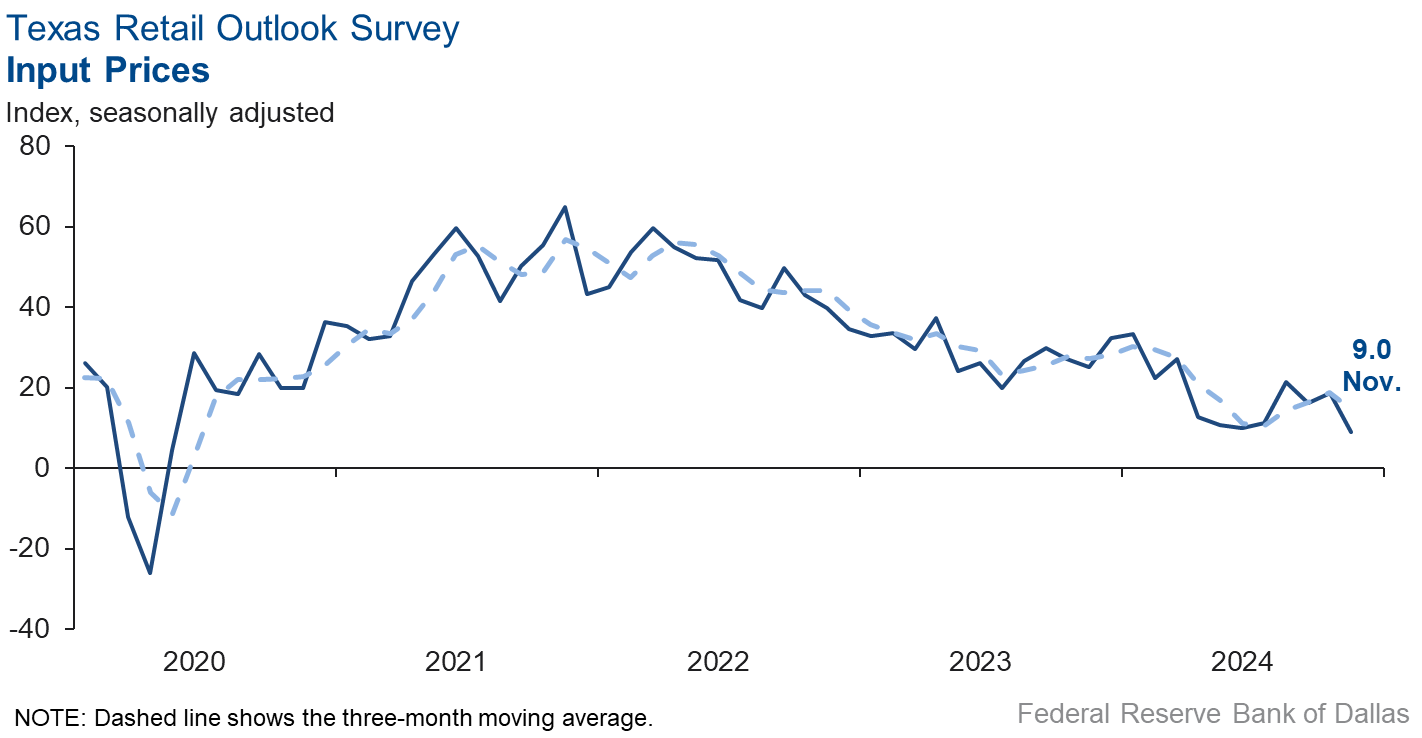
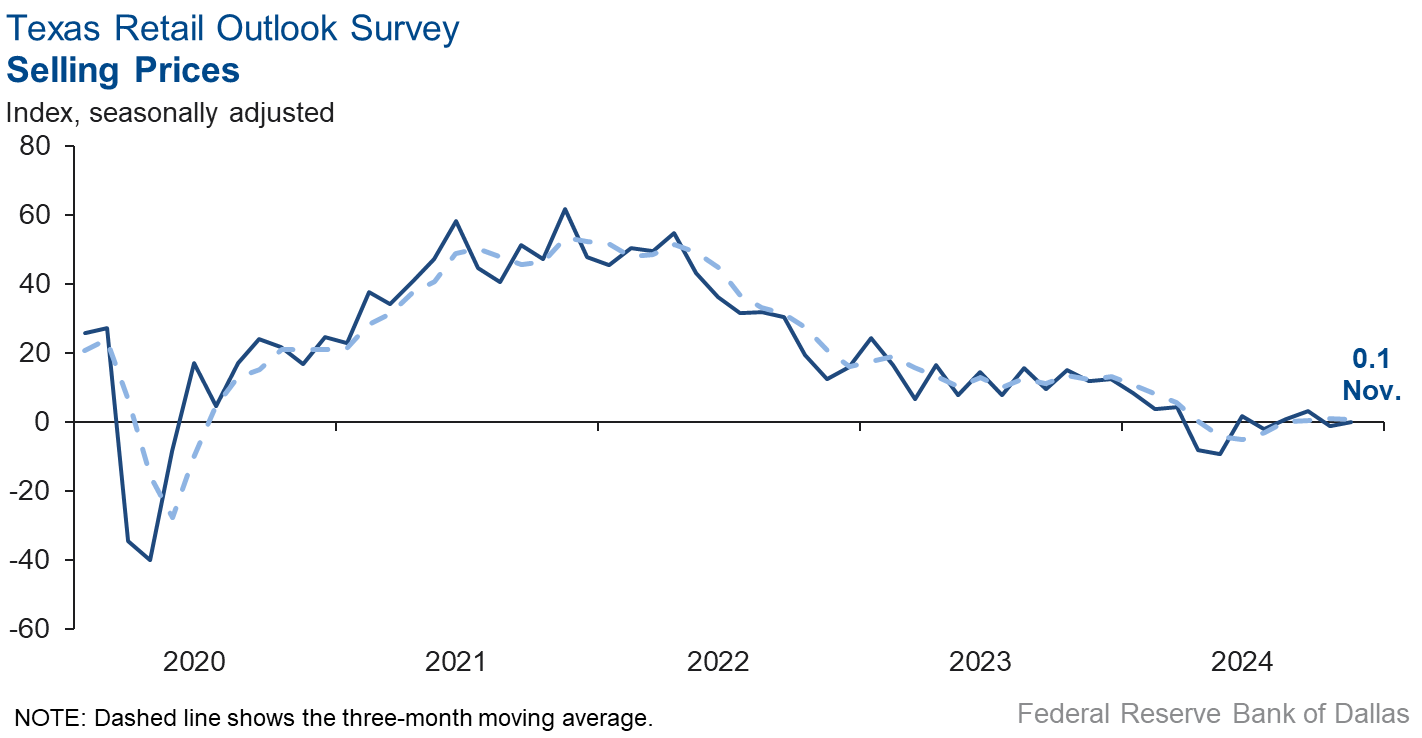
Selling price pressures held steady and input price growth slowed; however, wage growth resumed in November. The selling price index was little changed at 0.1. The input price index fell 10 points to 9.0. The wages and benefits index jumped to 18.0.
Expectations for future business conditions improved slightly in November. The future general business activity index increased three points to 28.7, and the future sales index was little changed at 25.3. Both the future employment index and the future capital expenditures index remained in positive territory and increased, suggesting further improvement in retail activity in the next six months.
Next release: December 31, 2024
Data were collected November 12–20, and 258 of the 397 Texas service sector business executives surveyed submitted responses. The Dallas Fed conducts the Texas Service Sector Outlook Survey monthly to obtain a timely assessment of the state’s service sector activity. Firms are asked whether revenue, employment, prices, general business activity and other indicators increased, decreased or remained unchanged over the previous month.
Survey responses are used to calculate an index for each indicator. Each index is calculated by subtracting the percentage of respondents reporting a decrease from the percentage reporting an increase. When the share of firms reporting an increase exceeds the share reporting a decrease, the index will be greater than zero, suggesting the indicator has increased over the prior month. If the share of firms reporting a decrease exceeds the share reporting an increase, the index will be below zero, suggesting the indicator has decreased over the prior month. An index will be zero when the number of firms reporting an increase is equal to the number of firms reporting a decrease. Data have been seasonally adjusted as necessary.
Data have been seasonally adjusted as necessary.
Texas Service Sector Outlook Survey
Historical data are available from January 2007 to the most current release month.
| Business Indicators Relating to Facilities and Products in Texas Current (versus previous month) | ||||||||
| Indicator | Nov Index | Oct Index | Change | Series Average | Trend* | % Reporting Increase | % Reporting No Change | % Reporting Decrease |
Revenue | 10.9 | 9.2 | +1.7 | 10.6 | 10(+) | 30.2 | 50.5 | 19.3 |
Employment | 5.1 | –0.2 | +5.3 | 6.2 | 1(+) | 12.2 | 80.7 | 7.1 |
Part–Time Employment | 2.5 | –2.0 | +4.5 | 1.3 | 1(+) | 5.1 | 92.3 | 2.6 |
Hours Worked | 4.8 | 2.5 | +2.3 | 2.6 | 2(+) | 8.1 | 88.6 | 3.3 |
Wages and Benefits | 16.4 | 16.3 | +0.1 | 15.8 | 54(+) | 18.8 | 78.8 | 2.4 |
Input Prices | 19.0 | 26.1 | –7.1 | 27.9 | 55(+) | 25.3 | 68.4 | 6.3 |
Selling Prices | 2.8 | 4.0 | –1.2 | 7.5 | 52(+) | 13.8 | 75.2 | 11.0 |
Capital Expenditures | 10.3 | 9.2 | +1.1 | 9.9 | 52(+) | 15.9 | 78.5 | 5.6 |
| General Business Conditions Current (versus previous month) | ||||||||
| Indicator | Nov Index | Oct Index | Change | Series Average | Trend** | % Reporting Improved | % Reporting No Change | % Reporting Worsened |
Company Outlook | 10.1 | 3.8 | +6.3 | 4.3 | 3(+) | 21.3 | 67.5 | 11.2 |
General Business Activity | 9.8 | 2.0 | +7.8 | 2.3 | 2(+) | 22.3 | 65.2 | 12.5 |
| Indicator | Nov Index | Oct Index | Change | Series Average | Trend* | % Reporting Increase | % Reporting No Change | % Reporting Decrease |
Outlook Uncertainty | 1.8 | 17.9 | –16.1 | 13.3 | 42(+) | 23.6 | 54.6 | 21.8 |
| Business Indicators Relating to Facilities and Products in Texas Future (six months ahead) | ||||||||
| Indicator | Nov Index | Oct Index | Change | Series Average | Trend* | % Reporting Increase | % Reporting No Change | % Reporting Decrease |
Revenue | 44.0 | 40.1 | +3.9 | 37.4 | 55(+) | 54.9 | 34.2 | 10.9 |
Employment | 28.1 | 23.6 | +4.5 | 23.0 | 55(+) | 33.6 | 60.9 | 5.5 |
Part–Time Employment | 6.5 | 5.6 | +0.9 | 6.6 | 6(+) | 10.0 | 86.5 | 3.5 |
Hours Worked | 10.0 | 6.2 | +3.8 | 5.9 | 55(+) | 13.6 | 82.8 | 3.6 |
Wages and Benefits | 39.8 | 45.9 | –6.1 | 37.4 | 55(+) | 42.9 | 54.0 | 3.1 |
Input Prices | 36.9 | 43.9 | –7.0 | 44.4 | 215(+) | 45.1 | 46.7 | 8.2 |
Selling Prices | 25.4 | 26.2 | –0.8 | 24.5 | 55(+) | 34.3 | 56.8 | 8.9 |
Capital Expenditures | 24.1 | 22.5 | +1.6 | 22.8 | 54(+) | 29.4 | 65.3 | 5.3 |
| General Business Conditions Future (six months ahead) | ||||||||
| Indicator | Nov Index | Oct Index | Change | Series Average | Trend** | % Reporting Improved | % Reporting No Change | % Reporting Worsened |
Company Outlook | 30.1 | 25.7 | +4.4 | 15.5 | 13(+) | 40.4 | 49.4 | 10.3 |
General Business Activity | 29.8 | 25.3 | +4.5 | 12.0 | 7(+) | 40.4 | 49.0 | 10.6 |
Historical data are available from January 2007 to the most current release month.
| Business Indicators Relating to Facilities and Products in Texas Retail (versus previous month) | ||||||||
| Indicator | Nov Index | Oct Index | Change | Series Average | Trend* | % Reporting Increase | % Reporting No Change | % Reporting Decrease |
| Retail Activity in Texas | ||||||||
Sales | 4.6 | –11.4 | +16.0 | 3.3 | 1(+) | 31.2 | 42.3 | 26.6 |
Employment | 5.7 | –3.8 | +9.5 | 1.6 | 1(+) | 6.9 | 91.9 | 1.2 |
Part–Time Employment | 1.0 | –2.7 | +3.7 | –1.6 | 1(+) | 2.2 | 96.6 | 1.2 |
Hours Worked | 9.9 | 1.0 | +8.9 | –2.2 | 2(+) | 10.0 | 89.9 | 0.1 |
Wages and Benefits | 18.0 | 3.8 | +14.2 | 11.2 | 52(+) | 19.0 | 80.0 | 1.0 |
Input Prices | 9.0 | 18.7 | –9.7 | 22.5 | 55(+) | 21.5 | 66.0 | 12.5 |
Selling Prices | 0.1 | –1.0 | +1.1 | 13.2 | 1(+) | 19.5 | 61.1 | 19.4 |
Capital Expenditures | 14.2 | –1.1 | +15.3 | 7.6 | 1(+) | 15.7 | 82.8 | 1.5 |
Inventories | 16.6 | 7.6 | +9.0 | 2.8 | 4(+) | 35.7 | 45.3 | 19.1 |
| Companywide Retail Activity | ||||||||
Companywide Sales | 8.4 | –9.4 | +17.8 | 4.4 | 1(+) | 32.8 | 42.8 | 24.4 |
Companywide Internet Sales | 9.4 | –16.4 | +25.8 | 3.9 | 1(+) | 26.0 | 57.4 | 16.6 |
| General Business Conditions, Retail Current (versus previous month) | ||||||||
| Indicator | Nov Index | Oct Index | Change | Series Average | Trend** | % Reporting Improved | % Reporting No Change | % Reporting Worsened |
Company Outlook | 11.9 | –11.1 | +23.0 | 1.4 | 1(+) | 22.6 | 66.7 | 10.7 |
General Business Activity | 8.2 | –19.8 | +28.0 | –2.7 | 1(+) | 23.3 | 61.6 | 15.1 |
| Outlook Uncertainty Current (versus previous month) | ||||||||
| Indicator | Nov Index | Oct Index | Change | Series Average | Trend* | % Reporting Increase | % Reporting No Change | % Reporting Decrease |
Outlook Uncertainty | 8.4 | 27.1 | –18.7 | 11.2 | 4(+) | 29.2 | 50.0 | 20.8 |
| Business Indicators Relating to Facilities and Products in Texas, Retail Future (six months ahead) | ||||||||
| Indicator | Nov Index | Oct Index | Change | Series Average | Trend* | % Reporting Increase | % Reporting No Change | % Reporting Decrease |
| Retail Activity in Texas | ||||||||
Sales | 25.3 | 24.8 | +0.5 | 30.3 | 18(+) | 41.6 | 42.1 | 16.3 |
Employment | 18.1 | 7.1 | +11.0 | 12.6 | 2(+) | 23.7 | 70.6 | 5.6 |
Part–Time Employment | 2.1 | 1.0 | +1.1 | 1.5 | 2(+) | 6.0 | 90.1 | 3.9 |
Hours Worked | 5.0 | 5.0 | 0.0 | 2.4 | 2(+) | 11.0 | 83.0 | 6.0 |
Wages and Benefits | 26.3 | 24.1 | +2.2 | 29.0 | 55(+) | 32.2 | 62.0 | 5.9 |
Input Prices | 22.3 | 40.0 | –17.7 | 33.7 | 55(+) | 35.6 | 51.1 | 13.3 |
Selling Prices | 20.0 | 28.9 | –8.9 | 28.5 | 55(+) | 33.3 | 53.3 | 13.3 |
Capital Expenditures | 17.2 | 11.2 | +6.0 | 16.6 | 2(+) | 23.7 | 69.8 | 6.5 |
Inventories | 2.8 | 17.0 | –14.2 | 10.7 | 13(+) | 28.6 | 45.6 | 25.8 |
| Companywide Retail Activity | ||||||||
Companywide Sales | 29.1 | 29.3 | –0.2 | 28.8 | 18(+) | 41.1 | 46.8 | 12.0 |
Companywide Internet Sales | 20.5 | 21.0 | –0.5 | 21.0 | 10(+) | 30.8 | 59.0 | 10.3 |
| General Business Conditions, Retail Future (six months ahead) | ||||||||
| Indicator | Nov Index | Oct Index | Change | Series Average | Trend** | % Reporting Improved | % Reporting No Change | % Reporting Worsened |
Company Outlook | 29.1 | 25.6 | +3.5 | 14.9 | 2(+) | 40.8 | 47.4 | 11.7 |
General Business Activity | 28.7 | 25.7 | +3.0 | 10.4 | 2(+) | 39.4 | 50.0 | 10.7 |
*Shown is the number of consecutive months of expansion or contraction in the underlying indicator. Expansion is indicated by a positive index reading and denoted by a (+) in the table. Contraction is indicated by a negative index reading and denoted by a (–) in the table.
**Shown is the number of consecutive months of improvement or worsening in the underlying indicator. Improvement is indicated by a positive index reading and denoted by a (+) in the table. Worsening is indicated by a negative index reading and denoted by a (–) in the table.
Data have been seasonally adjusted as necessary.
Texas Service Sector Outlook Survey
Texas Retail Outlook Survey
Texas Service Sector Outlook Survey
Comments from survey respondents
These comments are from respondents’ completed surveys and have been edited for publication.
- It seems that there has been a psychological bump in the economy since the election. We'll see how viable that bump is over the long term.
- A new administration always has implications for business which are not fully known for six months to a year.
- The results of the elections will make drastic changes in the areas of spending by various government entities (local through national). Had the Democrats retained control consistent direction would have been maintained. With the Republicans in charge, the direction of spending will be totally upended and uncertainty will persist for the next year or so.
- The threat of a reduced rate of our premiums (title policy premiums) combined with the increased cost to combat fraud are our highest concerns.
- We experienced some slowdown in customer decisions after the election.
- We have been operating on the belief, with no real evidence, that a significant number of our customers were waiting to see the outcome of the U.S. election and were holding or postponing projects due to that situation. Regardless, work has declined rapidly in the fourth quarter of 2024, including our own. But we are also seeing a rapid increase in available talent and resources, which we believe indicates a rapid, industry wide scale-back in IT project spending. The uncertainty is driven by the lack of response to the actual election results and therefore a curiosity about what the real driver was, or whether companies have just not yet developed strategies for 2025 to deal with the new business climate.
- The election and the political rhetoric created undue stress on our three employees and the clients we serve. Even though the election is behind us, several of our nonprofit partners are weary and are carrying a tremendous amount of stress on what is to come for the critical work they are doing in the community.
- The level of business activity in the industrial construction industry has significantly decreased. Housing and large subdivision work has remained steady.
- Uncertainty in future federal funding support for transportation infrastructure has created a bit of a chilling effect moving forward. Uncertainty is the key word here.
- There’s uncertainty about the new administration with regard to tariffs and immigration including work visas.
- It seems business trends are becoming more predictable, and everyone is planning better.
- Until the real estate market can determine where the 10-year is going to settle, we will continue to experience a sluggish market. We are optimistic that this will happen in the near future and transactions will begin to happen at a more normal level.
- The presidential election outcome will likely decrease banking's regulatory burden over time. Governmental efficiency studies are long overdue. The challenge will remain to reduce our U.S. debt level. The agriculture sector, specifically farmers, is facing the toughest economic times we have witnessed in 42 years as a commercial banking agricultural lender. On the income side, low commodity prices with ever-increasing costs of production (operating costs) create increasing challenges to getting 2025 farm operating loans approved due to inadequate cash flows. The expired Farm Bill creates additional unknowns.
- We are not able to recover from the pirating of our brand name. We will either pass along the franchise to someone else or close the doors at year-end.
- Companies were very slow to make any final hiring decisions in November, possibly due to the election. We would not say anything has changed since the election is over, but perhaps it will pick up briefly after Thanksgiving and before the holidays. The white-collar job market is still very slow, clients are taking much longer to make decisions even if they lose candidates along the way to other companies.
- There is uncertainty as to how the new administration will perform.
- It was great that the election went off without much incident and that the outcome was so decisive that we, as a country, avoided the protests and bloodshed that might have occurred otherwise. Stability is good both in the election process, but also in the general procession of government. Policy changes are expected, and desired, but chaotic implementation is unnecessary.
- The election is over, thankfully.
- The election result uncertainty is over, but the incoming administration’s regulatory policy is still unclear. We anticipate numerous regulations to be overturned, which in turn could be a boost to business.
- October was the first month in the last six when we made our annual budget. Things continue to be expensive, but inflation has leveled off. We just completed our 2025 budget, and we see some growth in occupancy; however, we will be implementing a room renovation at the first of the year that will run through mid-year. The displacement of revenue will exceed $1 million but will get us more competitive and ready for 2026, which looks very strong for group business.
- We have to wait and see what the newly elected administration will do regarding trade with Mexico. Looming tariff implementation is a big concern, since we move international containers and cargo exclusively.
- We are in a bit of wait-and-see mode at the moment following the election. We believe the new administration will enact policies that will increase oil and gas production, and thus will be good overall for the port.
- It is very unusual for us to have a slow November. Business is abnormally slow.
- Political uncertainty introduced by the new administration will take some time to sort itself out. In the meantime, we continue to see pressure from the lower rate environment, which is gradually improving but still not driving renewed capital investment.
- More uncertainty in government contracts with continuing resolutions and questions on budget cuts.
- The election is over, and the anticipation of a positive change has improved attitudes and markets. The Federal Reserve lowered interest rates by announcing the quarter-rate reduction of the discount rate. We will wait and see if the new administration can improve the economic and geopolitical environment. The biggest challenge will be how the national debt will be addressed.
- While the immediate outlook has not changed significantly, we are seeing some signs that activity will improve going into the first quarter of 2025.
- We are concerned about the economic cycle after the Federal Reserve rate cuts. We are concerned and think the Federal Reserve began lowering rates while inflation was still high.
- We experienced a slowdown in commercial real estate leasing activity and expect that to continue if widespread tariffs are imposed and if mass deportations are implemented.
- It's safe to say we have seen a bump in activity after the election on the lower-middle-market business sell side. Buyers are still plentiful as the system deals with excess cash. Small business uncertainty has languished.
- We are seeing some softness and slower pay from our retail, restaurant, and service and hospitality business clients buying insurance.
- There’s no doubt that having a pro-business versus pro-government administration is impacting business in the field significantly already.
- Tariffs on Korea would be horrible for our business.
- Labor supply seems to be good. Wages stabilizing.
- With the election settled, we are hopeful some meaningful policies will start to emerge that support small business. However, we are worried about trade policy, mainly tariffs on imports, and retaliation from our trading partners.
- The chaos we expect to have to endure over the next four years will just insert an ongoing level of uncertainty into the economy. And, if the tariff wars begin, it could crush our business.
- Margins remain a concern. Expect profits to continue to decline for the remainder of 2024 and into 2025. New vehicle inventories are too high. Pre-owner days of supply is too low.
- There continues to be uncertainty in the retail auto industry about interest rates, electric vehicle sales and consumer sentiment.
- There’s a lack of business activity.
- We are worried about getting paid fairly and on time by PBMs, insurance companies, and the federal government (Medicare).
- We think now that the election is over, people are ready to get back to work, especially with a pro-business administration. People are already looking to purchase more.
- With the election uncertainty behind us, we are hopeful that inflation will moderate and general business activity will improve.
- We think the new administration will do things to help the economy and businesses grow and move forward. Our concern is that any trade war could increase our cost of doing business and create supply line interruptions similar to what we experienced during COVID. It was very difficult to maintain profitable margins during the COVID years because of rapid overnight price increases on the cost of goods.
Historical Data
Historical data can be downloaded dating back to January 2007.
Indexes
Download indexes for all indicators. For the definitions of all variables, see data definitions.
Texas Service Sector Outlook Survey |
Texas Retail Outlook Survey |
| Unadjusted | Unadjusted |
| Seasonally adjusted | Seasonally adjusted |
All Data
Download indexes and components of the indexes (percentage of respondents reporting increase, decrease, or no change). For the definitions of all variables, see data definitions.
Texas Service Sector Outlook Survey |
Texas Retail Outlook Survey |
| Unadjusted | Unadjusted |
| Seasonally adjusted | Seasonally adjusted |
Questions regarding the Texas Service Sector Outlook Survey can be addressed to Jesus Cañas at jesus.canas@dal.frb.org.
Sign up for our email alert to be automatically notified as soon as the latest Texas Service Sector Outlook Survey is released on the web.
