Dallas Fed Energy Survey

Third Quarter | September 25, 2019
Oil and Gas Activity Contracts as Uncertainty Remains Heightened
What’s New This Quarter
Special questions this quarter focus on constraints limiting current activity, plus the number of drilled but uncompleted wells (DUCs) and when U.S. oil rig counts will bottom out.
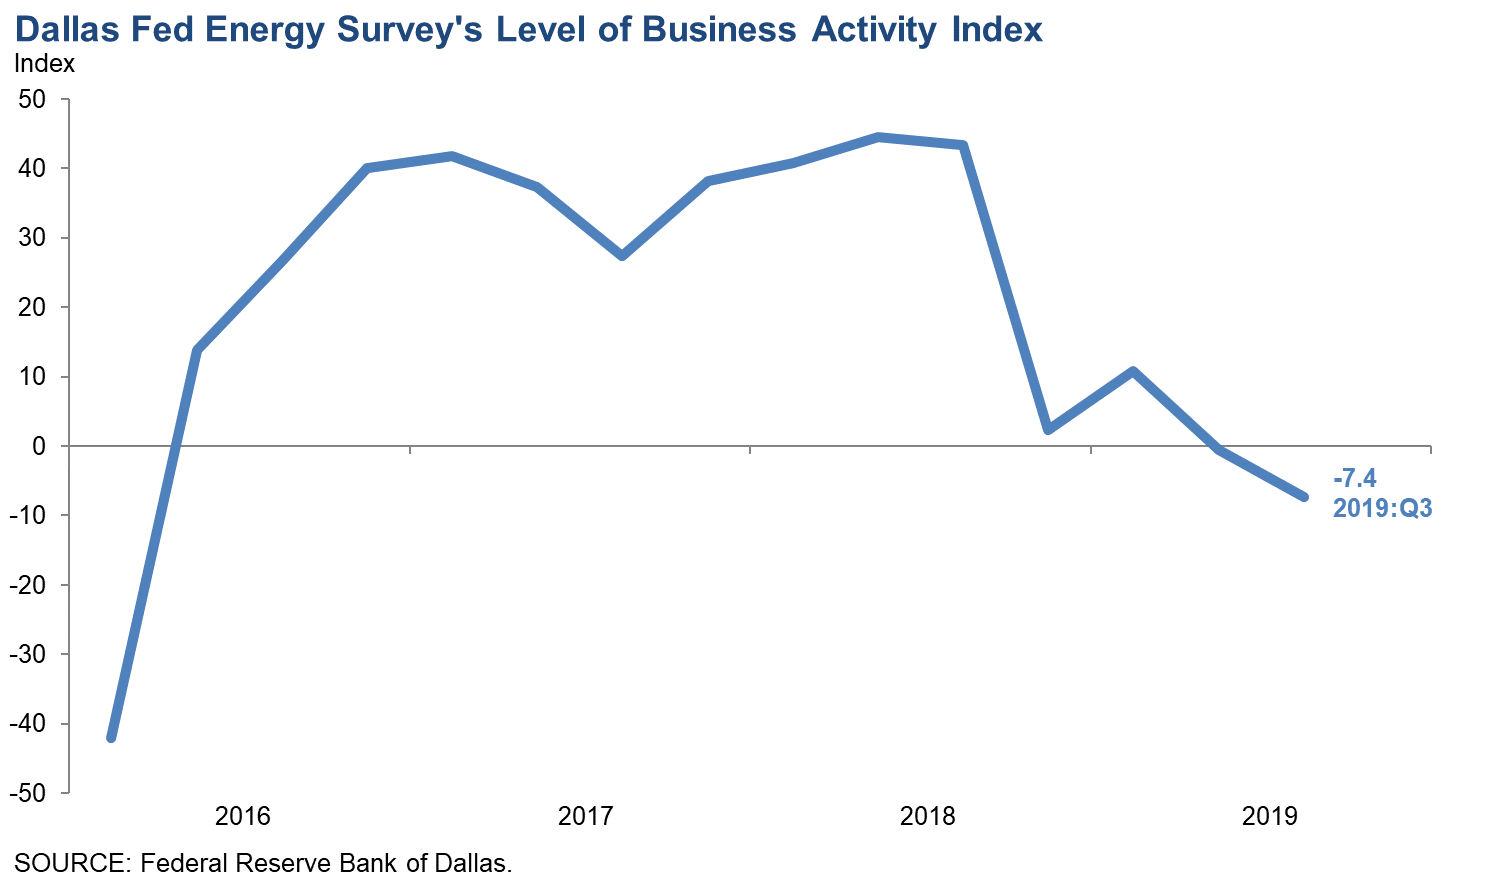
Activity in the oil and gas sector declined in third quarter 2019, according to oil and gas executives responding to the Dallas Fed Energy Survey. The business activity index—the survey’s broadest measure of conditions facing Eleventh District energy firms—fell to -7.4 in the third quarter from -0.6 in the second quarter. Oilfield services firms drove the decline, with their business activity index slumping to -21.8 from 6.6.
Negative survey readings indicate contraction; those above zero suggest expansion.
Oil and gas production increased for the 12th consecutive quarter, according to exploration and production executives. The oil production index was at 15.7 in the third quarter, a tick down from the second-quarter reading of 17.4. Meanwhile, the natural gas production index fell to 6.5 from 13.4.
Among oilfield services firms, the equipment utilization index plummeted 27 points to -24.0 in the third quarter, its lowest reading since 2016 and suggestive of a large contraction in equipment utilization. Input costs continued rising but at a significantly slower pace, with the index plunging to 5.6 from 27.1. Meanwhile, the prices received for services index fell further into negative territory, to -18.5 from -12.1, suggesting a further decline in oilfield services prices. The operating margins index remained negative but less so, rising to -24.0 from -32.8.
The aggregate employment index slid to -8.0 from -2.5, suggesting employment declined modestly for a second quarter in a row. Meanwhile, the aggregate employee hours worked index declined to -2.4 from 3.1. The index for aggregate wages and benefits, which fell to 6.2 from 14.5, shows a further slowing of wage growth.
The aggregate company outlook index improved to zero from -4.5; the zero reading suggests outlooks remained unchanged during the third quarter after worsening during the second quarter. However, company outlooks for oilfield services firms remained negative at -14.8. While uncertainty continues to intensify, slightly fewer firms noted rising uncertainty this quarter than last, and the index fell 12 points to 38.
On average, respondents expect West Texas Intermediate (WTI) oil prices will be $56.92 per barrel by year-end 2019, with responses ranging from $48 to $75 per barrel. Respondents expect Henry Hub natural gas prices to be $2.54 per million British thermal units (MMBtu) at year-end. For reference, WTI spot prices averaged $57.76 per barrel during the survey collection period, and Henry Hub spot prices averaged $2.67 per MMBtu.
Next release: December 27, 2019
|
Data were collected Sept. 11–19, and 163 energy firms responded. Of the respondents, 108 were exploration and production firms and 55 were oilfield services firms. The Dallas Fed conducts the Dallas Fed Energy Survey quarterly to obtain a timely assessment of energy activity among oil and gas firms located or headquartered in the Eleventh District. Firms are asked whether business activity, employment, capital expenditures and other indicators increased, decreased or remained unchanged compared with the prior quarter and with the same quarter a year ago. Survey responses are used to calculate an index for each indicator. Each index is calculated by subtracting the percentage of respondents reporting a decrease from the percentage reporting an increase. When the share of firms reporting an increase exceeds the share reporting a decrease, the index will be greater than zero, suggesting the indicator has increased over the previous quarter. If the share of firms reporting a decrease exceeds the share reporting an increase, the index will be below zero, suggesting the indicator has decreased over the previous quarter. |
Third Quarter | September 25, 2019
Price Forecasts
West Texas Intermediate Crude
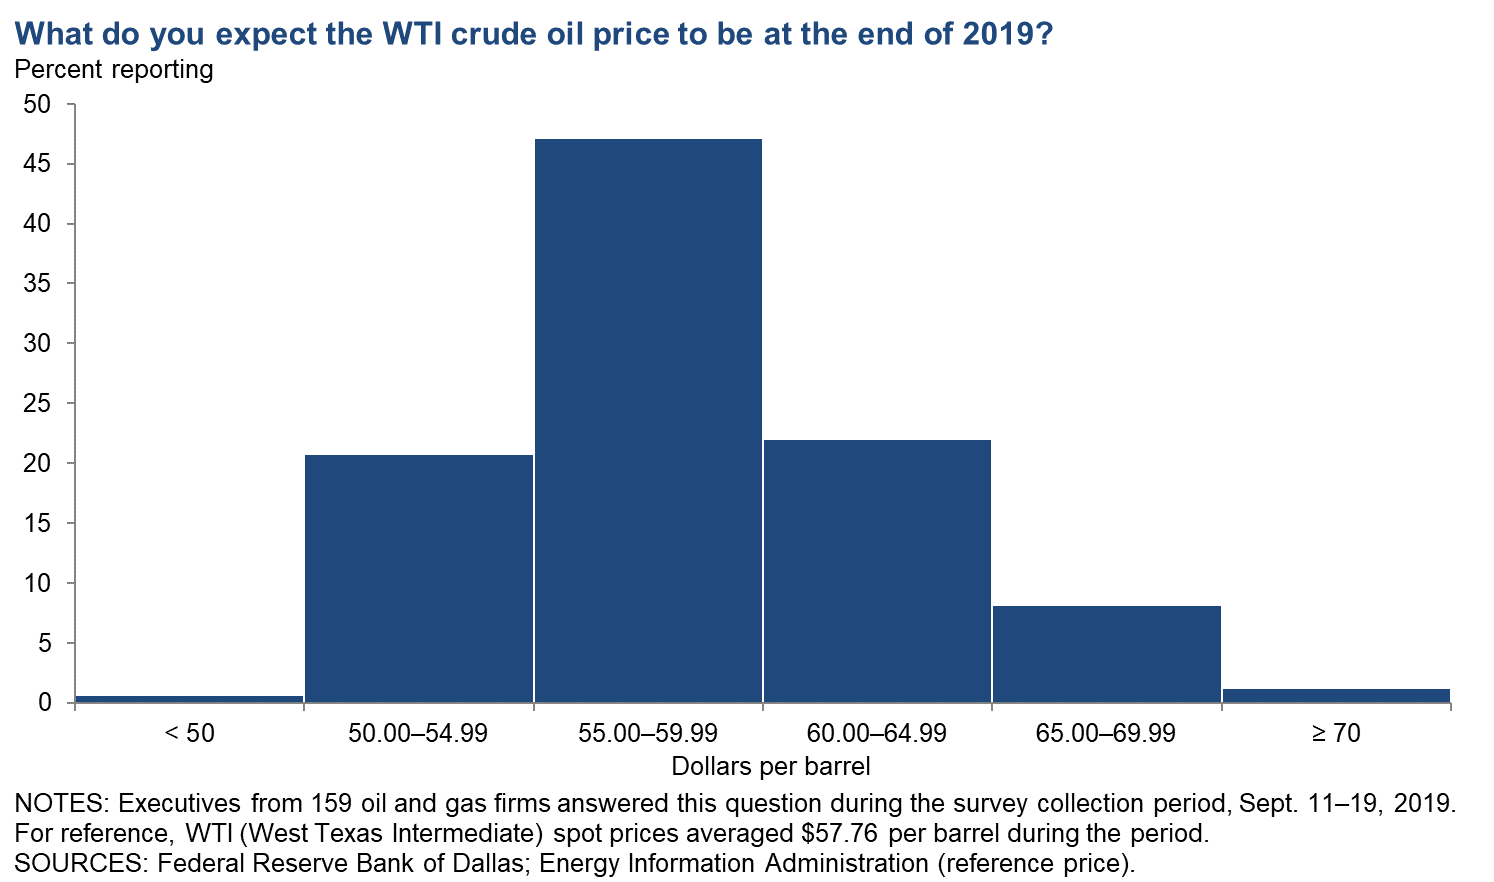
| West Texas Intermediate crude oil price (dollars per barrel), year-end 2019 | ||||
| Indicator | Survey Average | Low Forecast | High Forecast | Price During Survey |
Current quarter | $56.92 | $48.00 | $75.00 | $57.76 |
Prior quarter | $57.14 | $32.00 | $79.00 | $53.20 |
| NOTE: Price during survey is an average of daily spot prices during the survey collection period. SOURCES: Energy Information Administration; Federal Reserve Bank of Dallas. | ||||
Henry Hub Natural Gas
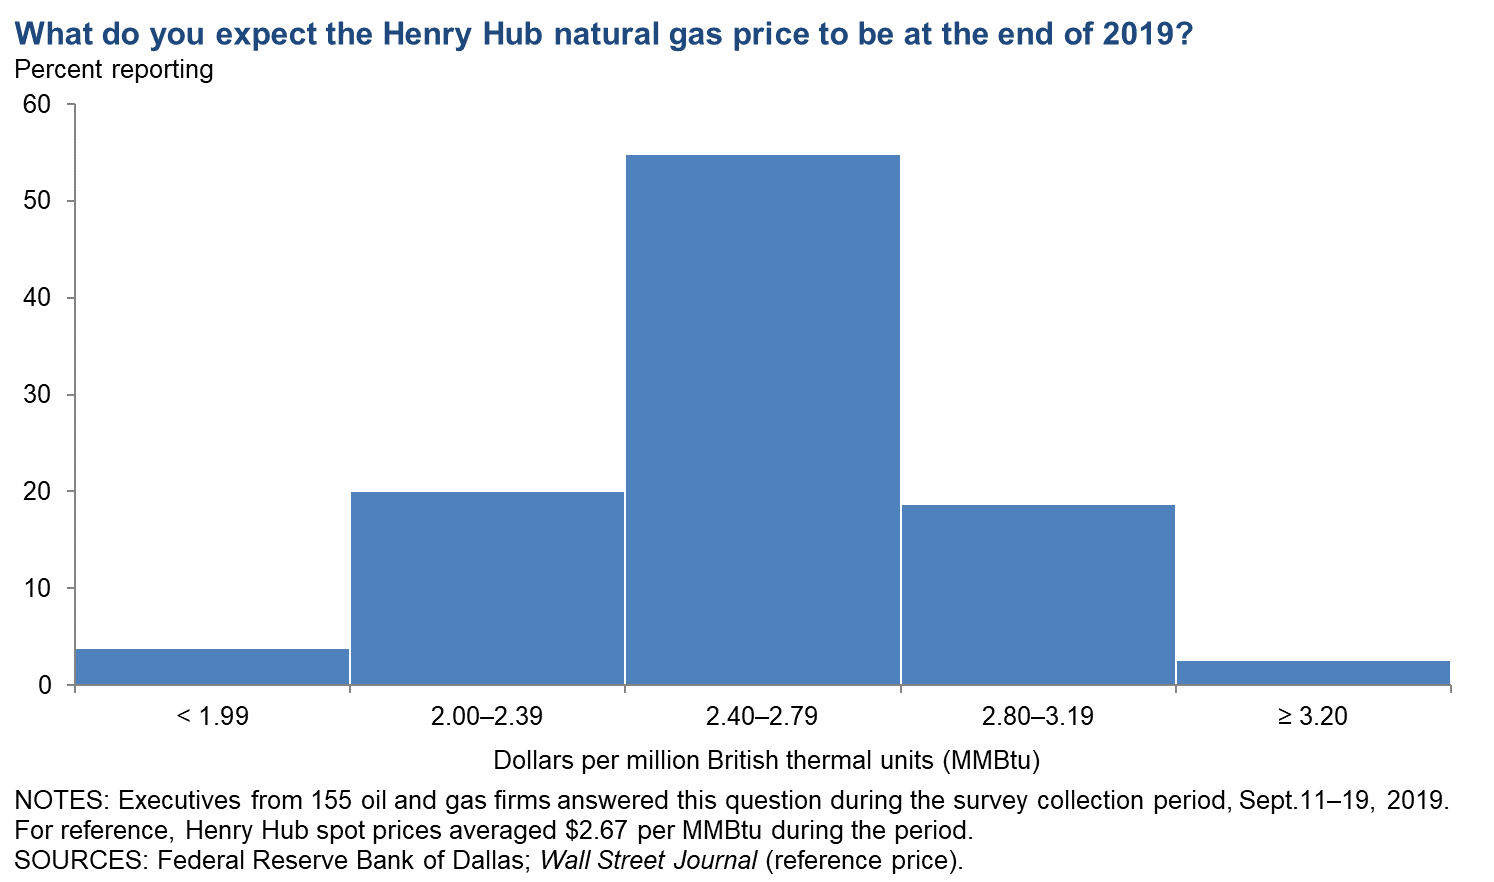
| Henry Hub natural gas price (dollars per MMBtu), year-end 2019 | ||||
| Indicator | Survey Average | Low Forecast | High Forecast | Price During Survey |
Current quarter | $2.54 | $1.50 | $3.50 | $2.67 |
Prior quarter | $2.67 | $1.75 | $4.00 | $2.42 |
| NOTE: Price during survey is an average of daily spot prices during the survey collection period. SOURCES: Federal Reserve Bank of Dallas; Wall Street Journal. | ||||
Third Quarter | September 25, 2019
Special Questions
Data were collected Sept. 11–19, and 156 oil and gas firms responded to the special questions survey.
Which of the following is the main constraint that is limiting near-term growth in activity in the top area in which your firm is active?
The most prevalent response across all respondents was low crude oil and/or natural gas prices (42 percent of respondents), followed by limited access to capital and credit (20 percent) and investor pressure to generate free cash flow (13 percent).
Additionally, we investigated a breakout of results between firms primarily active in the Permian Basin and firms active outside the Permian. In the Permian, 36 percent of respondents selected low crude oil and/or natural gas prices, followed by investor pressure to generate free cash flow (15 percent) and limited access to capital and credit (13 percent). Outside the Permian, nearly half of respondents—48 percent—selected low crude oil and/or natural gas prices, followed by limited access to capital and credit (25 percent) and investor pressure to generate free cash flow (12 percent). (See table for details.)
| Constraint | Percent Reporting | ||
| All Respondents | Permian | Outside Permian | |
| Current oil and/or natural gas price too low | 42 | 36 | 48 |
| Limited access to capital and credit | 20 | 13 | 25 |
| Investor pressure to generate free cash flow | 13 | 15 | 12 |
| Lack of natural gas pipeline capacity | 5 | 10 | 0 |
| Problems finding workers | 3 | 4 | 1 |
| Lack of crude oil pipeline capacity | 2 | 4 | 0 |
| Cost inflation | 2 | 3 | 1 |
| General infrastructure issues (roads, electricity, etc.) | 1 | 1 | 0 |
| Other | 12 | 12 | 12 |
| NOTE: Executives from 142 oil and gas firms answered this question during the survey collection period, Sept. 11–19, 2019. Of the 142 firms, 67 were primarily focused on the Permian, and 75 were focused outside the Permian. SOURCE: Federal Reserve Bank of Dallas. |
|||
Which of the following is the second-most-important constraint that is limiting near-term growth in activity in the top area in which your firm is active?
Many of those who didn’t select low prices as the primary constraint selected it as the secondary constraint. The most prevalent response for the second-most-important constraint was low crude oil and/or natural gas prices (27 percent of respondents), followed by problems finding workers (13 percent) and limited access to capital and credit (12 percent). Eighteen percent of respondents noted the primary constraint identified in the previous question was their only significant limitation. The results have also been broken out between firms focused on the Permian and firms focused outside the Permian. (See table for details.)
| Constraint | Percent Reporting | ||
| All Respondents | Permian | Outside Permian | |
| Current oil and/or natural gas price too low | 27 | 26 | 27 |
| Problems finding workers | 13 | 12 | 14 |
| Limited access to capital and credit | 12 | 12 | 12 |
| Investor pressure to generate free cash flow | 11 | 14 | 8 |
| Lack of natural gas pipeline capacity | 5 | 6 | 5 |
| Cost inflation | 5 | 8 | 2 |
| Lack of crude oil pipeline capacity | 4 | 8 | 0 |
| Other | 4 | 0 | 8 |
| General infrastructure issues (roads, electricity, etc.) | 2 | 2 | 2 |
| We are only constrained by the main constraint | 18 | 12 | 24 |
| NOTE: Executives from 131 oil and gas firms answered this question during the survey collection period, Sept. 11–19, 2019. Of the 131 firms, 65 were primarily focused on the Permian, and 66 were focused outside the Permian. SOURCE: Federal Reserve Bank of Dallas. |
|||
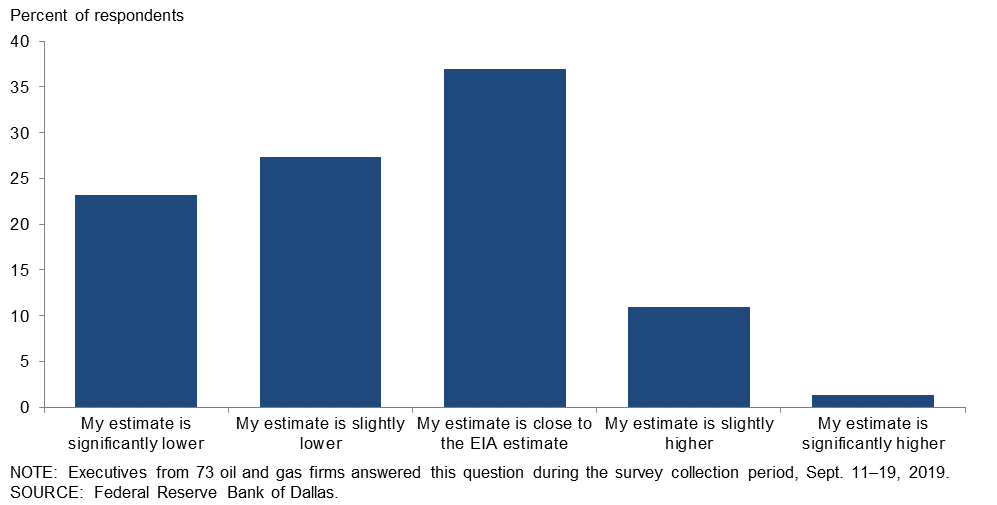
The Energy Information Administration (EIA) estimates that there are about 4,000 drilled but uncompleted wells (DUCs) in the Permian Basin. How does your estimate compare with the EIA figure for the number of DUCs in the basin?
Half of executives responding to this question said their estimate for the number of DUCs in the Permian Basin is lower than the EIA estimate, with 23 percent saying significantly lower and 27 percent saying slightly lower. Thirty-seven percent said their estimate is close to the EIA estimate, while 11 percent said it is slightly higher and 1 percent said it is significantly higher. (Percentages don’t sum to 100 due to rounding.)
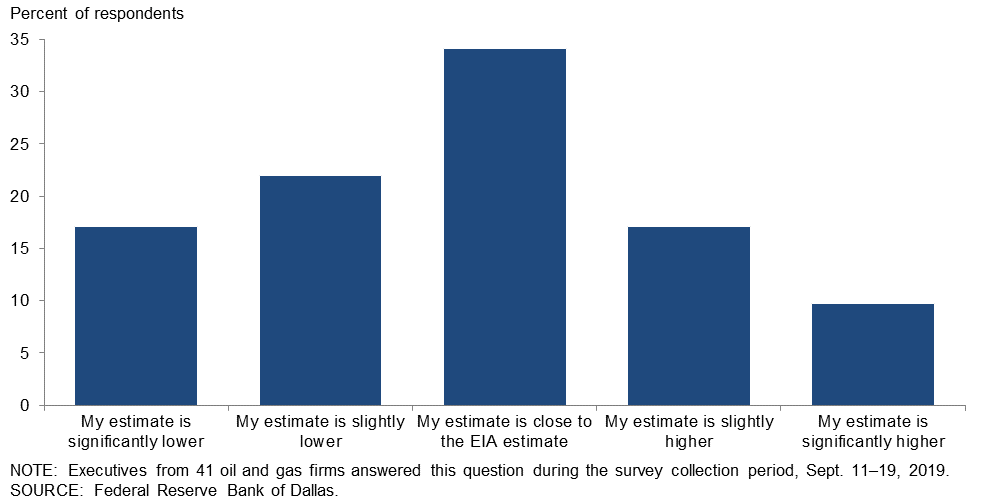
The Energy Information Administration (EIA) estimates that there are about 600 drilled but uncompleted wells (DUCs) in major gas basins (Appalachia and Haynesville). How does your estimate compare with the EIA figure for the number of DUCs in the basins?
Thirty-four percent of executives said their estimate of DUCs for the major gas basins is close to the EIA estimate. Thirty-nine percent of executives said their estimate is lower, of which 17 percent said significantly lower and 22 percent said slightly lower. Twenty-seven percent of executives said their estimate is higher, of which 10 percent said significantly higher and 17 percent said slightly higher.
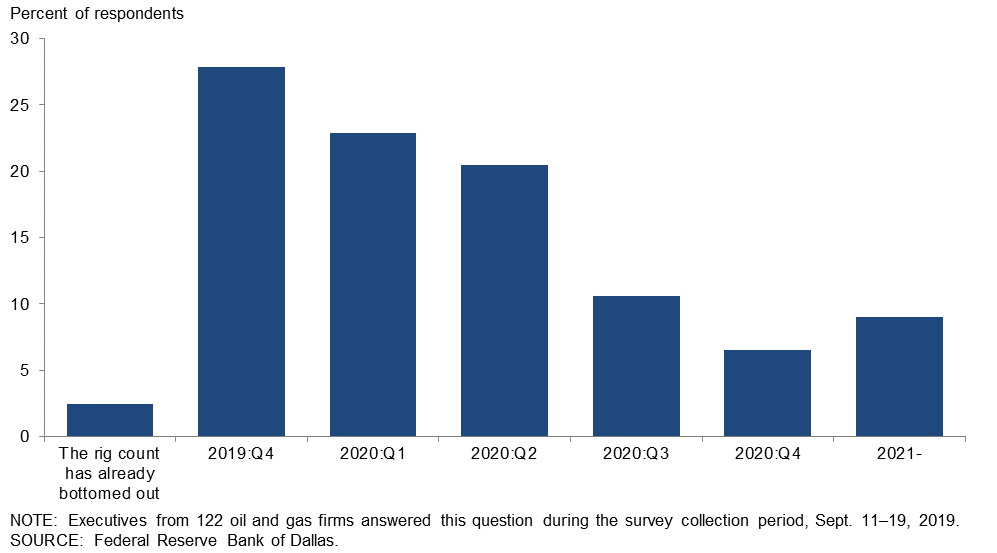
In which quarter do you expect the number of U.S. rigs drilling for oil to bottom out?
The most frequent response was fourth quarter 2019, identified by 28 percent of executives. Only 2 percent of executives believe that the number of U.S. rigs drilling for oil has already bottomed out. Twenty-three percent of executives selected first quarter 2020, 20 percent chose second quarter 2020 and the remainder (26 percent) said they believe the rig count will bottom out sometime after the second quarter 2020. (Percentages don’t sum to 100 due to rounding.)
Special Questions Comments
Exploration and Production Firms
- We expect industrywide drilling-and-completion capex [capital expenditures] spending to be down by about 10 percent in 2020.
- I feel like it would be worthwhile if the EIA [Energy Information Administration] would poll the major operators (the top 20–30 companies with the most rigs) under a defined definition of a drilled but uncompleted well (DUC), drilling vs. drilled for example, so the value would be reset to a more accurate estimate. My sense is the EIA DUC number implies more production capacity than actually exists and leads to downward revisions of supply estimates, which we have seen in the last six months.
- Unless prices improve, I think the rig count will continue to drop.
- We cannot have it both ways: There cannot be a flood of Permian production which depresses global commodity prices if capital inflows (i.e., new equity and debt issuances) are at all-time lows. Producers must reduce capital expenditures, which will have a positive effect on medium-term (two- to four-year) commodity prices.
- The overall industry conditions are not good. Prices are too soft and erratic, and costs are too high. My outlook for the business is pessimistic right now.
- The EIA has no clue on their estimated number of DUCs, in my opinion. Their current estimate is approximately 8,000 total DUCs in the U.S. The DUC definition needs to be defined as a well that has been drilled down to the producing formation and also drilled horizontally all the way to the end of the lease. In other words, for a Permian Basin well, that means a well which has been drilled 10,000 feet down and 10,000 feet out. What actually happens in the oil field is a smaller, “spudder” rig goes out to the lease first and drills down to approximately 1,500–2,000 feet and sets surface pipe, moves on to the next well, and does the same thing over and over. By doing this, the larger, bigger and more expensive drilling rig doesn’t have to spend its higher day rate to drill and set the surface pipe. What is occurring is the EIA is counting all of these 1,500–2,000-foot spudder wells in their total DUC count! Another thought to consider is, if these wells cost $4 million to drill and then another $5 million to complete—with 8,000 DUCs, with a $4 million per [well] drilling cost, that would be $32 billion. Is this the main E&P issue now? Have they truly spent $32 billion on just the drilling of these wells and they somehow have decided to leave them shut in and therefore not complete them when they desperately need the cash flow? I’ve spoken to several of the large shale operators in the Permian and they only have a few true DUCs on their books, not thousands. See if you can have the EIA readjust their number so the world knows the truth about how many true DUCs (all the way down and all the way out) are out there. I think the number will shock a few people.
- [One area of concern is] the regulatory environment: Protestors are so rude and ugly toward oil and gas but, yet, they want our money. Protestors do not have a solution to replace oil and gas in New Mexico. Renewables only contribute about 5 percent to the general fund of New Mexico, but oil and gas gives 30 percent. There is nothing that can take the place of oil and gas. Can the general public give up their cars, their cell phones, or their clothes? These are all made with oil and gas.
- Crude oil prices will need to drop to around $40 per barrel to find a bottom in the rig count.
- The question regarding when oil rig counts will bottom out cannot be answered due to an election coming next year, and also due to Middle East instability. Price is the control of rigs operating. Private equity is also controlling rig use. Over $130 billion of junk status bonds are coming due after 2020 over a two-year period for those that got in the treadmill drilling business, with wells that decline 70 percent in the first year. How many [wells] does it take to maintain volumes, much less grow them? Shale is like any zone. It has sweet spots and not-so-good spots for production. Guess what got drilled first to game the private equity and pension funds and other obligated institutions to find a level of return to service obligations?
Oil and Gas Support Services Firms
- As I am filling this out post-Saudi attacks, it appears that the worldwide oil industry is going to weather a 5 percent supply cut with minimal problems. I do not expect significant price increases beyond the $65 WTI [West Texas Intermediate] price, assuming there are no more supply disruptions.
- My assessment is the market is constrained by takeaway capacity, particularly in the northeast, where political adversaries are blocking projects. Bankruptcies are already occurring with E&P companies that would be successful if they could get their product to market. As a result, I expect a slow and continued decline in drilling, with a focus on streamlining operations.
Additional Comments »
Third Quarter | September 25, 2019
Historical data are available from first quarter 2016 to the most current release quarter.
Business Indicators: Quarter/Quarter
| Business Indicators: All Firms Current Quarter (versus previous quarter) | |||||
| Indicator | Current Index | Previous Index | % Reporting Increase | % Reporting No Change | % Reporting Decrease |
Level of Business Activity | –7.4 | –0.6 | 23.3 | 46.0 | 30.7 |
Capital Expenditures | –1.2 | –3.1 | 26.4 | 46.0 | 27.6 |
Supplier Delivery Time | –1.2 | –2.6 | 8.2 | 82.4 | 9.4 |
Employment | –8.0 | –2.5 | 14.7 | 62.6 | 22.7 |
Employee Hours | –2.4 | 3.1 | 17.2 | 63.2 | 19.6 |
Wages and Benefits | 6.2 | 14.5 | 13.0 | 80.2 | 6.8 |
| Indicator | Current Index | Previous Index | % Reporting Improved | % Reporting No Change | % Reporting Worsened |
Company Outlook | 0.0 | –4.5 | 25.2 | 49.7 | 25.2 |
| Indicator | Current Index | Previous Index | % Reporting Increase | % Reporting No Change | % Reporting Decrease |
Uncertainty | 38.0 | 50.0 | 47.2 | 43.6 | 9.2 |
| Business Indicators: E&P Firms Current Quarter (versus previous quarter) | |||||
| Indicator | Current Index | Previous Index | % Reporting Increase | % Reporting No Change | % Reporting Decrease |
Level of Business Activity | 0.0 | –5.0 | 25.0 | 50.0 | 25.0 |
Oil Production | 15.7 | 17.4 | 37.0 | 41.7 | 21.3 |
Natural Gas Wellhead Production | 6.5 | 13.4 | 29.9 | 46.7 | 23.4 |
Capital Expenditures | 3.7 | –6.1 | 29.6 | 44.4 | 25.9 |
Expected Level of Capital Expenditures Next Year | –4.7 | 7.1 | 22.4 | 50.5 | 27.1 |
Supplier Delivery Time | 0.0 | –1.0 | 7.6 | 84.8 | 7.6 |
Employment | –5.6 | –5.0 | 12.0 | 70.4 | 17.6 |
Employee Hours | 3.7 | 5.1 | 15.7 | 72.2 | 12.0 |
Wages and Benefits | 9.3 | 13.0 | 13.9 | 81.5 | 4.6 |
Finding and Development Costs | –14.2 | 3.0 | 7.5 | 70.8 | 21.7 |
Lease Operating Expenses | 5.7 | 12.4 | 17.8 | 70.1 | 12.1 |
| Indicator | Current Index | Previous Index | % Reporting Improved | % Reporting No Change | % Reporting Worsened |
Company Outlook | 7.6 | 2.0 | 27.6 | 52.4 | 20.0 |
| Indicator | Current Index | Previous Index | % Reporting Increase | % Reporting No Change | % Reporting Decrease |
Uncertainty | 44.4 | 55.0 | 50.0 | 44.4 | 5.6 |
| Business Indicators: O&G Support Services Firms Current Quarter (versus previous quarter) | |||||
| Indicator | Current Index | Previous Index | % Reporting Increase | % Reporting No Change | % Reporting Decrease |
Level of Business Activity | –21.8 | 6.6 | 20.0 | 38.2 | 41.8 |
Utilization of Equipment | –24.0 | 3.4 | 13.0 | 50.0 | 37.0 |
Capital Expenditures | –10.9 | 1.7 | 20.0 | 49.1 | 30.9 |
Supplier Delivery Time | –3.7 | –5.1 | 9.3 | 77.8 | 13.0 |
Lag Time in Delivery of Firm's Services | –13.0 | –10.2 | 0.0 | 87.0 | 13.0 |
Employment | –12.7 | 1.7 | 20.0 | 47.3 | 32.7 |
Employment Hours | –14.5 | 0.0 | 20.0 | 45.5 | 34.5 |
Wages and Benefits | 0.0 | 17.3 | 11.1 | 77.8 | 11.1 |
Input Costs | 5.6 | 27.1 | 16.7 | 72.2 | 11.1 |
Prices Received for Services | –18.5 | –12.1 | 7.4 | 66.7 | 25.9 |
Operating Margin | –24.0 | –32.8 | 16.7 | 42.6 | 40.7 |
| Indicator | Current Index | Previous Index | % Reporting Improved | % Reporting No Change | % Reporting Worsened |
Company Outlook | –14.8 | –15.7 | 20.4 | 44.4 | 35.2 |
| Indicator | Current Index | Previous Index | % Reporting Increase | % Reporting No Change | % Reporting Decrease |
Uncertainty | 25.4 | 41.7 | 41.8 | 41.8 | 16.4 |
Business Indicators: Year/Year
| Business Indicators: All Firms Current Quarter (versus same quarter a year ago) | |||||
| Indicator | Current Index | Previous Index | % Reporting Increase | % Reporting No Change | % Reporting Decrease |
Level of Business Activity | 1.3 | 11.2 | 37.8 | 25.6 | 36.5 |
Capital Expenditures | –1.3 | 9.4 | 34.6 | 29.5 | 35.9 |
Supplier Delivery Time | –3.3 | –4.7 | 9.9 | 77.0 | 13.2 |
Employment | –3.2 | 12.5 | 23.7 | 49.4 | 26.9 |
Employee Hours | –3.2 | 10.6 | 21.3 | 54.2 | 24.5 |
Wages and Benefits | 24.2 | 34.8 | 34.0 | 56.2 | 9.8 |
| Indicator | Current Index | Previous Index | % Reporting Improved | % Reporting No Change | % Reporting Worsened |
Company Outlook | –4.0 | –0.7 | 33.8 | 28.4 | 37.8 |
| Business Indicators: E&P Firms Current Quarter (versus same quarter a year ago) | |||||
| Indicator | Current Index | Previous Index | % Reporting Increase | % Reporting No Change | % Reporting Decrease |
Level of Business Activity | 6.8 | 5.4 | 38.8 | 29.1 | 32.0 |
Oil Production | 18.4 | 23.3 | 42.7 | 33.0 | 24.3 |
Natural Gas Wellhead Production | 16.7 | 15.6 | 40.2 | 36.3 | 23.5 |
Capital Expenditures | 0.0 | 6.4 | 35.9 | 28.2 | 35.9 |
Expected Level of Capital Expenditures Next Year | –8.9 | 9.6 | 24.8 | 41.6 | 33.7 |
Supplier Delivery Time | 0.0 | –2.2 | 9.0 | 82.0 | 9.0 |
Employment | 0.0 | 7.3 | 22.3 | 55.3 | 22.3 |
Employee Hours | 0.0 | 9.5 | 18.6 | 62.7 | 18.6 |
Wages and Benefits | 28.0 | 30.5 | 35.0 | 58.0 | 7.0 |
Finding and Development Costs | –11.0 | 3.3 | 14.0 | 61.0 | 25.0 |
Lease Operating Expenses | 8.0 | 8.7 | 23.8 | 60.4 | 15.8 |
| Indicator | Current Index | Previous Index | % Reporting Improved | % Reporting No Change | % Reporting Worsened |
Company Outlook | 2.1 | 3.4 | 35.1 | 32.0 | 33.0 |
| Business Indicators: O&G Support Services Firms Current Quarter (versus same quarter a year ago) | |||||
| Indicator | Current Index | Previous Index | % Reporting Increase | % Reporting No Change | % Reporting Decrease |
Level of Business Activity | –9.5 | 20.7 | 35.8 | 18.9 | 45.3 |
Utilization of Equipment | –11.6 | 17.8 | 28.8 | 30.8 | 40.4 |
Capital Expenditures | –3.7 | 14.3 | 32.1 | 32.1 | 35.8 |
Supplier Delivery Time | –9.7 | –9.0 | 11.5 | 67.3 | 21.2 |
Lag Time in Delivery of Firm's Services | –15.6 | –8.9 | 2.0 | 80.4 | 17.6 |
Employment | –9.4 | 21.1 | 26.4 | 37.7 | 35.8 |
Employment Hours | –9.4 | 12.2 | 26.4 | 37.7 | 35.8 |
Wages and Benefits | 17.0 | 42.1 | 32.1 | 52.8 | 15.1 |
Input Costs | 11.6 | 36.9 | 30.8 | 50.0 | 19.2 |
Prices Received for Services | –13.5 | –8.8 | 19.2 | 48.1 | 32.7 |
Operating Margin | –23.1 | –22.9 | 19.2 | 38.5 | 42.3 |
| Indicator | Current Index | Previous Index | % Reporting Improved | % Reporting No Change | % Reporting Worsened |
Company Outlook | –15.7 | –7.4 | 31.4 | 21.6 | 47.1 |
Third Quarter | September 25, 2019
Activity Chart
Third Quarter | September 25, 2019
Comments from Survey Respondents
These comments are from respondents’ completed surveys and have been edited for publication. Comments from the Special Questions survey can be found below the special questions.
Exploration and Production (E&P) Firms
- Each day is a new day and the market is heavily driven by events of the moment, which makes strategic planning more like strategic speculation. It seems that the supply side is likely to continue to outrun the demand side unless an “event” occurs that is perceived to restrict supply.
- The capital markets remain problematic. Access to capital will crimp the industry. It feels like employment in the sector will be decently lower in the next 12 months.
- Outspending cash flow, limited access to capital markets, and higher industry bankruptcies suggest lower activity [and] flat to lower production.
- The capital market has dried up for small E&P companies.
- Credit is tight for the industry. Banks have lowered their reserve-based lending leverage tests from 3.5–4.0x debt/EBITDA [debt to earnings before interest, tax, depreciation and amortization] to 2.5–3.0x, and calculated it on both a 12-month trailing basis, as in the covenants, and a latest-quarter annualized basis.
- Unless there is a material pullback, the environment is static around $55 per barrel and, even if your business is rock solid at this price, the capital markets aren't functioning well, so it’s hard to move off of the ”stuck” or “static” outlook.
- Barring any tit-for-tat escalation in the Middle East, oil markets should return to normal volatility by winter. But even if there is an escalation, the immediate benefit to U.S. independents will be lost because of their stupid practice of hedging with swaps.
- Overall sentiment is very negative due to low natural gas prices and lack of available funding for oil and gas exploration. Investors have been hard hit by catastrophic declines in the price of oil and gas securities. Additionally, many oil shale projects are failing to meet production projections. Oil service companies have no pricing power [and are] delivering services at rock bottom levels. Further cost declines will not be forthcoming. It seems no one has any money for oil and gas projects. Lack of Wall Street participation in oil is very apparent.
- Talk about carbon tax increases. Early proposals of “only” $25.00 per ton of CO2 equate to roughly $10.50 per barrel of oil at the wellhead. Now [environmentalists] are talking about an initial carbon tax of only $42.00 per ton of CO2 ($17.64 per barrel of oil at the wellhead). That would kill the independent arena of the U.S. domestic oil industry that just vaulted America to the world’s #1 oil producer spot. And people would be willing to sacrifice that contribution to the U.S. trade balance [and] domestic employment, as well as tax payments to states? It’s a sad testimonial to the decline of the American educational system! Interest rate cuts are greatly appreciated as that will help a little on cash flow.
- Tariff diplomacy continues to have a minor to meaningful impact on our supply chain, in particular products. There is a great need for incremental state and federal investments in fundamental infrastructure in the Permian [Basin] to keep up with increased usage and expansions. Power distribution bottlenecks and expansion timing are becoming a critical inhibitor to business investments and employment. Public Utility Commission intervention may become necessary.
- Once again, my concern is that oil prices are not based on an efficient market, but on synthetic inputs that artificially buoy prices. The latest evidence of this is Saudi's reduced oil production in order to boost valuations for the Saudi Aramco initial public offering. Nine investment banking firms are going to be involved in providing the "right" valuation. I'm sure that their recommendation is going to be to keep supplies tight to ensure the highest valuation possible. So, what will be the next synthetic input to keep oil prices from being determined by an efficient market?
- New Mexico politics are a worry to our industry that is unnecessary and uncalled for.
- Index prices—West Texas Intermediate (New York Mercantile Exchange) for oil, Henry Hub for gas—no longer mean anything. The real-world differentials from these indices are huge. Gas gatherers and purchasers are gouging the upstream industry like never before. In one case, nearly two-thirds of my 8/31/19 gas check was taken out for gathering fees, and gas liquids were valued at $0 per barrel but had an additional fee charged for the “privilege” of said purchaser taking them from our wellhead.
- The oil majors are divesting assets to buy other assets. This has opened a big window of opportunity for smaller and mid-size operators. Majors overlook reserves that do not meet their requirements in terms of value.
- Tariffs have resulted in cost escalation over the past 18 months. The price volatility of oil has resulted in an inability to project much more than three months into the future (absent use of financial hedges). Pipeline capacity constraints, with associated handling costs, are causing gas price suppression at the Waha natural gas hub [in West Texas].
- We are seeing increased costs in supplies, and vendors are attributing the increases to tariffs.
- The general quality of acquisition opportunities is increasing.
Oil and Gas Support Services Firms
- U.S. oil production is about to fall significantly. The rig count has declined dramatically from one year ago (down 170 rigs), and our customers are not completing wells in order to save cash flow. This all equals a big shift down.
- Uncertainty created by E&P companies’ foggy outlook is creating significant challenges for oilfield services.
- The market is going sideways, or potentially worse. Small players are under increasing pressure.
- Oversupply of hydraulic fracturing capacity and reduced activity by customers have put extreme pressure on pricing. Most hydraulic fracturing providers feel that the current pricing is unsustainable over the medium to long term.
- We are seeing a general slowdown in M&A [mergers and acquisitions] and the start-up of exploration projects.
- Competition is high for skilled field service personnel such as roustabouts and specialized oilfield truck drivers. Wages and benefits are at an all-time high, yet prices for our services are unchanged. Margins become smaller every year due to E&P [firms] tightening down on all aspects of their expenses.
- The attack on Saudi [Arabian] oil facilities increased the price for the moment, but unless more dramatic things happen in the Middle East, I expect the price to fall back to current levels. If prices remain in the current range, there will be significant reductions in drilling and completion of Permian Basin horizontal wells. The industry is admitting what independents who drilled with industry partners early on figured out: You cannot make money drilling at this price structure. An ongoing drilling program consumes all your returns and continues to require new money. Payouts take too long, and making 2-to-1 on your money will take 15 to 20 years if you ever get there. Reserves have been overestimated significantly. The big private equity money had all it could stand of outgo and no appreciable return, with more consolidations to come. We found an ocean of oil and gas in the Permian, but its long-term development and utilization will require massive amounts of capital, and its returns will solidify for those with the capital to deploy with long-term strength. Economically, this does not favorably support large independents.
- There has been a definite decrease in the outlook, attributable to the trade war and economic slowdown in the European Union.
- With continued price suppression, look for more M&A activity among service providers.
- Our business has not gotten any better.
- There are so many factors influencing the price of oil, all of which are uncertain, that it is difficult to guess what the price of oil will be. Gas prices continue to be quite soft, although the Wall Street Journal reports LNG [liquefied natural gas] prices to be increasing.
- My company is a small pick-up-and-trailer company. One of my major clients is a large oilfield services firm. I was informed by their main office in Houston that I had to increase my cargo insurance from $100,000 to $500,000 if I planned to continue to receive their business. I explained to their office rep that I don’t carry any equipment for them worth $500,000, but I had no luck in changing their mind. I can’t get that amount of insurance because the insurance companies don’t understand why I would need that much insurance. I have not had a call from the oilfield services company for a month. Again, I am pushed out by bigger companies. I provided great service for the company and others.
- Our business is very challenging. E&P companies have pulled back on spending and continue to pressure service company prices. I expect there will be a number of insolvent companies looking for help in the next six months.
Questions regarding the Dallas Fed Energy Survey can be addressed to Michael Plante at Michael.Plante@dal.frb.org or Kunal Patel at Kunal.Patel@dal.frb.org.
Sign up for our email alert to be automatically notified as soon as the latest Dallas Fed Energy Survey is released on the web.