Consumer surveys suggest economic conditions remain healthy but growth is slowing
The current divergence between two prominent consumer confidence indexes suggests that policymakers need to be mindful of a U.S. economy in transition. This comes as growth in the manufacturing sector and business investment has stagnated over the past several quarters. Total economic growth has remained near trend because solid consumption growth has proven resilient to these headwinds.
Real personal consumption expenditures (PCE) also started to show signs of slowing, rising 2.2 percent annualized over August and September, compared with 4.8 percent annualized growth over March through July. A looming question is whether the slowing is a benign moderation to trend or weakness in business investment feeding into consumption.
Consumer surveys indicate sentiment
Surveys of consumer confidence are timely indicators of how consumers perceive current and expected economic conditions. The Conference Board (consumer confidence) and the University of Michigan (consumer sentiment) publish the two best-known surveys.
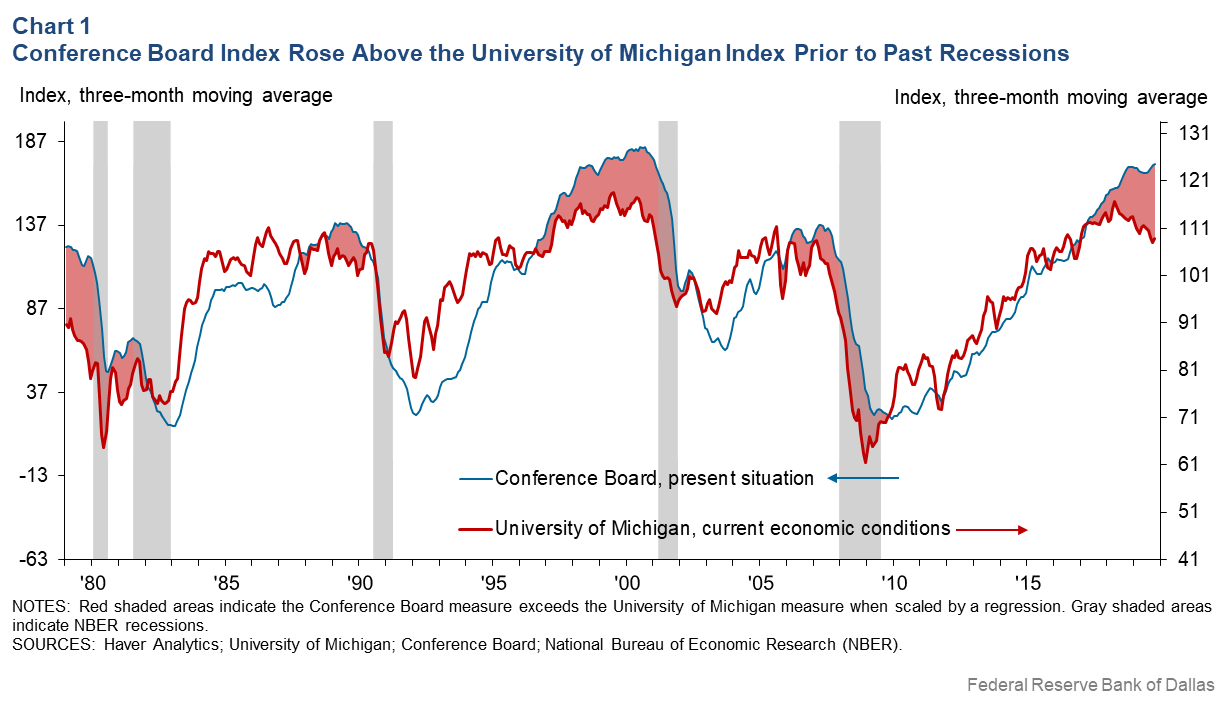
Although slightly below its post-Great Recession high in late 2018, consumer confidence remains about 30 percent higher than its level in 2014, based on a three-month moving average that helps minimize “noise” in the data. Meanwhile, the consumer sentiment index in October dropped to its lowest value since 2016 and has remained mostly flat since December 2014, well below the consumer confidence index (Chart 1). Understanding what drives these differences is important to assessing the state of the consumer.

Divergence between these two measures is typical late in the business cycle. Each survey is composed of two subcomponents: current conditions and expectations of future conditions. Perceptions about current economic conditions primarily drive the cyclicality of the gap between the two surveys, while the expectations components are highly correlated.
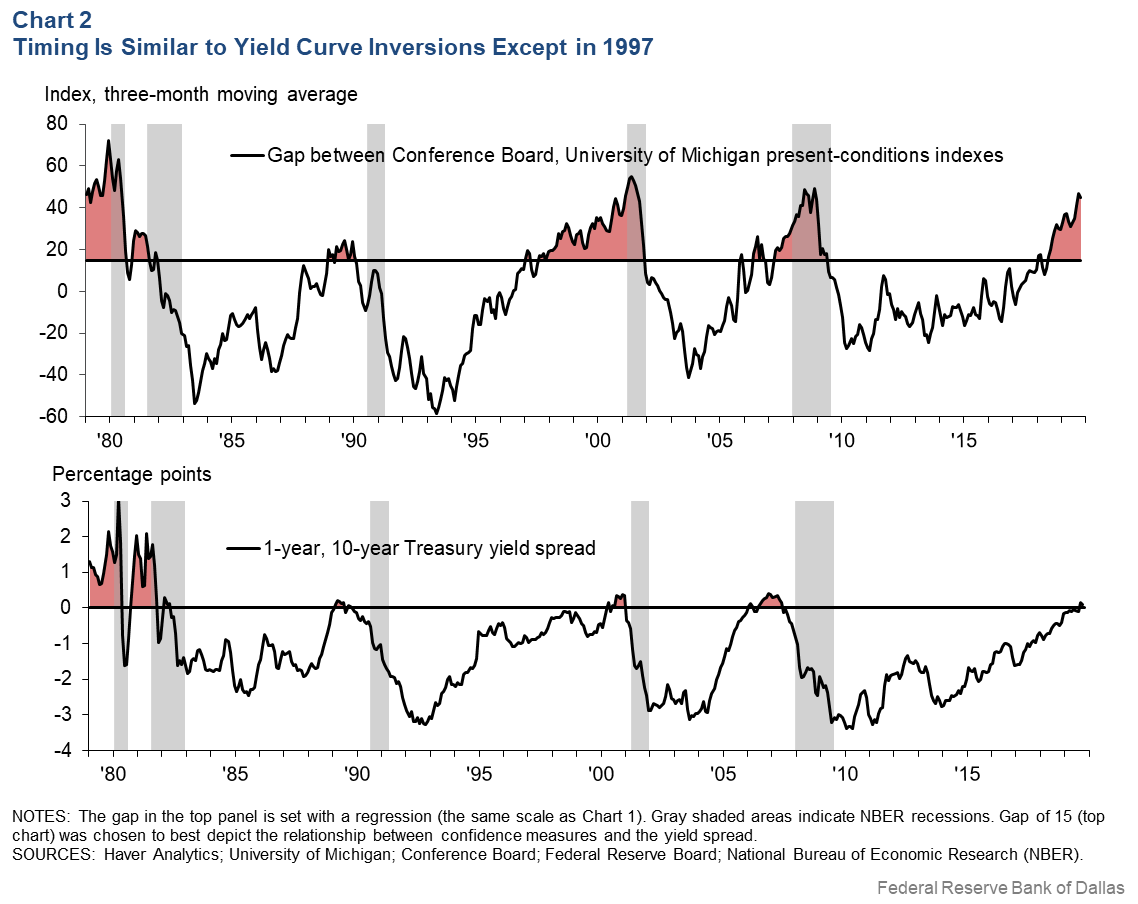
After appropriately scaling the indexes to account for the differences in their volatilities, it becomes clear that the “present conditions” subcomponent of the Conference Board index has exceeded its University of Michigan counterpart prior to every recession since 1978, with minimal false signals, as Chart 1 shows. Furthermore, the timing is very similar to yield curve inversions, although the 2001 recession was signaled early in 1997, while the yield curve did not invert until 2000 (Chart 2).

The recession signal from the consumer surveys has two drawbacks. First, the size and timing of the gap between the two indicators depends on their relative scales, which are set in Chart 1 using a regression. Second, there is no systematic way to interpret the size of the gap between the two surveys. In Chart 2, a threshold of 15 in the moving average of the gap between the surveys signals every recession while minimizing how early the signal occurs before the 2001 recession. However, the optimal threshold may vary over time, making it difficult to interpret the signal. The yield curve, on the other hand, has a natural threshold of “0” (when the short-term yield exceeds the long-term yield).
What the survey gap signals
It is important to understand the mechanism underlying a recession signal to avoid a spurious correlation. The consumer confidence index is based on questions that focus on the level of present conditions (i.e., ratings of business conditions and job availability), while consumer sentiment is in part based on how economic conditions have changed (i.e., “Would you say that you are better off or worse off financially than you were a year ago?” and “Do you think now is a good or bad time for people to buy major household items?”).
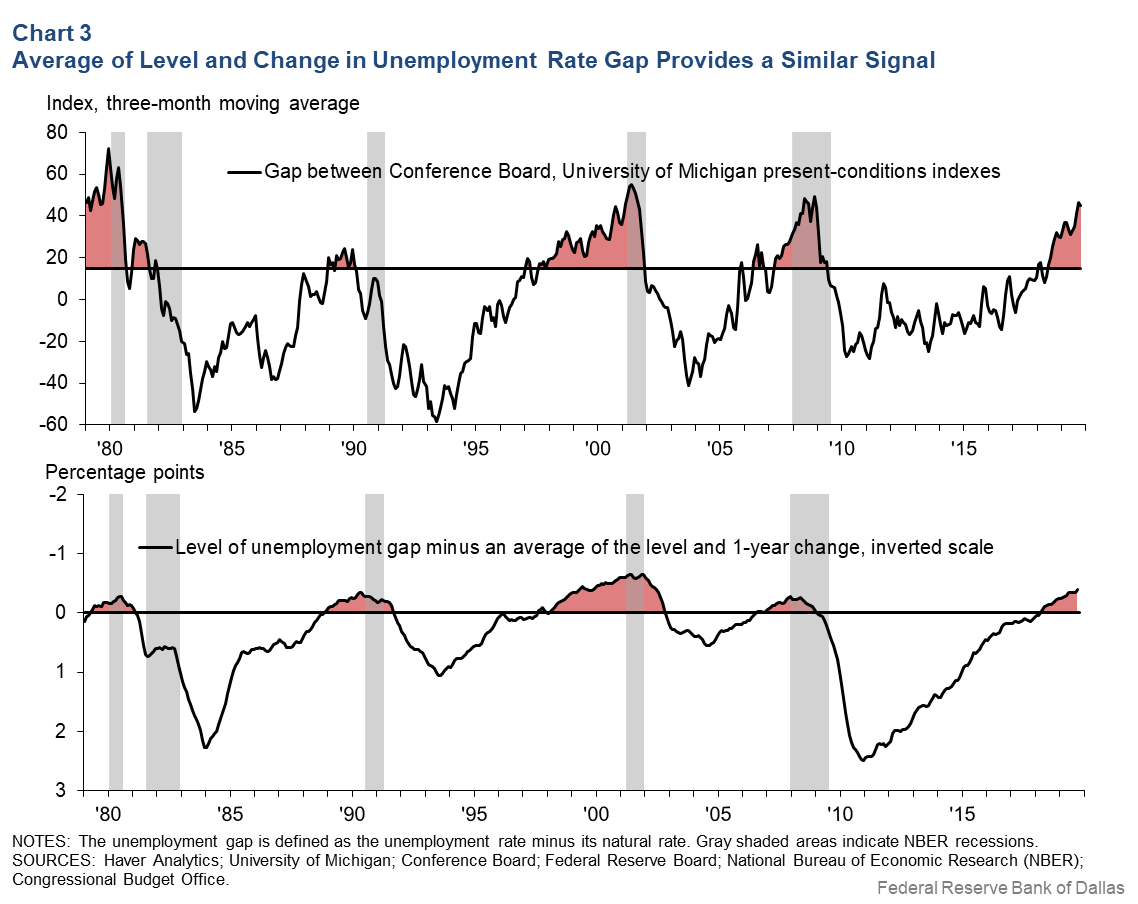
A regression of each survey measure on the unemployment gap—the actual unemployment rate minus the natural rate (the presumed unemployment rate absent the business-cycle effects) reported by the Congressional Budget Office—and the one-year change in the unemployment gap uncovers the drivers of each series.
The results indicate that both factors (the unemployment gap and the change in the unemployment gap) equally affect consumer sentiment. However, consumer confidence is almost exclusively explained by the level of the unemployment gap. Therefore, the difference between the unemployment gap and an average of the two factors provides a recession signal resembling the gap between the consumer confidence and consumer sentiment indexes (Chart 3).

The current gap between the two consumer surveys is signaling that the labor market is tight but has stopped becoming tighter. This is consistent with many other indicators, such as the unemployment rate and gross domestic product growth.
Lessons from the past
Some have argued that unlike in past recessions, a yield-curve inversion is not a strong indicator of a recession because there are other factors placing downward pressure on long-term interest rates, such as bond purchases by global central banks. One might conclude that the gap between the consumer confidence and consumer sentiment indexes is an independent corroboration of the recession signal from the yield curve, despite the gap’s known drawbacks.
The track record of the yield curve and consumer surveys may just be an artifact of past business cycles that did not result in “soft landings,” in which the labor market stabilizes at a tight level. Without soft landings, slowing growth from tight economic conditions always leads to a recession, though this may not be an immutable characteristic of the U.S. economy.
Economic research finds that monetary policy should respond to signs of slowing growth before it arrives when there is a risk of hitting the effective lower bound on the Federal Reserve’s benchmark policy rate. If such preemptive policy actions were successful at preventing a recession, they would break the predictive power of the signals from the yield curve and consumer surveys.
In this case, the message from both indicators would not be that a recession is inevitable but that growth is likely slowing and policymakers should remain vigilant to these developments.
About the Authors
The views expressed are those of the authors and should not be attributed to the Federal Reserve Bank of Dallas or the Federal Reserve System.

