
Marrying for money ends up reducing income inequality
Men and women in a targeted search for a mate tend to rank potential matches on the basis of “attractiveness,” which can be a single trait or a combination of attributes. The traits could include education, age and income. Our model of matching behavior may help explain recent U.S. dating patterns both online and through traditional “offline” means, as shown in a previous post.
One attribute, money, may be a particular source of attractiveness.
Regardless of their own income, people seek out potential matches at the upper echelon of the income distribution in the marriage market. Our findings show that, by generating matches with dissimilar income levels within the pair—often because the ideal match isn’t made—the marriage market constitutes a way to ameliorate income inequality in the U.S. and to create bridges across the income ladder.
Choosing a mate based on education
Income inequality increased substantially from 1960 to 2005, University of Pennsylvania economist Jeremy Greenwood and his co-authors show. They attribute a large part of the increase to assortative (nonrandom) spousal matching based on education—that is, more-educated husbands matching with more-educated wives.
In particular, they argue that an increase in the Gini coefficient—a common measure of income inequality—from 0.34 to 0.43 is largely attributable to similar educational attainment within a couple. (The Gini coefficient is “0” if the total income of a group of individuals or households is distributed equally among them and is “1” if the distribution is maximally unequal—for example, if all the income goes to only one of member of the group.)
Technological improvements in “home production”—less time for household maintenance activities—explain some of the change. The decrease in time spent at home led to an increase in labor force participation among married women, academic studies have suggested. This change, together with changes in the structure of women’s market wages, increased the value of women’s market productivity in the mating equation.
This dynamic led to the increased assortativeness—more mating of educated men and women—and exacerbated inequality.
Imperfect coupling among men, women
Why haven’t we achieved perfect assortativeness—the pairing up of men and women whose attributes are very similar? A common explanation lies in “marital bliss”—shorthand for the idiosyncratic sources of happiness that introduce an element of randomness into the matching process.
Our data tell a different story. Conflicting motives can lead to miscoordination, in which everyone targets the best available candidate in the market. Looking only at income, the best available candidate happens to be the richest potential match. As a result, less assortativeness is the equilibrium outcome.
Based on our theoretical framework, we can test to what extent this is true in the most recent data. We use matching rates for men and women, calculated from the Census Bureau’s American Community Survey for 2017, to estimate men’s and women’s preferences with respect to their partner’s income.
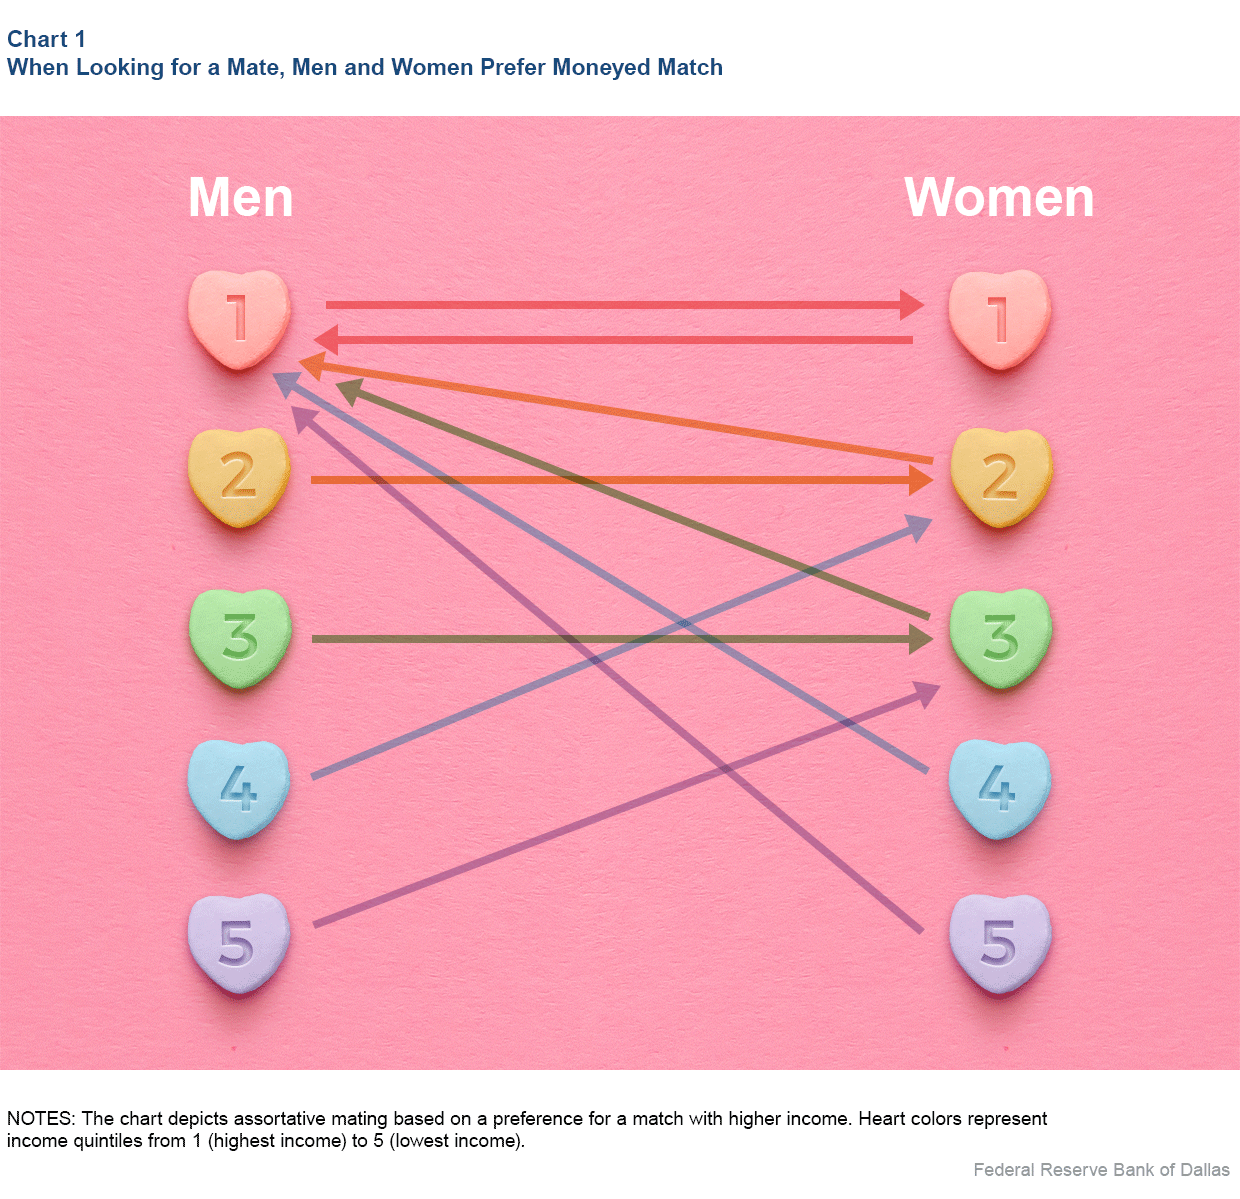
Looking at the data through the lens of the model, we observe vertical preferences—men and especially women tend to prefer partners with the highest income. In equilibrium, both men and women generally target partners with an income that is higher than their own, as illustrated in Chart 1. Heart colors represent income quintiles from highest to lowest (men on left, women on right), with arrows showing the direction of general interest.
Based on joint incomes of married pairs in the sample, we can construct the household income distribution for married couples. For comparison, we also construct artificial income distributions for three thought experiments:
- If men and women were marrying within the income group (positive assortative matching).
- If men and women were allocated to each other randomly (uniform random).
- If high-earning men were marrying low-earning women, and vice versa (negative assortative matching).
Impact of trying to marry for money
Chart 2 plots the share of total income on the vertical axis versus the share of the population (when sorted by income from lowest to highest) on the horizontal axis. A point such as 0.3 on the horizontal axis and 0.1 on the vertical axis—which lies close to the black curve representing the data—indicates that the bottom 30 percent of households by income receive just 10 percent of the total income of the population. The dotted 45-degree line represents perfect equality. Inequality under each scenario, as measured by the Gini coefficient, is also shown.
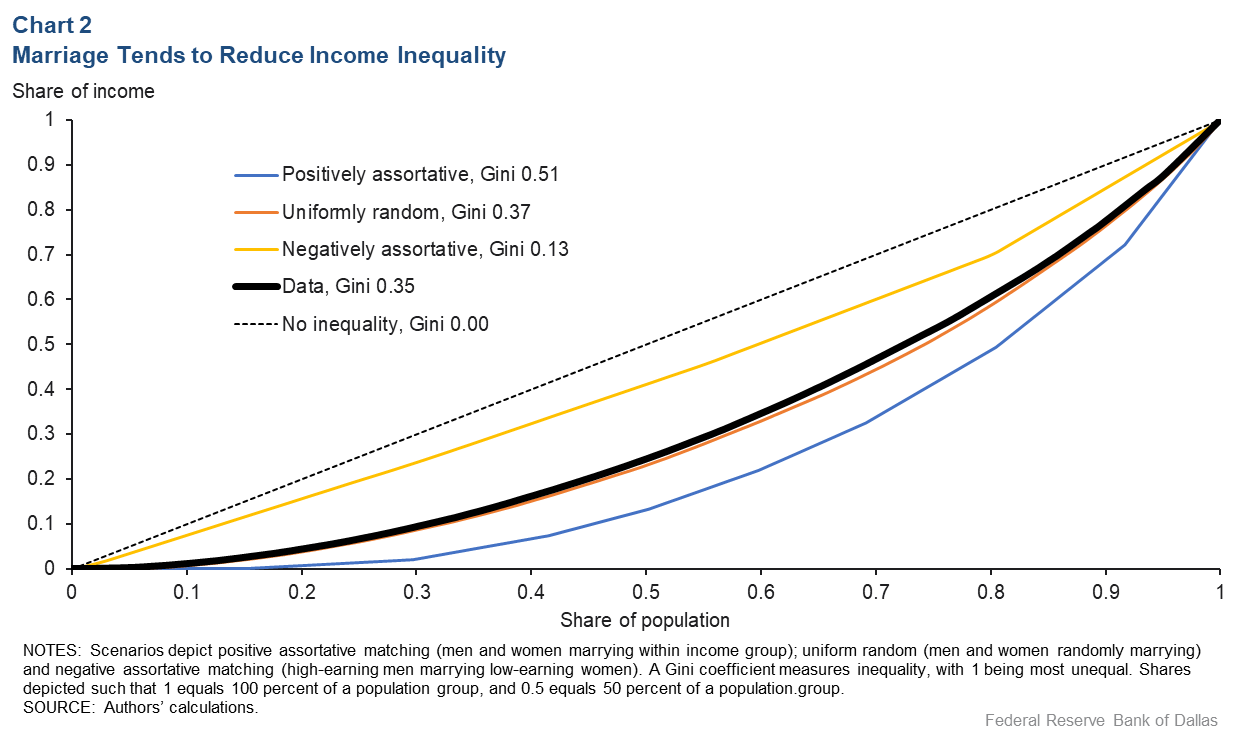
We find that the income distribution in the data has less inequality (a Gini coefficient of 0.35) compared with both the assortative matching case (0.51) and even the purely random matching outcome (0.37). It would take artificially marrying high earners with low earners to reduce inequality below what is in the data.
We think the reason for this surprising finding is the strategic behavior of both men and women. Any person in the market has an incentive to target potential partners with higher income than their own in the hope that such a desired match, who isn’t perfectly capable of distinguishing among suitors, reciprocates.
People collectively reaching up the desirability ladder (based on income) create additional matches between high earners and low earners, thus reducing inequality.
While this analysis is limited to income, the model can be applied to multiple characteristics relevant in searching for a partner both sequentially and simultaneously.
About the Authors

Anton Cheremukhin
Cheremukhin is a senior research economist in the Research Department at the Federal Reserve Bank of Dallas.
Antonella Tutino
Tutino is a senior research economist in the Research Department at the Federal Reserve Bank of Dallas.
The views expressed are those of the authors and should not be attributed to the Federal Reserve Bank of Dallas or the Federal Reserve System.