
Gasoline demand more responsive to price changes than economists once thought
Recent advances in applied work have overturned decades of conventional wisdom regarding how consumers respond to gasoline price fluctuations.
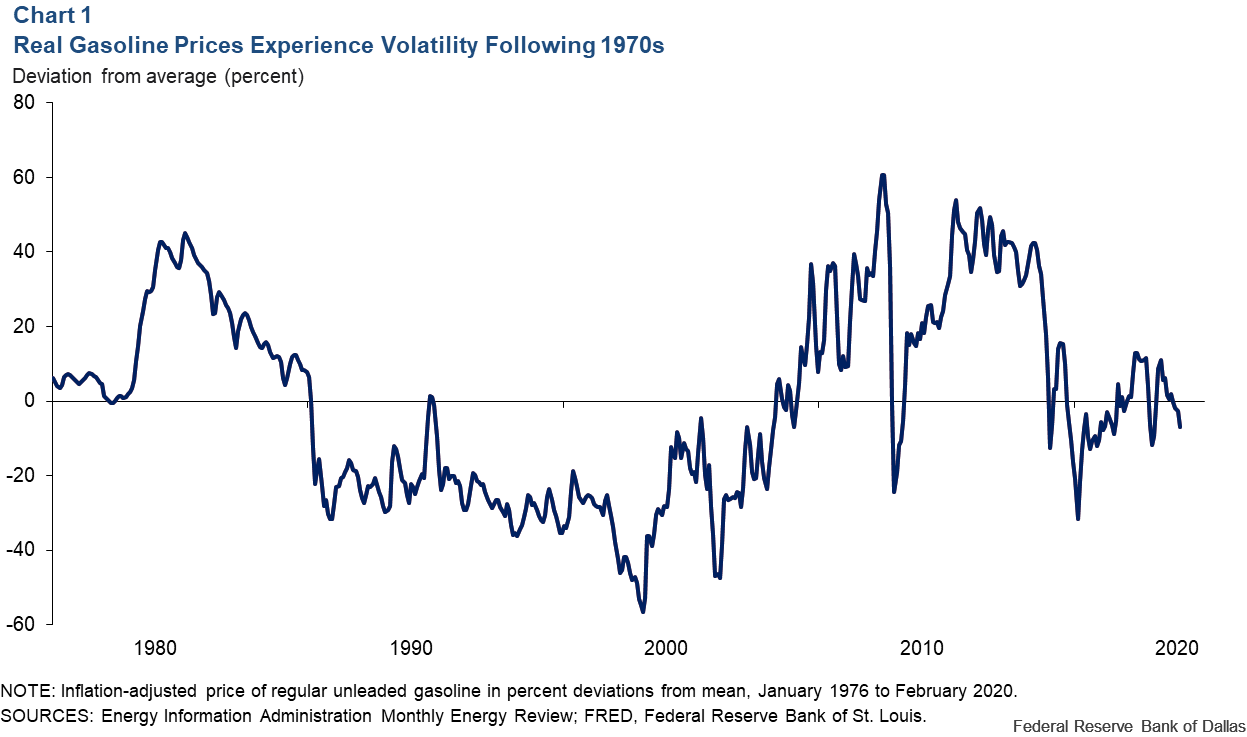
Real (inflation-adjusted) gasoline prices have fluctuated substantially since the 1970s (Chart 1). Understanding the responsiveness of gasoline demand to these price changes is crucial to understanding the macroeconomic effects of gasoline price fluctuations, assessing the impact of refinery supply disruptions, determining gasoline tax rates, and evaluating policies targeting pollution, congestion and climate change.
What is the price elasticity of gasoline demand?
There is evidence that periods of rising real gasoline prices are associated with reduced gasoline consumption. The price elasticity of gasoline demand is a widely used measure of the responsiveness of gasoline consumption to a change in gasoline prices that is not driven by demand. An elasticity value of -1, for example, means that for every 1 percent increase in the real price of gasoline, gasoline consumption falls by 1 percent. An elasticity value of 0, in contrast, means that consumption does not respond to a change in the price of gasoline.
It is widely understood that most consumers rely on gasoline purchases to commute to work and, hence, find it difficult to reduce their gasoline consumption when faced with higher gasoline prices. Over time, gasoline demand becomes more elastic, as consumers may trade in their cars for more fuel-efficient models or move closer to work, for example, in response to higher gasoline prices.
The conventional view
A large body of empirical literature dating back to the 1970s and 1980s has reported estimates of the short-run price elasticity of gasoline demand. Some of these studies rely on time series data of gasoline usage and average prices at the national level. Other studies exploit variation in gasoline prices across regions or countries.
There is a widespread view among economists that the demand for gasoline is comparatively inelastic. This view is rooted in surveys of elasticity estimates published before 2000, including studies by Carol Dahl and Thomas Sterner in 1991, by P.B. Goodwin in 1992 and by Molly Espey in 1998.
Some more recent studies suggest that gasoline demand became even less elastic in the 1990s and 2000s. For example, the U.S. Energy Information Administration in 2018 reported estimates between -0.01 and -0.04, and a widely cited academic study by Jonathan E. Hughes, Christopher R. Knittel and Daniel Sperling in 2008 made the case for gasoline demand elasticities between -0.03 and -0.08.
New estimation methods, new data
As improved estimation methods have been developed and as higher-quality data have become available, longstanding estimates have been called into question. One new development has been an increasing recognition of the importance of isolating variation in gasoline prices that is not driven by consumers’ demand for gasoline.
In one of the first studies to address this point, John Coglianese, Lucas W. Davis, Lutz Kilian and James H. Stock in 2017 exploited the variation in gasoline taxes across states to show that the short-run U.S. price elasticity of gasoline demand is -0.37 in the aggregate. This estimate far exceeds what Hughes and his coauthors found, for example. It accounts for the ability of consumers and retailers to store fuel in anticipation of a gasoline tax increase and does an excellent job of predicting the effects on gasoline consumption resulting from the supply shock caused by hurricanes Rita and Katrina in August–September 2005.
Another development has been the use of disaggregate data from unconventional sources. Two recent studies using such data have independently corroborated our conclusions. First, a study by Laurence Levin, Matthew S. Lewis and Frank A. Wolak in 2017 examined daily credit card purchases of gasoline.
These data have three potential advantages: (1) They allow gasoline prices to differ by local area; (2) they allow the demand relationship to differ across locations; and (3) they measure more precisely the timing of the change of consumer gasoline prices. Notwithstanding these differences, the authors report estimates of the U.S. price elasticity of gasoline demand ranging from -0.27 to -0.35, only slightly lower than the estimate in the earlier study of Coglianese and coauthors.
Second, a working paper by Charles R. Knittel and Shinsuke Tanaka issued in 2019 used driver-level data from Japan collected from mobile phone applications. Their estimate of the short-run price elasticity of Japanese gasoline demand is -0.37, similar to the U.S estimates.
Reconciling these findings with earlier work
Thus, recent estimates of the short-run price elasticity of gasoline demand are five to 25 times larger than traditional estimates. An obvious question is why do economists disagree so much on this important question? The analysis by Levin and his coauthors provides valuable clues.
They document that estimating the gasoline demand elasticity based on time series data, as has been common in the past, causes severe aggregation bias. When aggregating their daily driver-level data to monthly national gasoline expenditures and average gasoline prices, the implied time series estimate of the gasoline demand elasticity is indistinguishable from zero, mirroring the findings of earlier studies based on aggregate time series data.
As the authors note, this result helps explain why earlier time series studies such the 2008 article by Hughes and his coauthors produced gasoline demand elasticity estimates that are strongly biased toward zero. They conclude that panel data studies such as the state-level analysis of Coglianese and his coauthors, in contrast, are largely immune from these aggregation biases and produce elasticity estimates that closely agree with estimates based on high-frequency disaggregate data.
Thus, we can attribute the much lower elasticity values reported in the earlier literature to the use of flawed estimation methods and/or questionable data.
What explains the responsiveness of consumers?
The interesting economic question is why the fuel consumption responses are so strong. Clearly, in the short run, consumers won’t choose to replace their vehicle with a more fuel-efficient one. There are other margins of adjustment, however. For example, consumers may reduce their discretionary driving.
The data in the study by Knittel and Tanaka for Japan show that, indeed, about 81 percent of the reduction in fuel consumption in response to higher gasoline prices results from drivers traveling fewer miles, with the remaining 19 percent resulting from changes in driver behavior such as a more fuel-conserving driving style or improved vehicle maintenance.
About the Authors

Lutz Kilian
Kilian is a senior economic policy advisor in the Research Department at the Federal Reserve Bank of Dallas.

Xiaoqing Zhou
Zhou is a senior economist in the Research Department at the Federal Reserve Bank of Dallas.
The views expressed are those of the authors and should not be attributed to the Federal Reserve Bank of Dallas or the Federal Reserve System.