
Commuting patterns during COVID-19 endure; minorities less likely to work from home
COVID-19 forced many businesses to scale back or cease operations in their regular workplaces because of government-mandated closures, concern for employee health or lack of customers.
Some workers transitioned to working from home relatively easily. In many jobs, however, performing regular work activities from home is impossible, forcing many individuals to become inactive or look for a new job.
In earlier research based on data from the Real Time Population Survey, a novel online labor survey of households, we found that 35.2 percent of those employed in May worked entirely from home, up sharply from 8.2 percent of those employed in February. Subsequently, we find a bounce-back since May in employment growth within the previously low work-from-home sectors.
Many continue working from home daily
Chart 1 compares the February commuting behavior of the workforce (ages 18 to 64) with commuting behavior in subsequent months. Changes in commuting patterns during the pandemic are the combined effect of increases in working from home and decreases in employment.
To better distinguish between the role of home-based work and declines in employment, all numbers in Chart 1 are expressed as fractions of February employment rather than as of the workforce in the current month.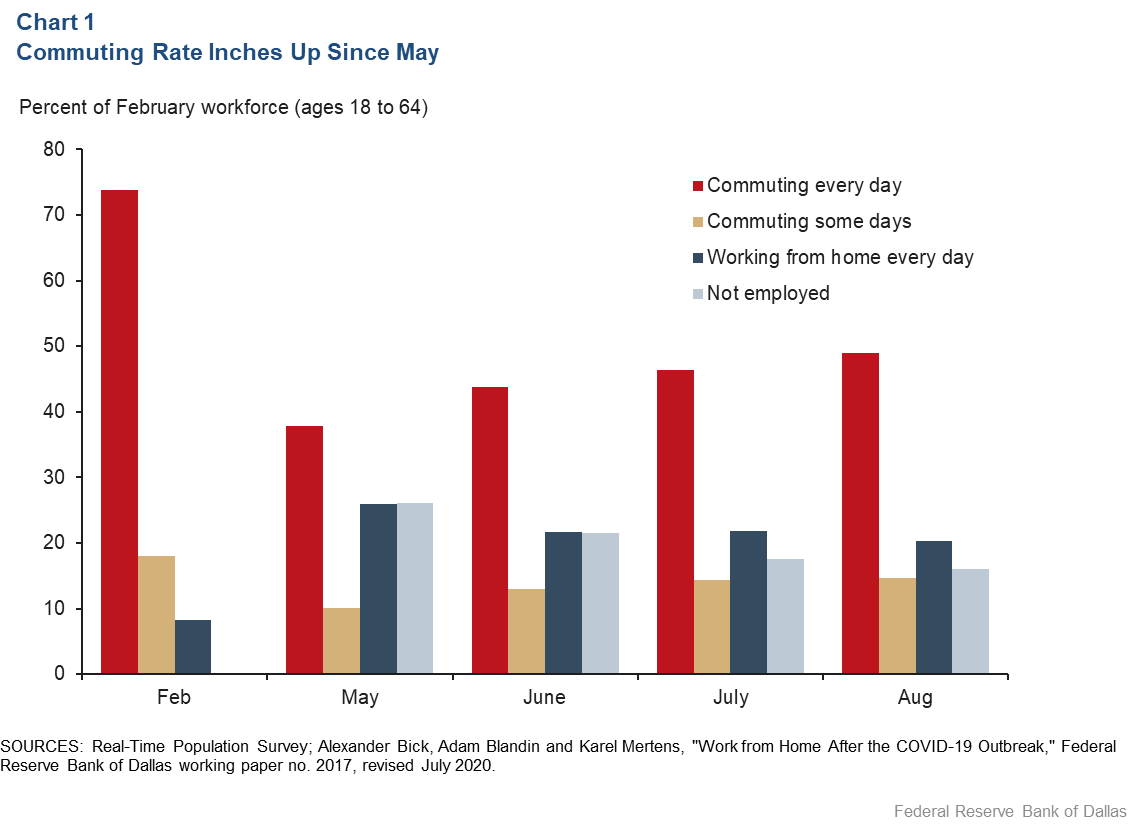
In May, only 37.8 percent of the pre-pandemic workforce commuted on a daily basis, compared with 73.8 percent in February. At the same time, the share working entirely from home rose from 8.2 percent in February to 26.0 percent in May (both as a fraction of February employment). Moreover, 26.1 percent of workers were no longer employed in May.
Since May, the number of daily commuters (as a fraction of pre-pandemic employment) rose gradually to 49.0 percent in August—still well below pre-pandemic levels. Over the same time period, the share of nonemployed decreased to 16.0 percent of February employment.
The fraction of entirely home-based workers declined slightly in August relative to earlier in the pandemic but remained very high at 20.3 percent. As a ratio of actual employment rather than pre-pandemic employment, 24.2 percent of workers ages 18 to 64 worked entirely from home in August, down from 35.2 percent in May.
Differences by education, ethnicity persist
The increase in work from home has been particularly pronounced for some categories of workers. While there was no notable difference in work from home by education level in February, the left panel of Chart 2 shows very pronounced differences in the work-from-home rates by education emerging during the course of the COVID-19 outbreak.
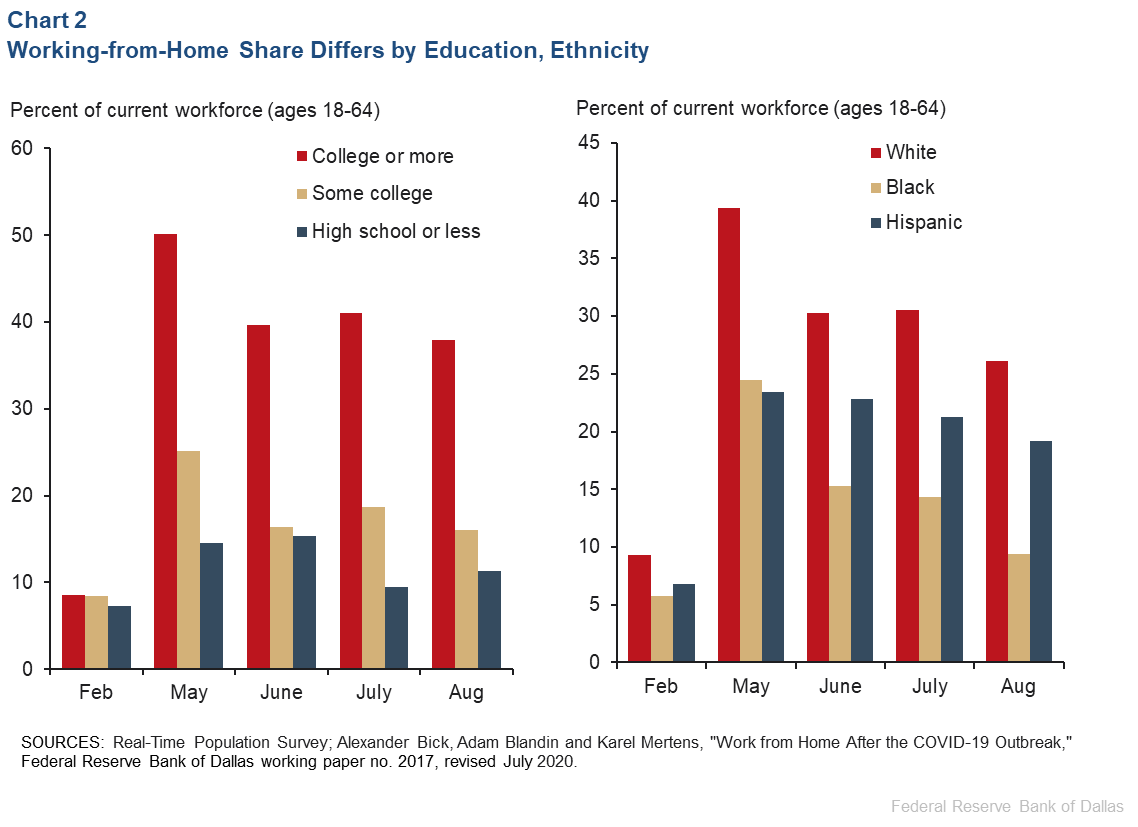
Only 14.6 percent of workers with a high school degree or less worked from home in May, compared with 50.2 percent of workers with a college degree or higher. These large differences in work-from-home rates by education level persisted in subsequent months.
Chart 2, right panel, shows that many more white workers were working from home than Black or Hispanic workers. The work-from-home rate for white workers decreased from 39.4 percent in May to 26.1 percent in August. The share of Hispanic workers working from home decreased much less, from 23.4 percent in May to 19.2 percent in August. The work-from-home rate for Black workers, on the other hand, decreased the most, from 23.4 percent in May to 9.4 percent in August.
Low work-from-home sectors see larger job gains in recent months
Employment losses following the COVID-19 outbreak were widespread across industries but were much larger in some than in others. While this variation is influenced by many factors, our research indicates that differences in the potential for home-based work across industries are important.
A larger fraction of home-based workers in May is associated with lower declines in industry employment during that month (Chart 3).
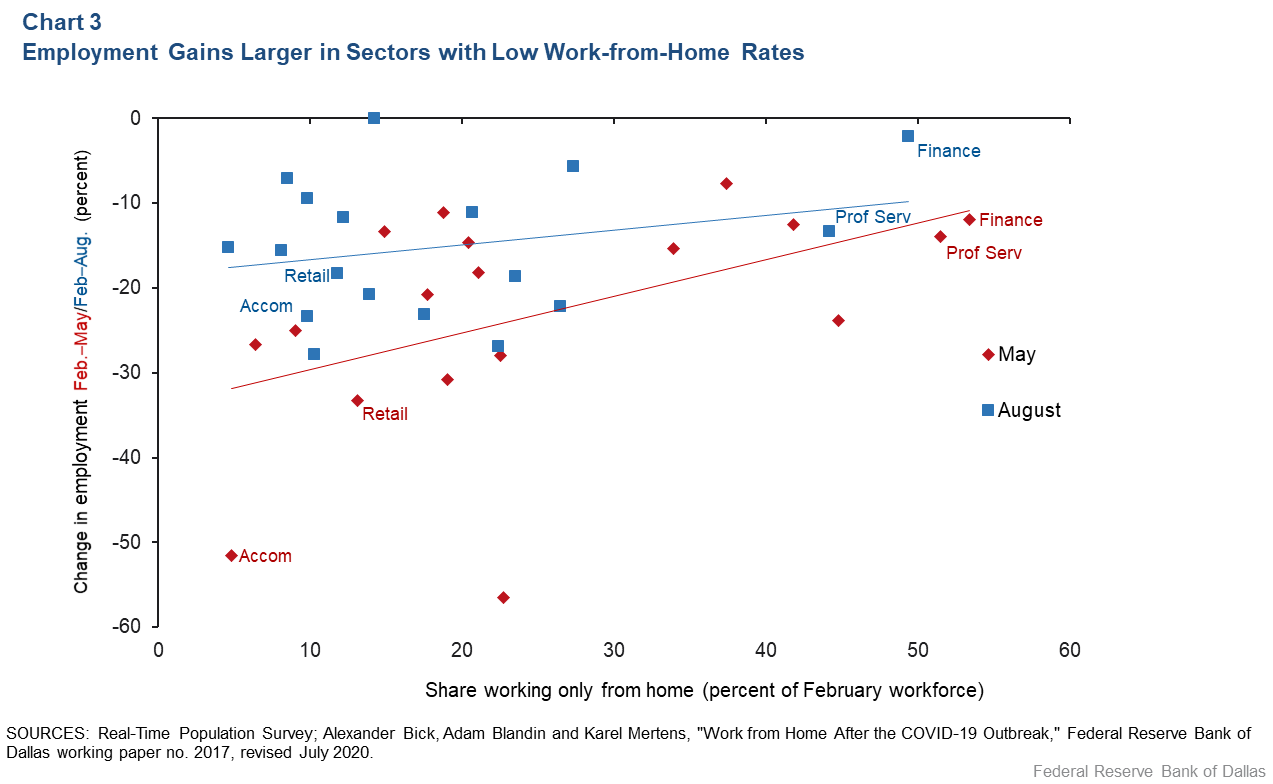
Contact-intensive sectors such as retail and accommodations (the hospitality industry) experienced greater reductions in employment and lower rates of work from home in May. Other sectors such as finance and professional and business services, noted a relatively small drop in employment and higher rates of work from home.
In August, the relationship between employment losses relative to February and work-from-home rates remained but was weaker because of a relatively stronger bounce-back in employment in low work-from-home sectors during the summer.
About the Authors

Alexander Bick
Bick is an associate professor at W.P. Carey School of Business at Arizona State University.

Adam Blandin
Blandin is an assistant professor in the Department of Economics at Virginia Commonwealth University.

Karel Mertens
Mertens is a senior economic policy advisor in the Research Department at the Federal Reserve Bank of Dallas.
The views expressed are those of the authors and should not be attributed to the Federal Reserve Bank of Dallas or the Federal Reserve System.