
Supplier networks transmit Fed rate moves through economy
An important way monetary policy affects the economy is through household spending. When the Federal Reserve increases or lowers interest rates, the effects do not end with just the businesses most exposed to the resulting changes in household spending.
A shift in demand for cars, for example, can affect tire makers, rubber producers and energy suppliers. Those follow-on effects can then spread further through the economy and, in some cases, loop back to the firms first affected.
New research suggests those supplier-customer links may account for much of how monetary policy is transmitted. Using industry stock market returns around scheduled Federal Open Market Committee (FOMC) announcements as a real-time gauge of expected changes in future cash flows, the research finds that production networks explain a large share of the overall response to monetary policy shocks. Network effects account for roughly 55 to 85 percent of the total response. Similar patterns later appear in sales and operating income.
Directly affected industries tell only part of the story
Changes in interest rates affect household spending, and thus one may be tempted to conclude that this impact is concentrated among industries directly selling to households. But the larger story is what happens next. When demand changes for final goods and services, firms change their purchases of intermediate inputs. Suppliers then adjust their own orders, and the effects keep moving through the production network.
In an event-study sample, a 1 percentage point surprise increase in the federal funds target rate lowered broad stock prices by roughly 3 percent within a 30-minute window. Those high-frequency market moves are then combined with information on the producer-supplier linkages among industries to estimate how much of the reaction reflects direct exposure to the rate increase and how much reflects network spillovers.
Chart 1 shows why that distinction matters. The chart tracks how much of the total stock-market response is captured as more layers (outdegrees) of the production network are added. Zero on the horizontal axis means only the direct effect is included; each additional step adds another round of supplier-customer linkages.
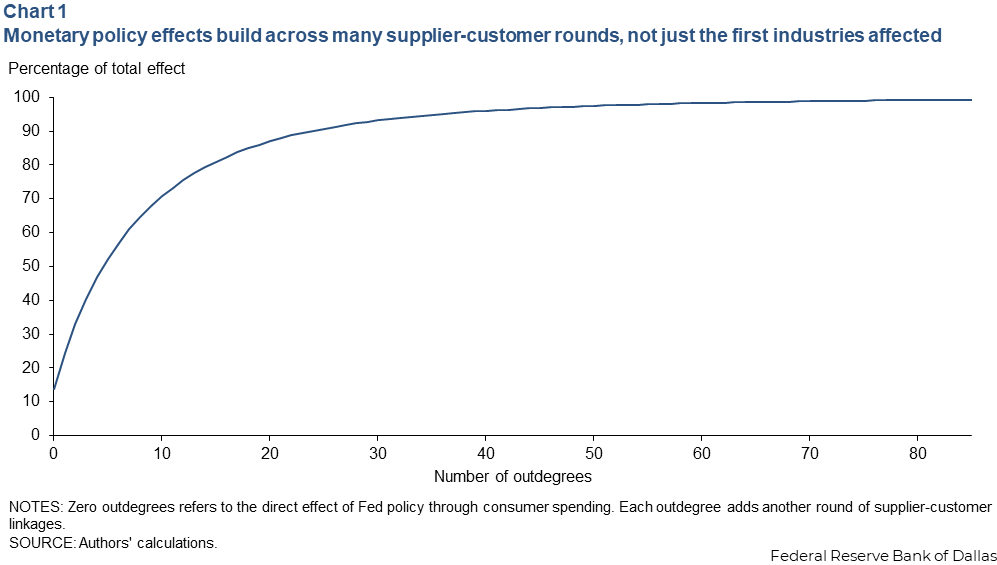
The direct effect captures only about 14 percent of the total response. Even 10 rounds of follow-on supplier-customer effects account for only 71 percent of the total effect. In other words, a large share of the total effect reflects longer chains of linkages rather than only the industries initially exposed.
Monetary policy shows up in how industries move together
A second pattern points in the same direction. Industry stock returns are highly correlated in the narrow window around FOMC announcements. The average correlation is about 0.67 on FOMC announcement dates, with 1 indicating perfect correlation. When compared with an average correlation of 0.32 on non-FOMC dates, the high correlation on FOMC dates indicates that monetary policy makes stock prices move together more closely. Our results suggest that this comovement can be largely attributed to network effects.
Chart 2 shows the return correlations between industries before and after the estimated network effects are removed. Each square represents the correlation between two industries on the chart axis around Fed announcements; darker colors indicate stronger comovement.
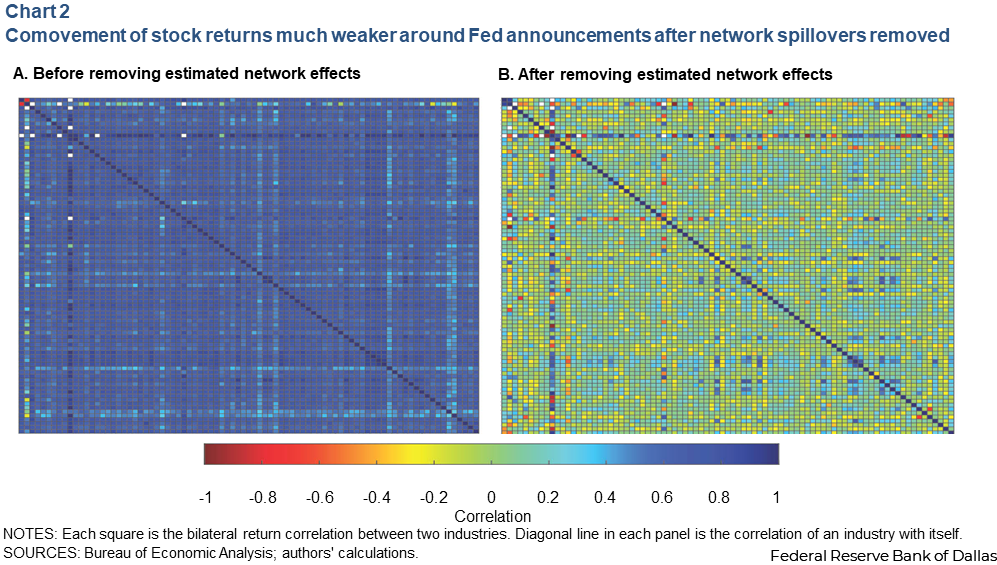
The left panel shows the strong comovement in industry returns around Fed announcements. The right panel shows weaker comovement, once network spillovers are stripped out. (The diagonal line represents the comovement of an industry with itself.) The average off-diagonal correlation falls to 0.043, suggesting that production networks explain much of the common movement seen on policy dates.
Industries closer to consumers respond differently
Not every sector reacts the same way. We find that industries that sell more directly to end consumers show larger direct effects. Upstream sectors feel more of the shock through network spillovers. That pattern fits a demand-based story: Policy first affects spending on consumer goods and services. The effect then travels through purchases of intermediate inputs.
The network channel does not appear to be only a short-lived market-pricing pattern. Similar effects also show up later in realized fundamentals such as sales and operating income. Network effects account for about 60 percent of their response and build for several quarters after the initial policy shock.
Why network structure matters for policy
The large network spillovers are not mechanical. In simulations, hypothetical input-output networks that match broad features, such as the density of supplier-customer links or the overall distribution of link strengths, do not produce effects as large as those in the data. What matters is the actual structure of the U.S. production network—not just the fact that firms are connected.
The policy implication is straightforward. The documented importance of networks has important implications for how we think about and model the impact of monetary policy. Monetary policy does not travel only through borrowing costs or the sectors that households touch first. It also moves through the web of supplier relationships that ties industries together. If production networks explain most of the total response to policy surprises, models that ignore them may miss an important part of how the Fed affects the real economy.
About the authors

Ali Ozdagli is an assistant vice president in the Research Department at the Federal Reserve Bank of Dallas.

Michael Weber is a professor of finance at the Daniels School of Business at Purdue University.