
Climbing the employment ladder tough when bottom rung is broken
Recent labor market data appear to reflect a low-hire, low-fire equilibrium. Because aggregate layoffs remain low by historical standards, the upward drift in the unemployment rate over the past two years is often viewed as a benign normalization process rather than a cyclical vulnerability.
However, aggregate metrics may obscure the heterogeneous labor-demand conditions job applicants face depending on their employment status. These metrics also do not account for secular changes in the U.S. labor force.
When adjusted for underlying structural trends, the data suggest the U.S. economy is operating in a regime characterized by reduced hiring and rising firing (hire-less, fire-more) for the unemployed, while simultaneously sustaining a comparatively robust and insulated market for employed workers.
Assessing aggregate stabilization
Recent mixed-headline data have suggested that the labor market may be finding a new normal. Payroll numbers have swung from beating expectations to sudden contractions. Meanwhile, the unemployment rate has fluctuated around 4.3 to 4.4 percent.
These aggregate measures mask two distinct dynamics: workers moving between unemployment and employment (which affects the unemployment rate), and employed workers switching between jobs (which does not). Headline hiring figures conflate both flows.
This makes it challenging to tell, at a glance, whether a strong payroll print reflects genuine job creation for the unemployed, or primarily job-to-job transitions among currently employed workers. While this internal churn drives higher wages and productivity for incumbents, it can mask an underlying weakness in unemployment dynamics.
U.S. labor market dynamics are overwhelmingly driven by a dual labor market structure, recent research suggests. In this scenario, roughly 55 percent of the population exists in a primary sector, which is characterized by high wages, immense job stability and almost zero unemployment risk.
Meanwhile, all of the volatility, accounting for 61 percent of total unemployment and the vast majority of business cycle fluctuations, is concentrated in a much smaller secondary sector comprising just 14 percent of the population.
This split helps contextualize conflicting data. What shows up as aggregate stabilization is the net result of two opposing forces. The first is a recovering market for primary-sector incumbents. And the second is a steadily deteriorating market for secondary-sector participants finding fewer new opportunities.
To visualize this divide, it is useful to think of the labor market as a job ladder. The “upper rungs” represent the domain of these primary-sector workers, while the “lower rungs” serve as the entry point for the secondary-sector labor force and the unemployed.
Layoff rates in historical context
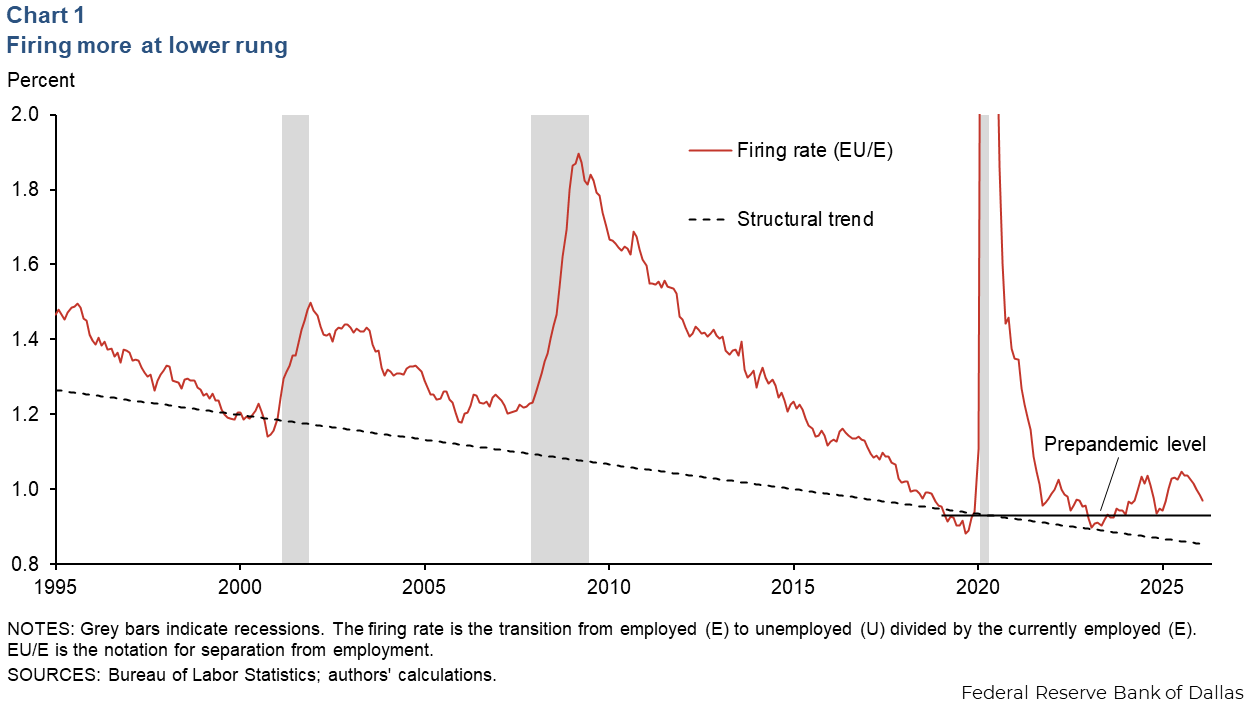
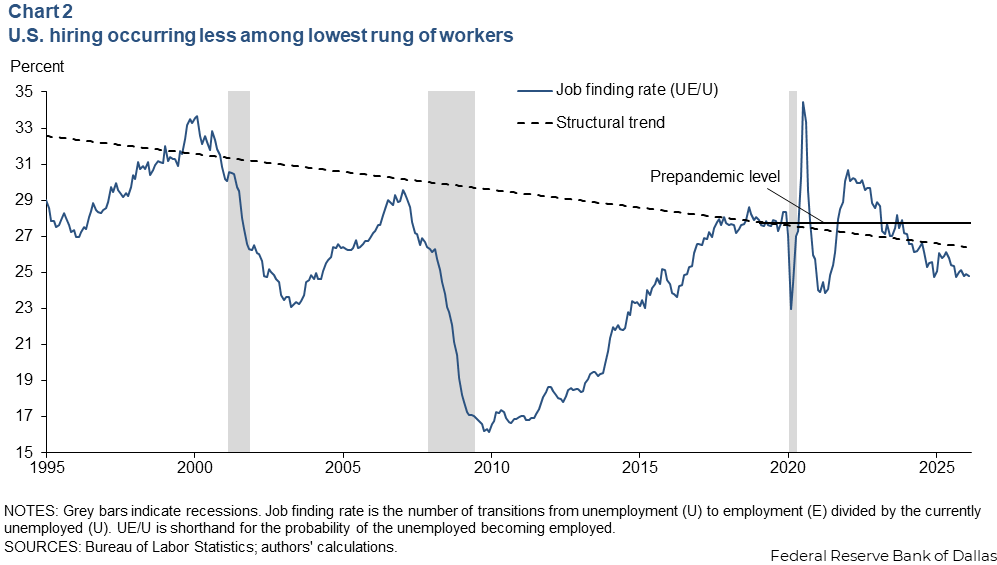
Recent initial jobless claims and JOLTS (Job Openings and Labor Turnover Survey) layoff rates data have been viewed as supporting the low-fire thesis. These metrics are often evaluated relative to levels in historically strong labor markets. Instead, they should be considered in light of structural trends.
An aging population and a decades-long decline in economic dynamism are forces in the U.S. that should cause the baseline firing rate to decrease over time. Older, more entrenched workforces naturally produce lower turnover. Therefore, a comparison of hiring or firing rates to historically strong U.S. labor markets would be using an unadjusted baseline, which would overestimate both the normal hiring and firing rates.
When we compare the current rates of firing and of hiring from unemployment to estimated structural trends or prepandemic levels, firing is above normal, and hiring from unemployment is below normal. Chart 1 demonstrates that firing rates have exceeded both the long-term structural downward trend and the prepandemic level. Conversely, Chart 2 shows that hiring from unemployment has consistently failed to keep pace with either prepandemic baseline. While pinpointing exact structural baselines is inherently imprecise, the direction of these deviations implies cooling labor market demand at the entry level.
Drivers of the unemployment rate
Given this cooling environment, the 1 percentage point rise in the unemployment rate over the last few years should be examined closely. To pinpoint the exact cause, we analyzed labor market flows using a stock-flow decomposition. Think of this approach as a mathematical simulation. By systematically shutting down individual labor market forces one at a time—such as workers voluntarily quitting, new job seekers entering the market or workers getting fired—we can isolate exactly which force is driving the unemployment rate.
Applying this method to the data reveals that fluctuations in labor supply (net labor force entrants) or job-switching behavior (job-to-job churn) have had virtually zero mechanical effect on the rising unemployment rate. While such models rely on specific identifying assumptions, the results strongly suggest that unemployment is overwhelmingly a function of demand at the lowest rung of the job ladder.
Because those other factors have had virtually zero impact, Table 1 isolates the two forces that are moving the needle: a declining job-finding rate (hiring) and a rising firing rate. As the table shows, this combination has driven almost the entire rise in unemployment since 2023. The drop in hiring and the rise in firing contribute comparably, each explaining roughly half of the overall increase.
| Unemployment rate | Change | Firing | Hiring | Both | Neither | |
| December 2023 | 3.70 | 0.00 | 0.00 | 0.00 | 0.00 | 0.00 |
| January 2025 | 4.10 | 0.39 | 0.33 | 0.41 | 0.75 | -0.05 |
| November 2025 | 4.54 | 0.83 | 0.40 | 0.49 | 0.83 | -0.29 |
| NOTE: Numbers represent percentage point contributions (in decimal format) to the change in the unemployment rate. SOURCES: Bureau of Labor Statistics; authors' calculations. | ||||||
These hiring and firing rates are not the benign result of a soft-landing labor market. The underlying fundamental pressure remains pointed upward, driven primarily by cooling demand for new entrants and the unemployed.
Divergence in labor demand
If demand for the unemployed is deteriorating, then why is GDP still growing robustly? Why is payroll employment growth positive on average and why aren't aggregate wages collapsing?
The explanation lies in the upper rung of the job ladder. While firms have gradually reduced hiring for entry-level positions, they are again actively competing for proven, experienced talent. Chart 3 shows the freeze in job-to-job transitions in 2023–24, followed by a rebound in labor market fluidity for this group in 2025. Data from the Atlanta Fed Wage Tracker corroborate this.
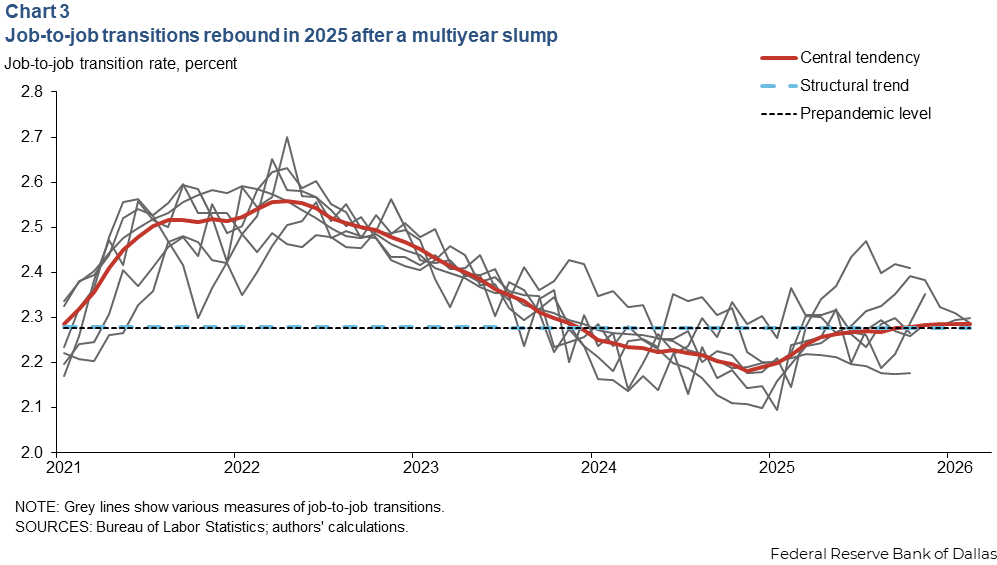
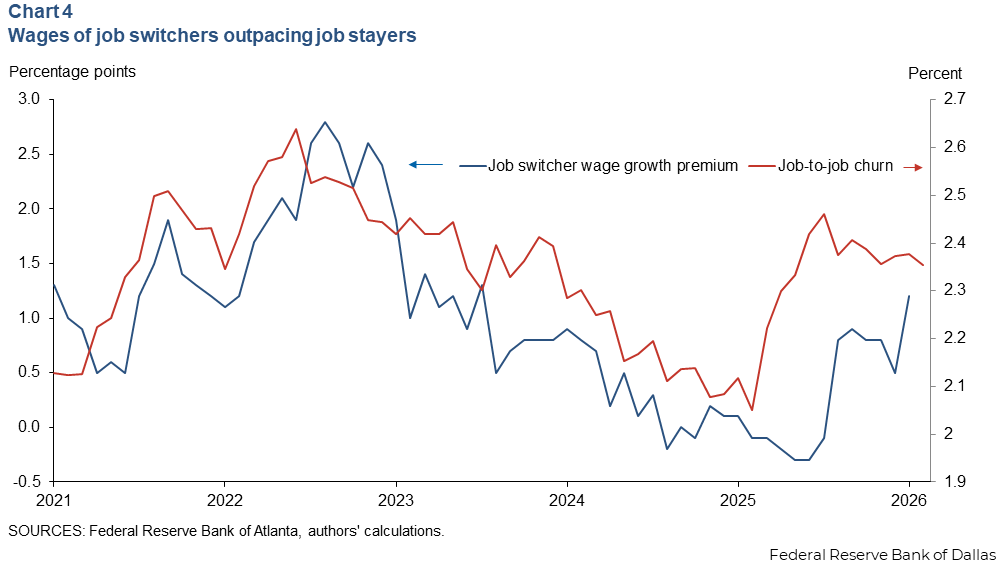
The Wage Tracker shows the wage premium for job switchers rebounded significantly through first quarter 2026. These job-to-job switches can boost headline numbers, because short breaks between jobs can count as new payroll employment, and movement to a different firm can improve a person’s wage and productivity.
The plot of upper-rung demand looks like a successful soft landing, while the lower rung clearly does not. The labor market appears increasingly disconnected, offering mobility and wage gains to employed workers (Chart 4). Meanwhile, the unemployed are left increasingly isolated.
How transmission mechanism of labor demand works
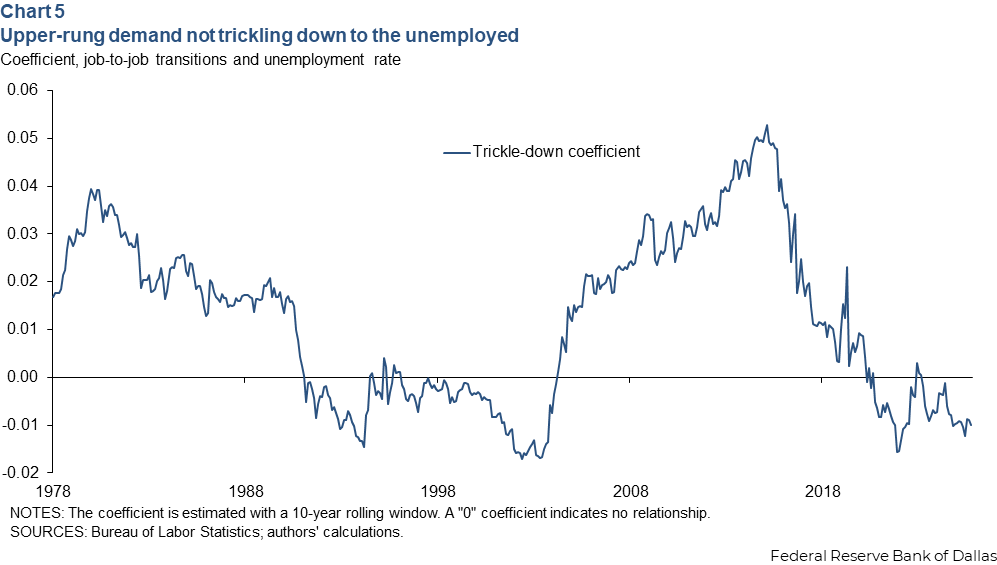
Theoretically, returning demand at the top of the job ladder should produce a trickle-down effect. As senior workers switch jobs and trigger internal promotions, a vacancy chain is created. At the chain’s end, entry-level vacancies should open up.
To test whether this transmission mechanism is functioning, we estimate a trickle-down coefficient using a rolling regression of changes in the unemployment rate against changes in job-to-job churn, lagged by a few months (Chart 5).
Our estimates suggest this transmission seems either weak, lagged or broken. While this transmission mechanism operated efficiently in the 2010s, it collapsed during the internet boom of the late 1990s and has broken down again recently. Top-level churn no longer leads to the reliable rehiring of workers from the unemployment pool.
Academic literature offers three likely explanations for why the bottom rung of the ladder may have disconnected:
- Technological mismatch: Like the ’90s tech boom, the current wave of AI and automation means new vacancies created at the top require specific skills that the existing pool of unemployed workers simply do not possess.
- Soft firing via attrition: Firms that overhired in 2022 use current turnover to quietly shrink. When a worker quits, the firm reduces its workforce rather than initiating a backfill vacancy chain.
- Flight to quality: In an uncertain economic environment, highly risk-averse employers view the unemployed as risky bets, preferring to pay a premium for proven insiders rather than taking a chance on an outsider.
There is mixed evidence on how this transmission might affect new college graduates. Workers aged 16–24 have experienced a revival in wage growth in recent months. But the unemployment rate for recent college graduates remains elevated relative to the full labor force. It is possible that fewer young people are able to find jobs, but those who do are rewarded more.
A Divided Labor Market
The U.S. labor market is generating two conflicting macroeconomic realities: increased efficiency alongside heightened vulnerability.
The renewed churn at the top of the job ladder is highly allocatively efficient. Workers are moving to better-fitting roles, which boosts total factor productivity (or efficiency) and helps explain why GDP remains resilient despite a slowdown in net hiring.
However, because the trickle-down mechanism seems broken, this efficiency does not reach the broader workforce. Firms are bypassing the unemployed to hire from within the ranks of the already employed or attract direct entry from outside the labor force. As a result, the unemployment rate has become structurally stickier.
Without the safety net of a functioning vacancy chain to absorb displaced workers, the labor market appears potentially more brittle, leaving the broader economy more susceptible to future aggregate demand shocks. Monitoring the evolution of this broken transmission mechanism may be critical for assessing labor market resilience going forward.
About the authors