Energy Indicators

October 6, 2021
Hurricane Ida temporarily impacted refining and petrochemical production, but the recovery was well underway for most facilities by the end of September. Polymer prices remain elevated, and rising natural gas prices are pushing up U.S. chemical feedstock costs. Natural gas production outages, rising exports and robust domestic demand are eroding natural gas inventories on a seasonally adjusted basis. Combined, these pressures have driven U.S. natural gas prices higher.
Hurricane Ida effects
Refinery crude runs mostly recover by late September
Hurricane Ida made landfall in Louisiana as a Category 4 hurricane on Aug. 29. The intense winds and attendant flooding forced shutdowns in several areas of U.S. energy infrastructure. The weekly volume of crude processed into fuel by refineries on the U.S. Gulf Coast dropped 13.8 percent from August to an average of 7.4 million barrels per day (mb/d) in September—a 10.9 percent decline from September 2019 (Chart 1).
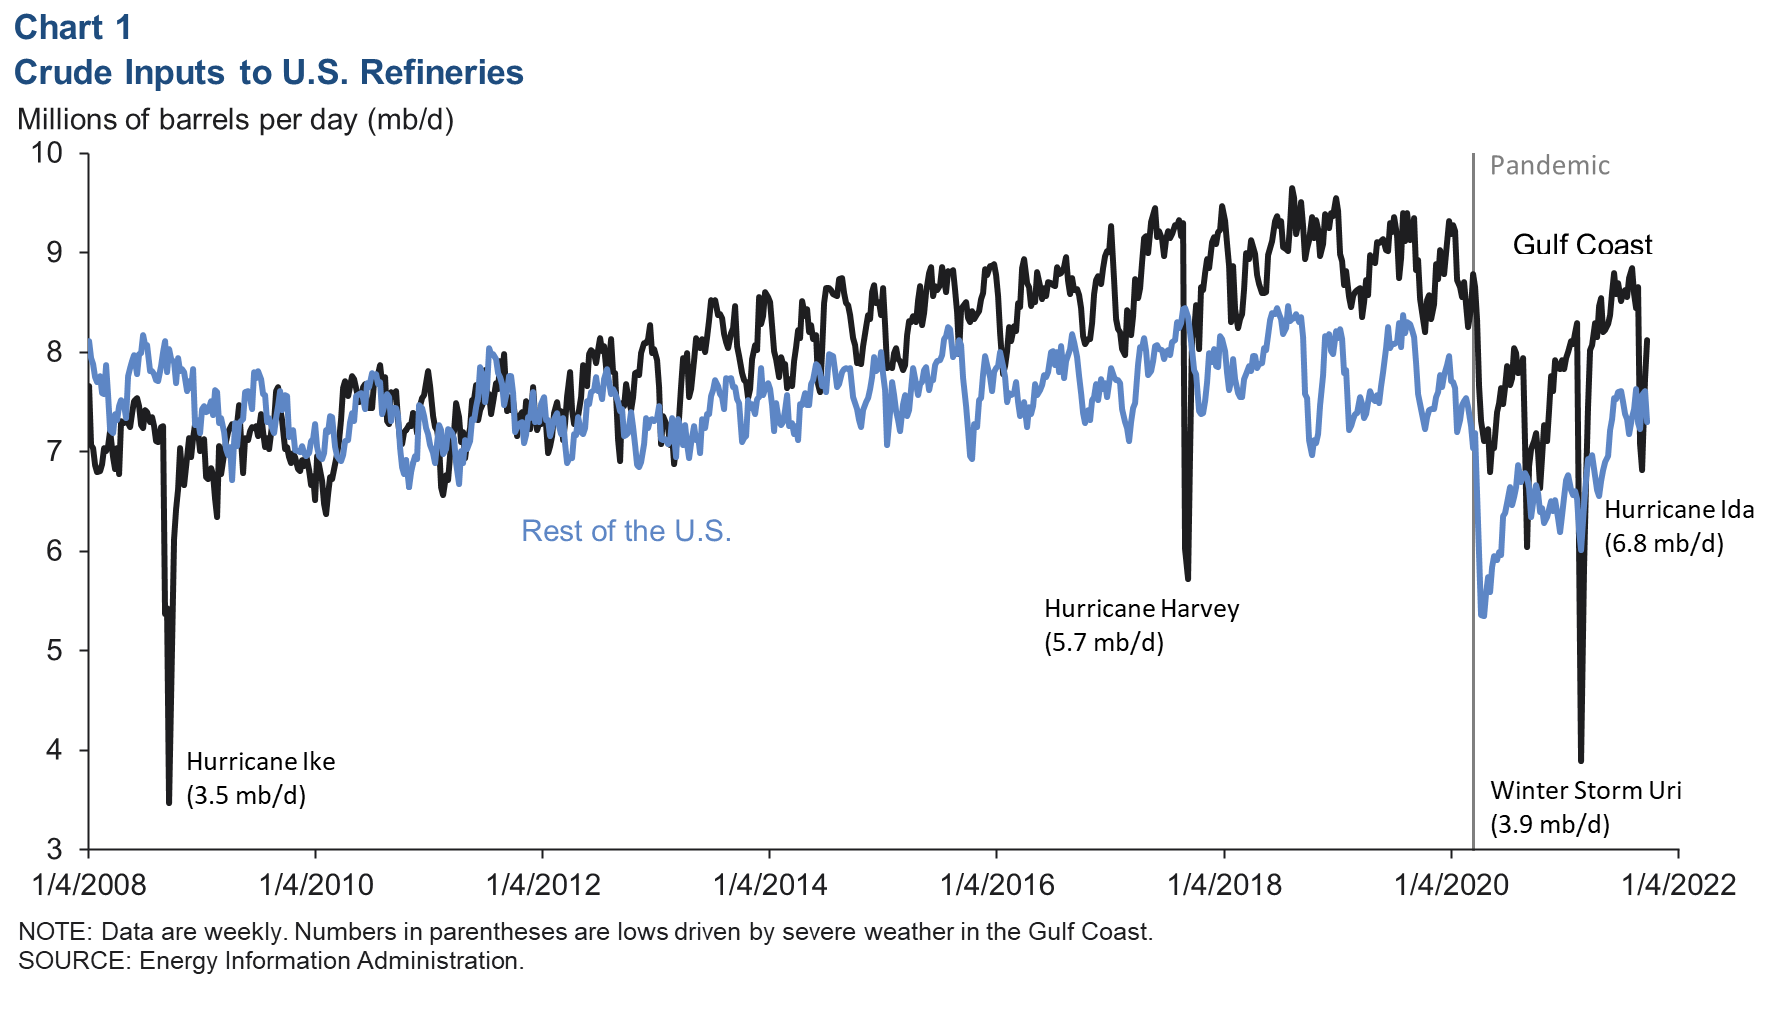
Weekly processing fell as low as 6.8 mb/d the week of Sept. 10, but by the week of Sept. 24, crude processing had recovered to 8.1 mb/d. The roughly 0.5 mb/d of crude demand that remains offline is tied mainly to two refineries of about 0.25 mb/d each. Shell’s Norco refinery was slated to resume operation in mid-October, but the fate of the Phillips 66 Alliance refinery remains uncertain.
Chemical production also impacted by hurricane
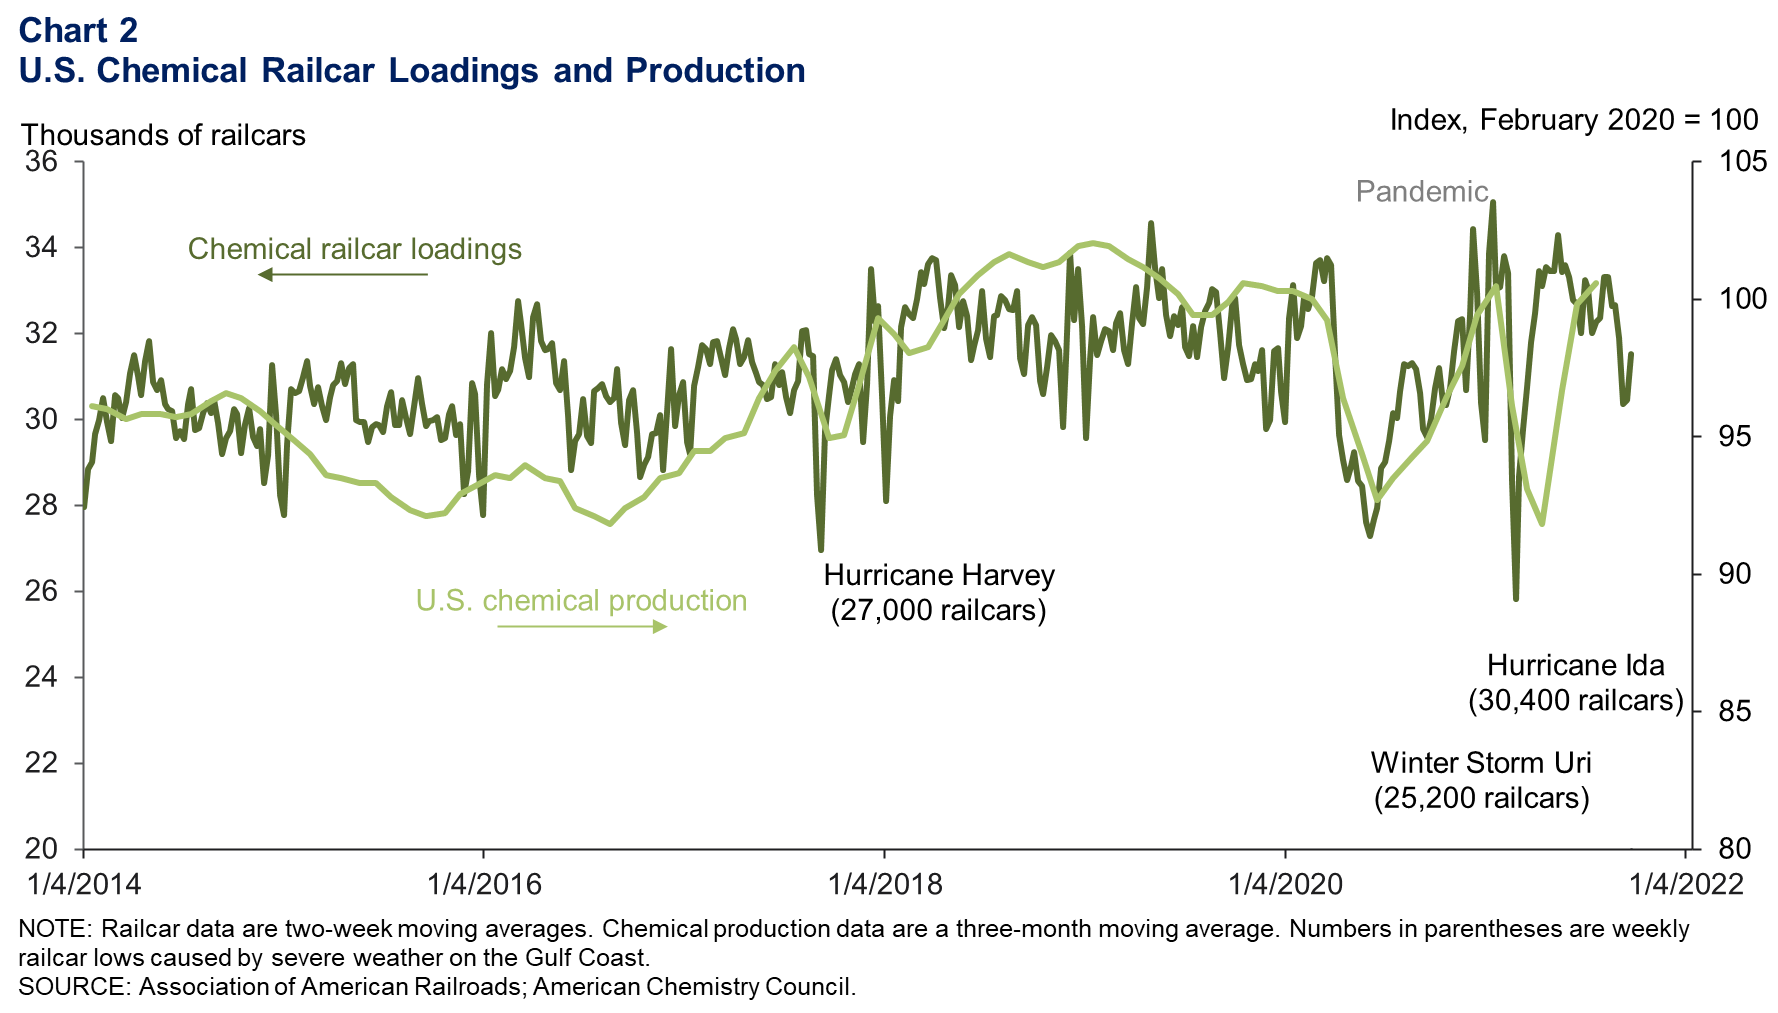
Aggregate U.S. chemical production surpassed levels prior to Winter Storm Uri by July 2021, as estimated by the American Chemistry Council. However, chemical capacity in the hard-hit eastern parts of Louisiana had to shut for a few weeks after Ida damaged power, road, rail and waterway infrastructure that serviced the populace, feedstock and industrial gas suppliers, and chemical plants. Chemical supply chains such as polyvinyl chloride (PVC) pipe resin, architectural coatings, and related intermediate products and co-polymers were more impacted than other segments of the plastics industry. As much as 59 percent of U.S. PVC capacity was offline at one point.
Weekly U.S. chemical railcar loadings—a higher-frequency proxy for capacity utilization—fell 7 percent, from 32,700 cars prior to Ida to a low of 30,400 cars the week of Sept. 11 (Chart 2). They recovered to 31,500 by the end of the month as capacity returned to operation.
With the return of capacity heading into fall annual maintenance at U.S. refining and chemical complexes, higher raw material prices, tight supplies and robust demand across the hydrocarbon processing complex are likely to support higher product prices through year end. However, many industry contacts indicate that tightness in basic chemical supply chains will likely begin to ease by first quarter 2022.
Ethylene and polyethylene prices
Ethylene and polyethylene prices surged to highs of 56.9 cents per pound (c/lb) and 84.6 c/lb, respectively, in March and April 2021 as Winter Storm Uri congested global shipping and soaring consumer demand strained the availability of material (Chart 3). That trend began to reverse as intermediate chemical supplies like ethylene recovered, but tight polymer markets, unplanned outages and elevated oil prices have supported polymers. Many producers had already announced price increases for resins prior to Hurricane Ida.
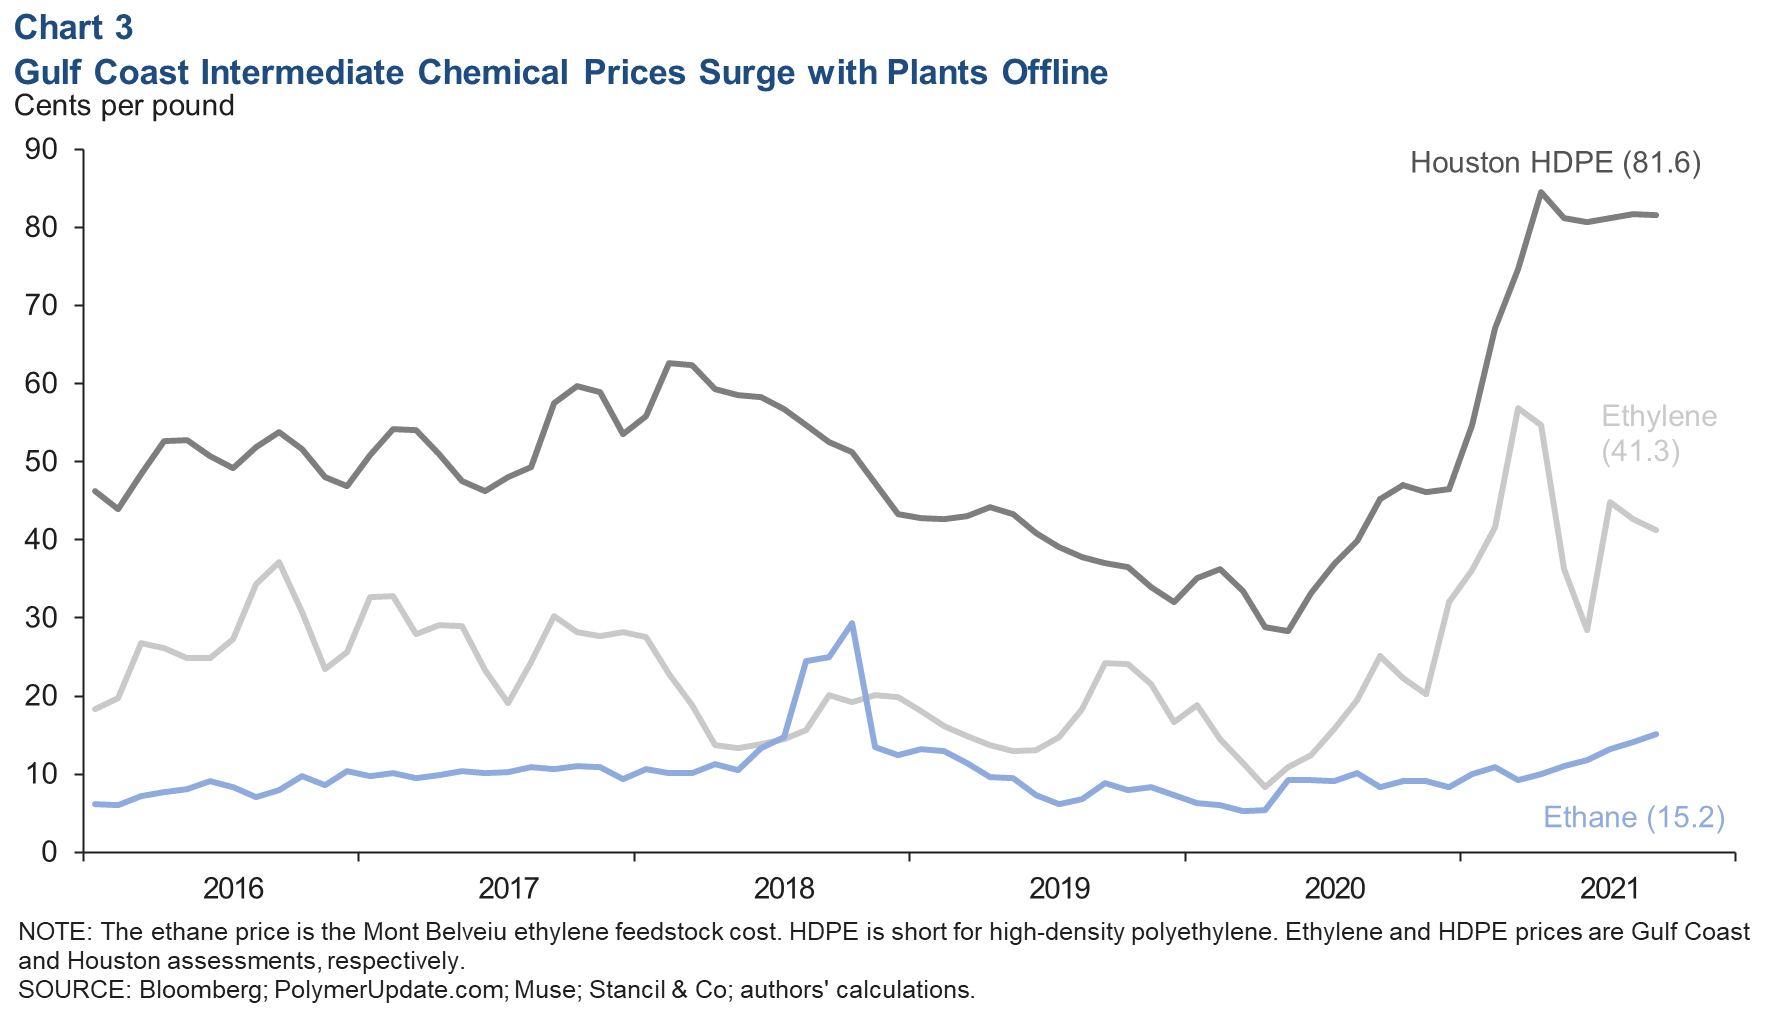
Marginal suppliers globally are tied to oil-based feedstock and have seen little relief on the cost front compared with U.S. suppliers reliant on natural gas liquids like ethane. However, ethane prices have been rising as natural gas supplies have tightened.
Ethane can be left blended in the natural gas sold to consumers if it is economical and the concentration is not too high. The opportunity cost of stripping the ethane out for use in chemical plants rises with the price of natural gas, and this tends to drive up the price of ethane. Ethane rose to over 18 cents per pound at the end of September. Given strong petrochemical demand, rising natural gas prices and only modest increases in production expected from U.S. shale, ethane prices may climb further.
Natural gas
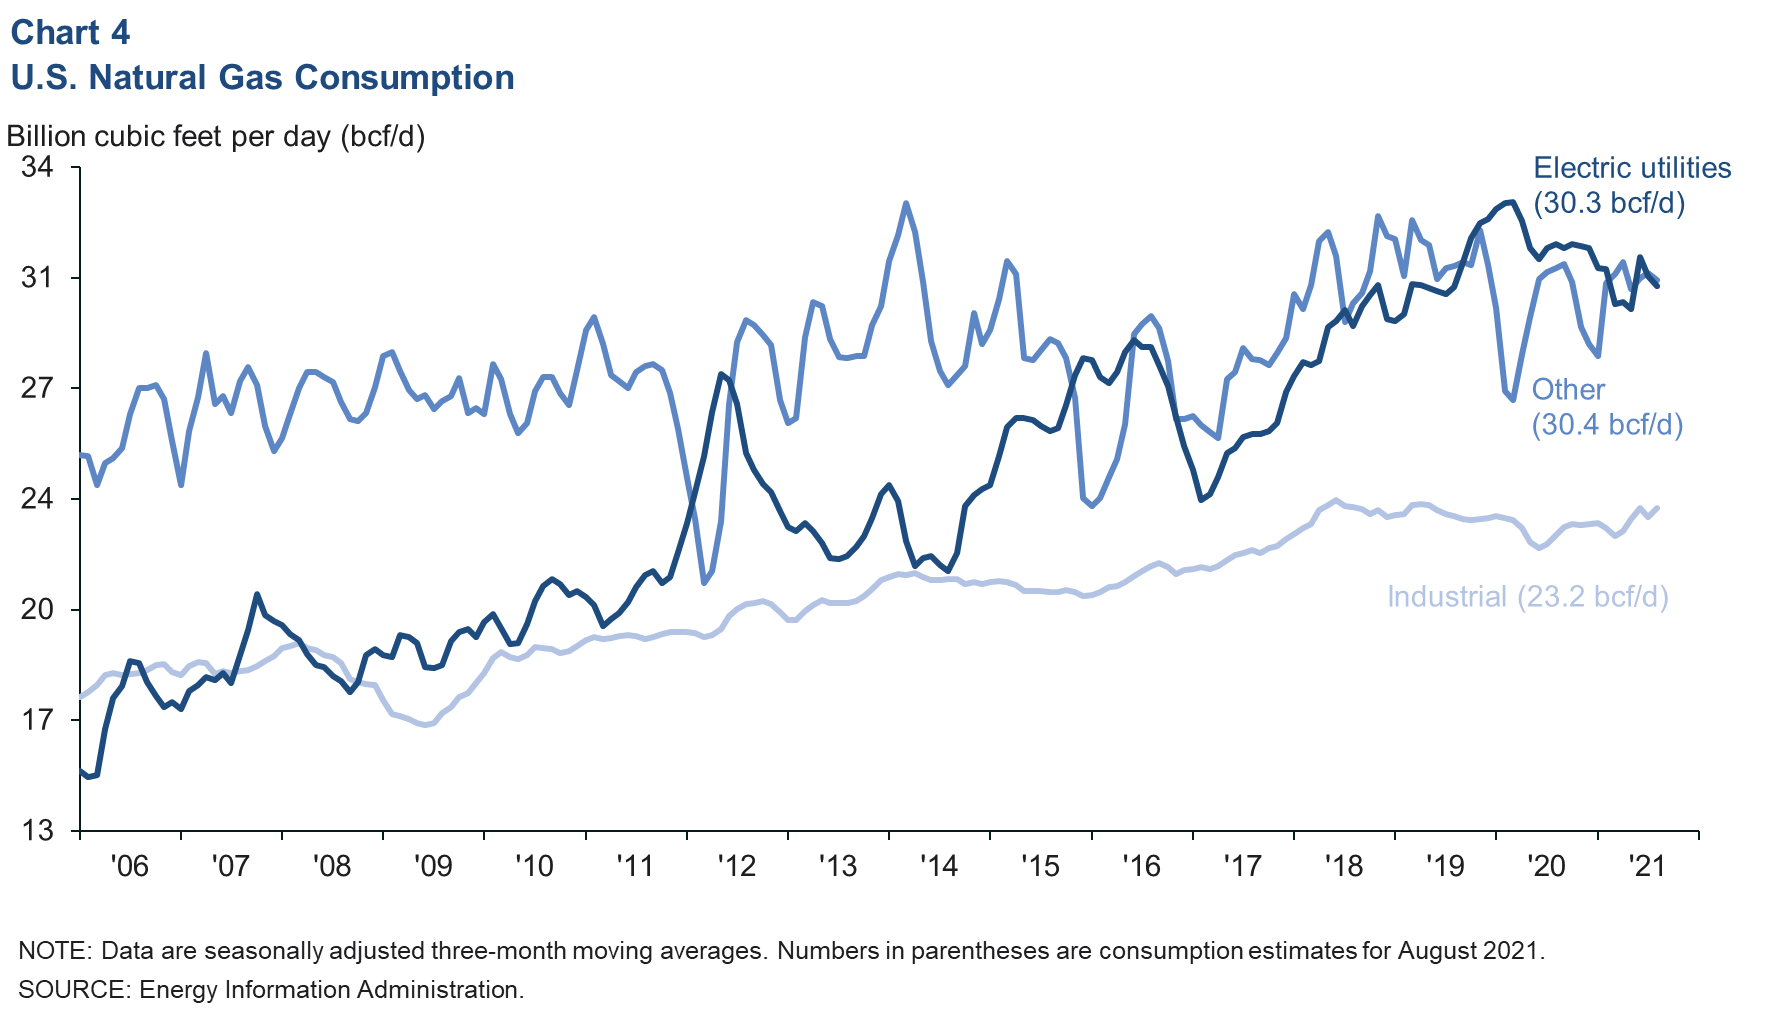
Electric utilities consumed a seasonally adjusted 30.3 billion cubic feet per day (bcf/d) of natural gas over the three months ending September 2021, about 2.4 percent less than in the same period in 2019 (Chart 4). But the industrial sector—including refining, petrochemicals, fertilizer and industrial gases—consumed 23.2 bcf/d, its highest volume since May 2019. The balance of the estimated consumption—mostly residential and commercial customers—was 30.4 bcf/d.
Exports and inventories
Liquefied natural gas (LNG) exports were 9.1 bcf/d in June (Chart 5). The Energy Information Administration (EIA) projects that this volume will climb to 10 bcf/d by December and to 11.8 bcf/d by the end of 2022 as new export capacity comes online and seasonal maintenance ends. Pipeline exports of natural gas to Canada and Mexico are also projected to increase from 8.8 bcf/d in June 2021 to 9.6 bcf/d in December of this year. That would put natural gas exports in December at 20 percent of total U.S. marketed natural gas.
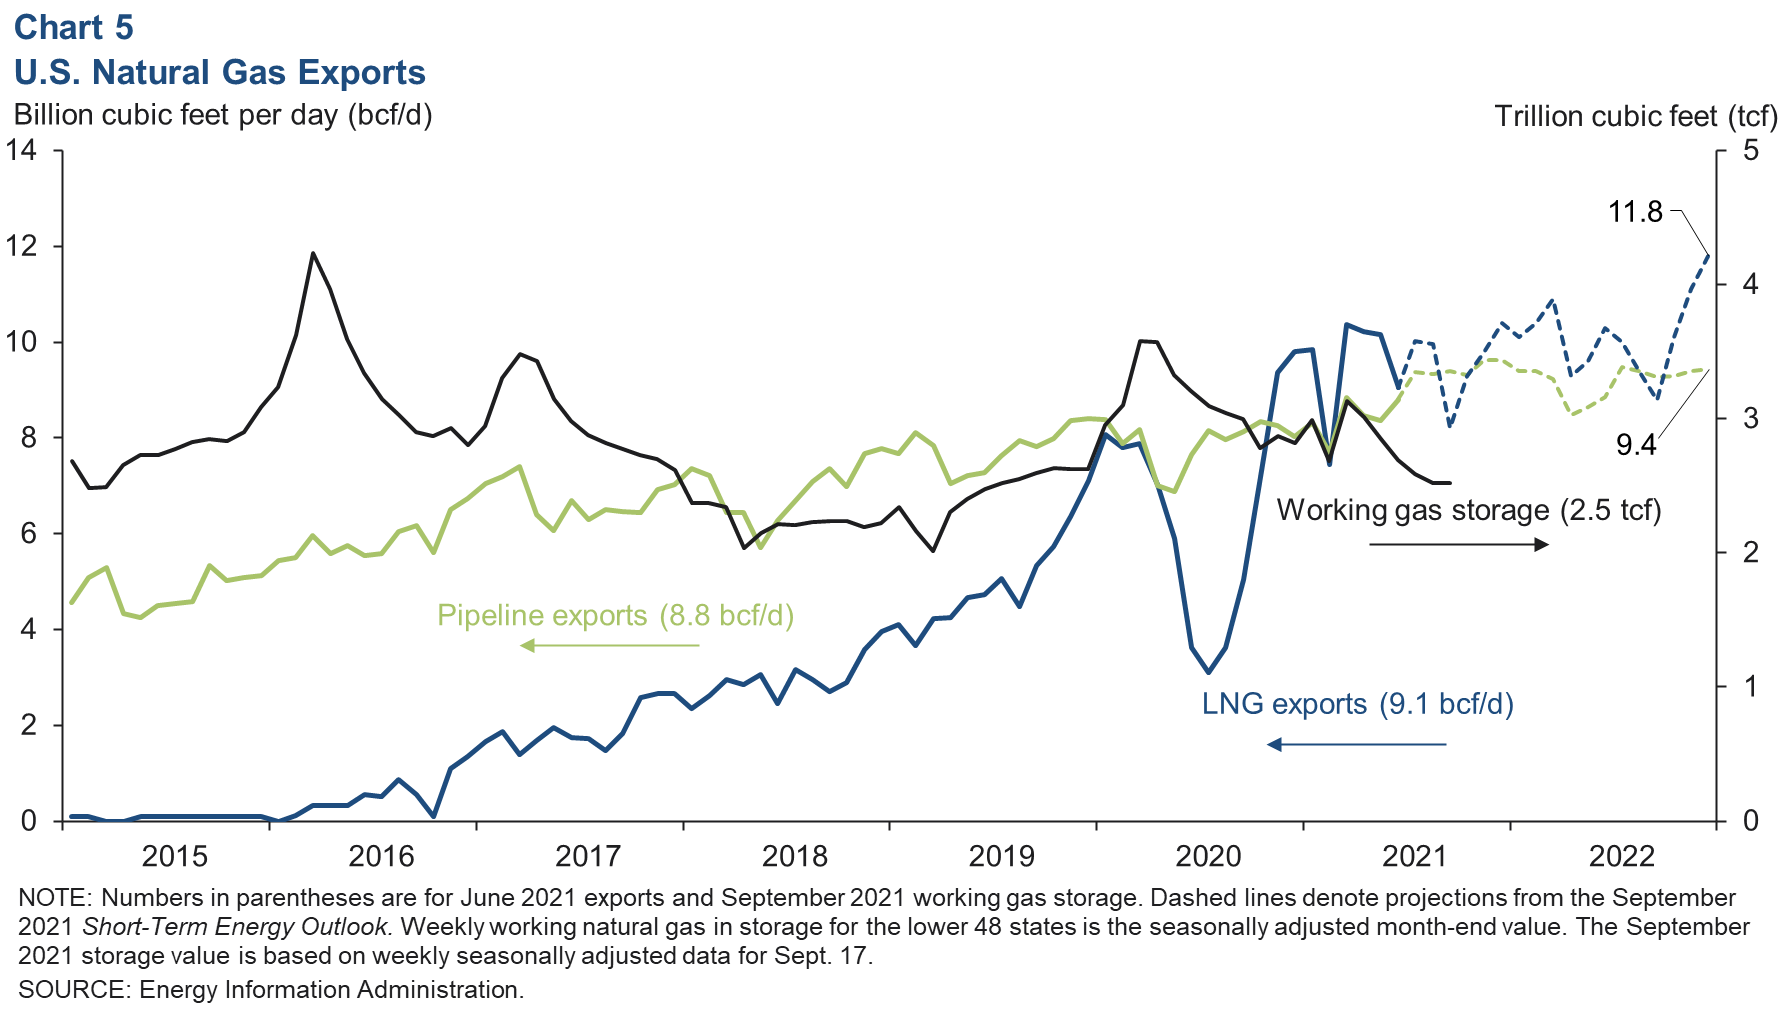
Rising exports and domestic demand and a decline in Gulf of Mexico natural gas production from 2.3 to 1.4 bcf/d in September combined to erode the pace of normal seasonal inventory builds. Seasonally adjusted working inventories of natural gas slipped to 2.5 trillion cubic feet by the end of September, and projections from the EIA call for only marginal improvement by year end—assuming a normal winter. This is likely reflected in January futures contracts for Henry Hub, which have risen to $6.07 per million British thermal units from $5.68 two weeks ago.
About Energy Indicators
Questions can be addressed to Jesse Thompson at jesse.thompson@dal.frb.org. Energy Indicators is released monthly and can be received by signing up for an email alert. For additional energy-related research, please visit the Dallas Fed’s energy home page.