Austin Economic Indicators

Economic growth in Austin was robust in November. The Austin Business-Cycle Index accelerated as jobs remained strong and the unemployment rate held at a very low level. Employment and survey data suggest Austin’s manufacturing sector grew strongly in 2017.
Business-Cycle Index
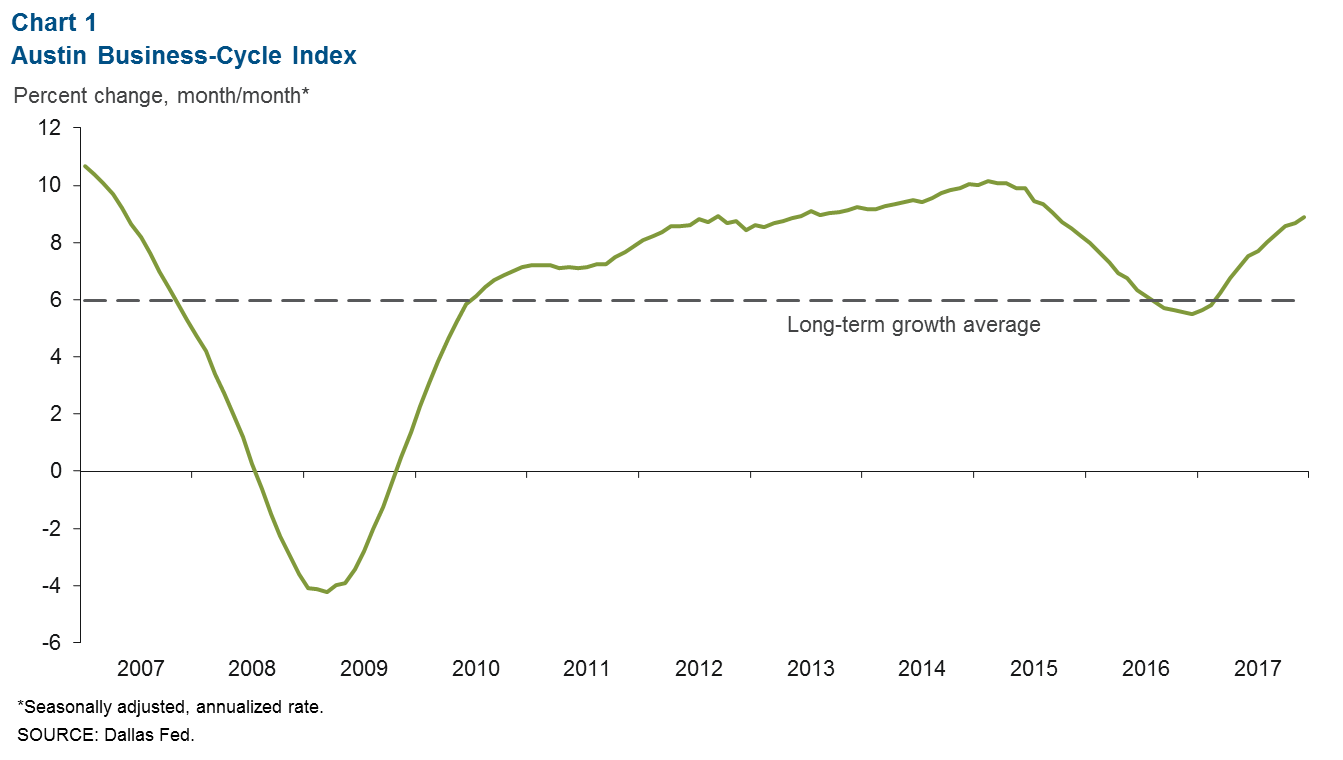
The Austin Business-Cycle Index increased at an 8.9 percent annualized pace in November, the fastest rate of growth since 2015 (Chart 1). Strong employment gains in the second half of the year and declines in the unemployment rate have propelled growth in the index.
Labor Market
Unemployment Rate Nears Historic Lows
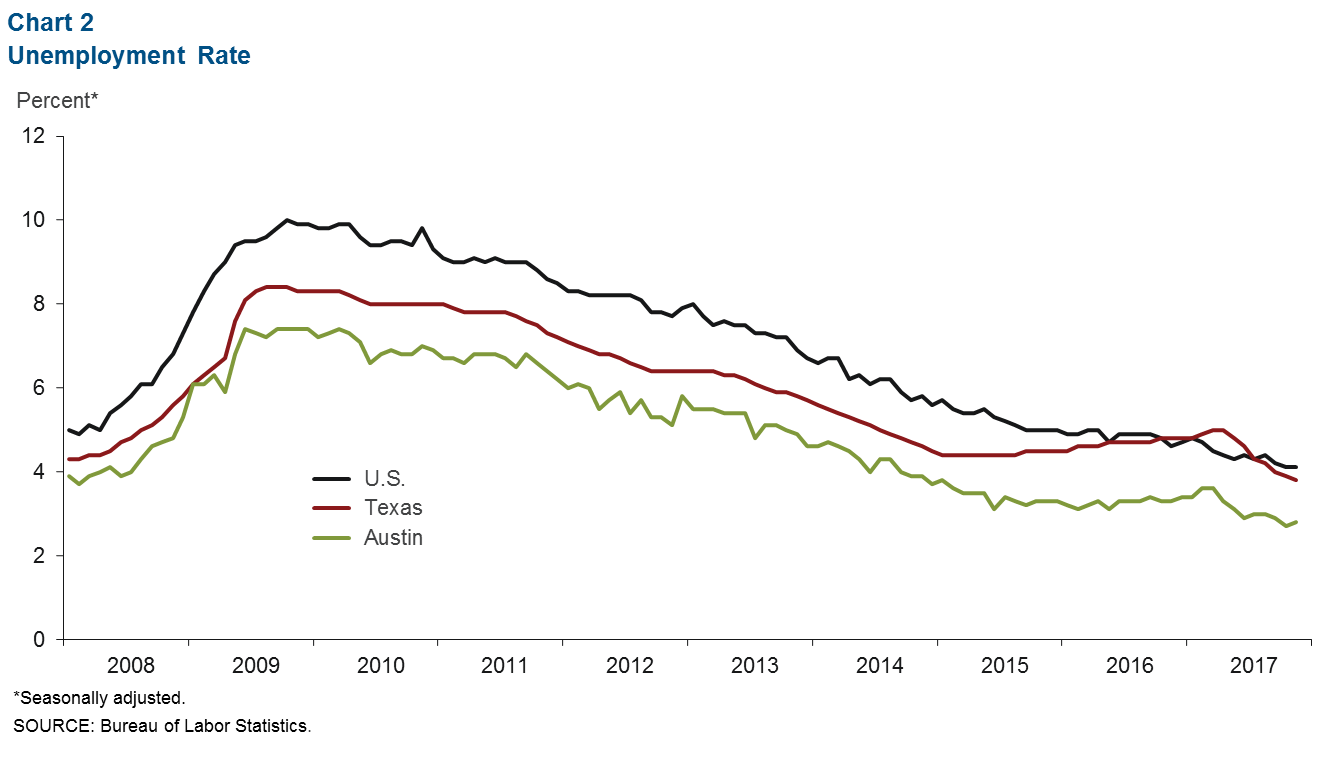
The Austin unemployment rate ticked up slightly to 2.8 percent in November (Chart 2). However, this remains well below the area’s long-term average of 4.3 percent. Meanwhile, the state average jobless rate fell to 3.8 percent, the lowest on record. The Austin labor force expanded at an annualized 5.6 percent rate, and 2017 growth of 2.3 percent through November is the second fastest among the major state metro areas.
Job Growth Accelerating
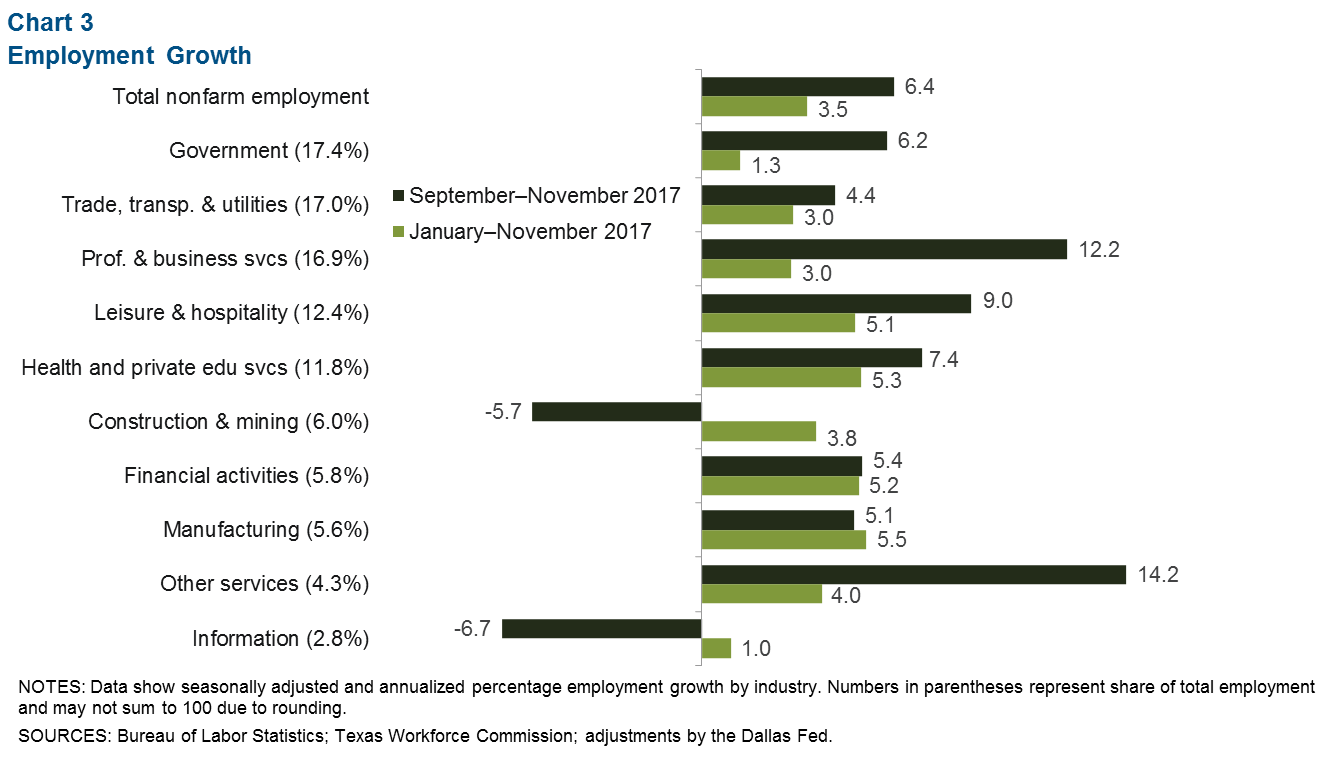
Jobs in Austin grew at a 6.4 percent annualized rate over the three months through November (Chart 3). Growth was broad based, with only construction and information services shedding jobs over this time. Professional and business services employment grew rapidly at 12.2 percent, adding 5,000 jobs. The leisure and hospitality and health care services sectors also saw strong gains and together added 5,000 jobs. Public-sector employment, propelled by strong state government hiring, grew 6.2 percent. Financial activities, manufacturing and transportation services also increased at a strong pace.
Hourly Earnings Growth Flat
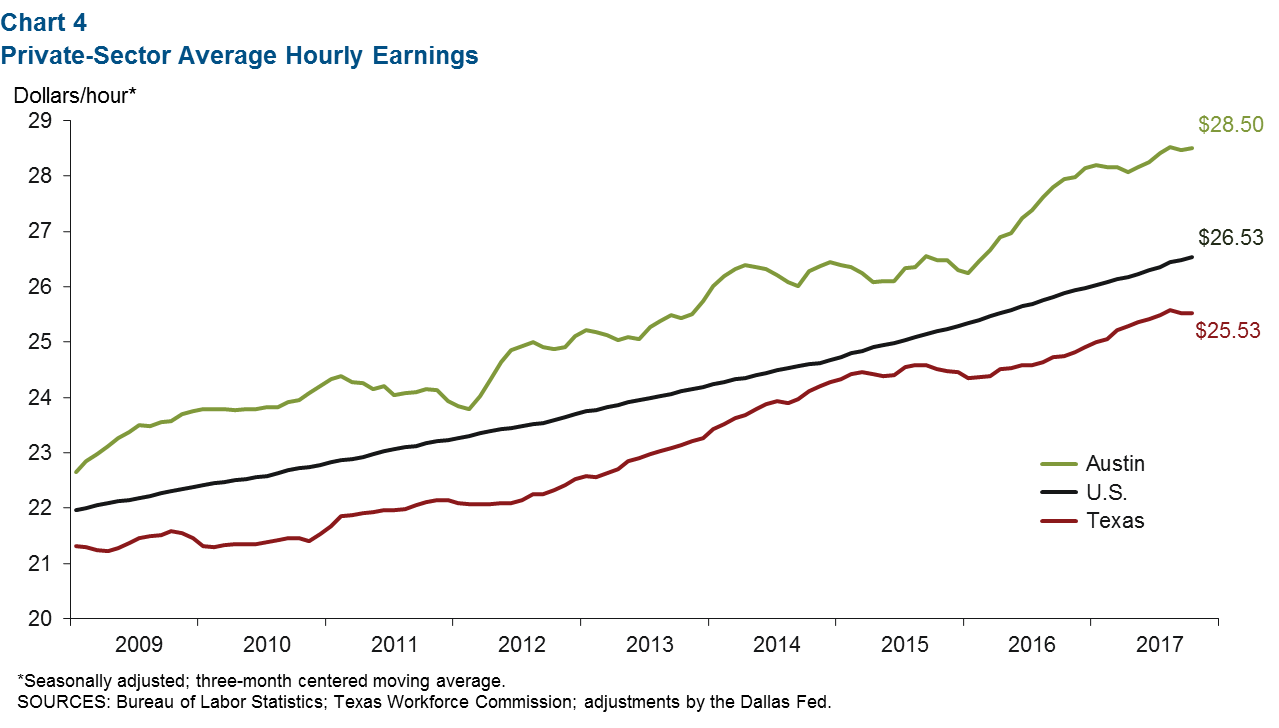
Private-sector hourly wages flattened out at $28.50, well above the state and national averages (Chart 4). However, year-over-year wage growth was 2.0 percent, below the state increase of 3.0 percent. This is likely in part due to the strong resurgence of high-wage oil and gas jobs bolstering average wages at the state level.
Real Estate
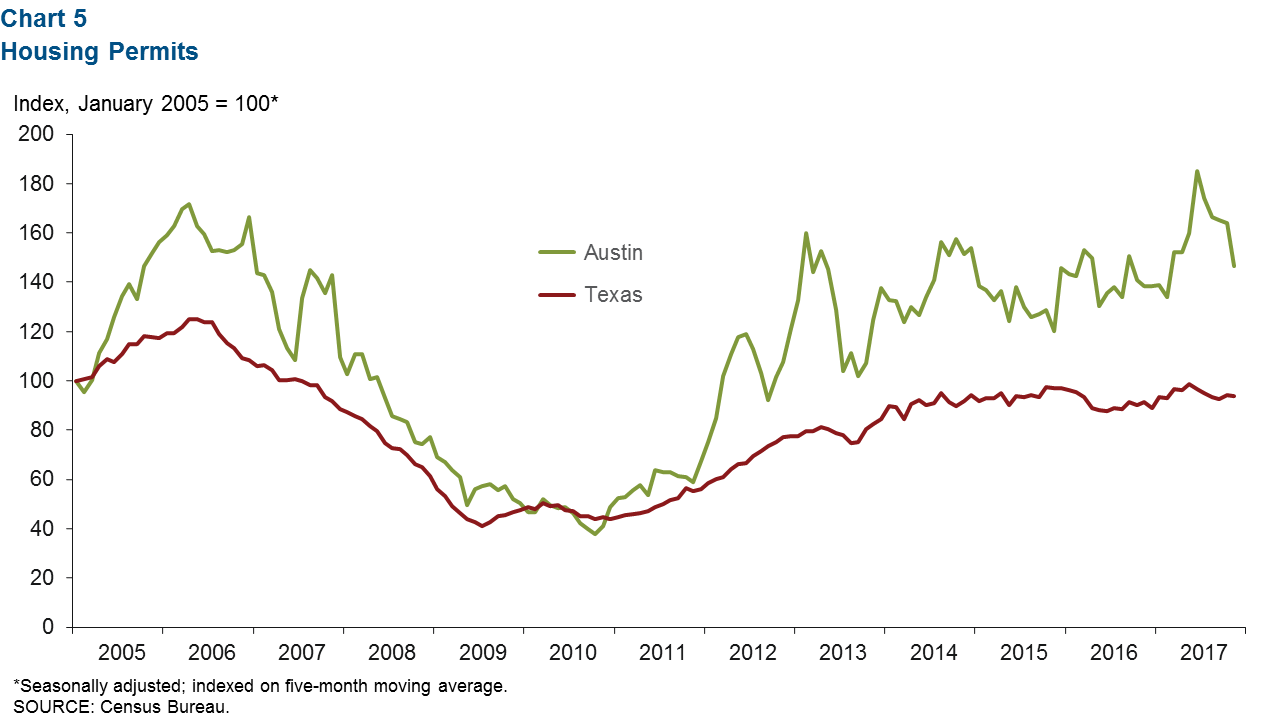
Housing permits in Austin slowed toward the end of the year, falling from a 10-year high in June (Chart 5). Nonetheless, year-over-year growth was nearly 6 percent compared with just 2.5 percent for the state. The median home price remained high at $296,815, while existing-home sales reached a new high in November.
Purchasing Managers Index
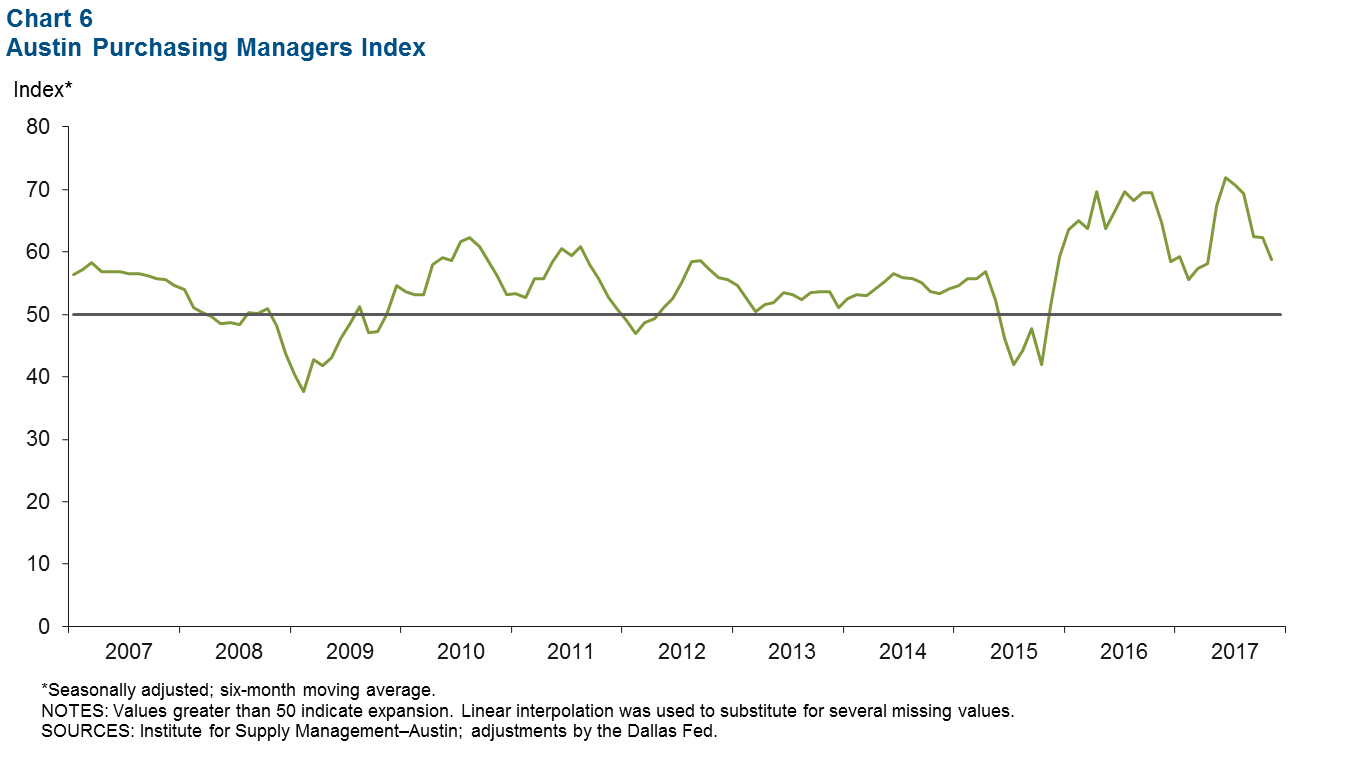
The Austin Purchasing Managers Index indicated continued growth in the area’s manufacturing sector in November, although at a somewhat moderated pace compared with earlier in 2017 (Chart 6). The six-month average of the headline index was bolstered by strong growth in production and new orders. This strength is reflected in solid employment growth in manufacturing, which grew an annualized 6.0 percent in the second half of the year through November.
NOTE: Data may not match previously published numbers due to revisions.
About Austin Economic Indicators
Questions can be addressed to Christopher Slijk at christopher.slijk@dal.frb.org. Austin Economic Indicators is released on the first Thursday of every month.