Austin Economic Indicators

Austin economic growth remained robust in January. According to revised data, employment grew 4.2 percent in 2017, the fastest rate among Texas’ large metro areas. Third-quarter data show high-tech services employment accelerated sharply and likely finished the year at a pace well above overall job growth. Housing affordability was steady in the fourth quarter, while survey data suggest manufacturing activity has flattened out in recent months.
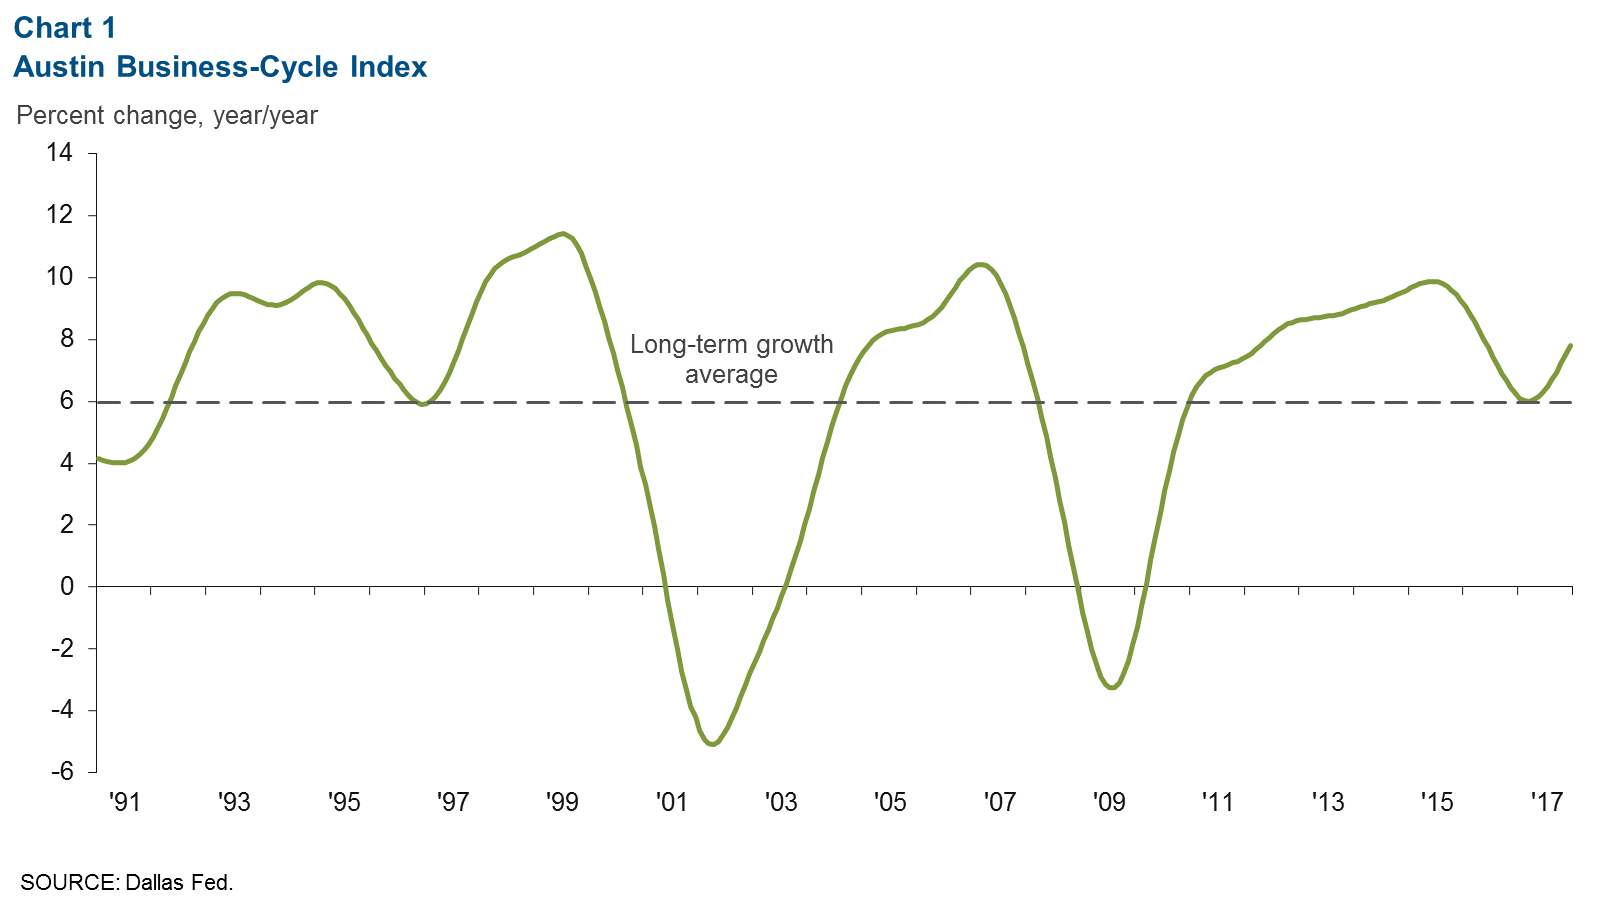
Austin Business-Cycle Index
The Austin Business-Cycle Index grew at a 7.8 percent pace last year (Chart 1). 2017 saw an acceleration after growth slowed in 2016 to the region’s long-term average. Austin’s considerable labor market tightness may be a headwind to growth, but recent strong increases in help-wanted advertising, venture capital funding and other indicators suggest a positive outlook for Austin in 2018.
Labor Market
2017 Job Growth Broad Based
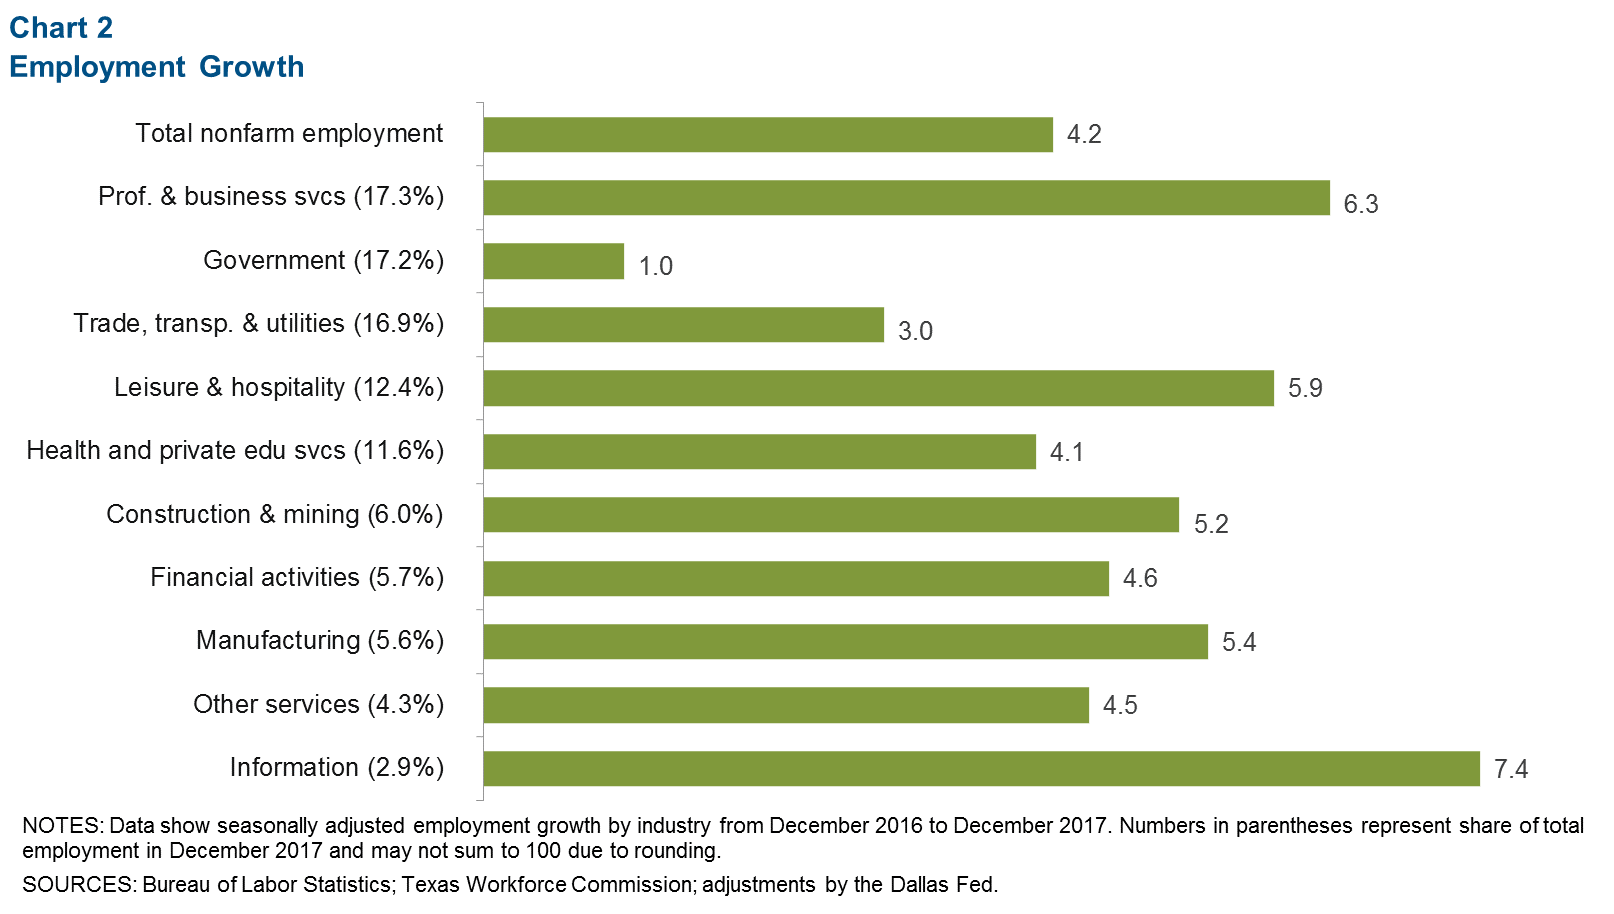
With the Dallas Fed’s third-quarter early benchmark revisions, Austin job growth at 4.2 percent is up from the previous estimate of 3.6 percent for 2017 (Chart 2). The revision makes Austin the fastest-growing large metro area in Texas by this measure. Growth was broad based and positive across all industries and was particularly strong in professional and business services, which grew 6.3 percent and added nearly 11,000 jobs last year. Growth was also strong in most goods-producing and service sectors. The few exceptions were trade, transportation and utilities, which was dampened by weakness in retail hiring, and government, which slowed due to declines in federal employment.
High-Tech Employment Strong
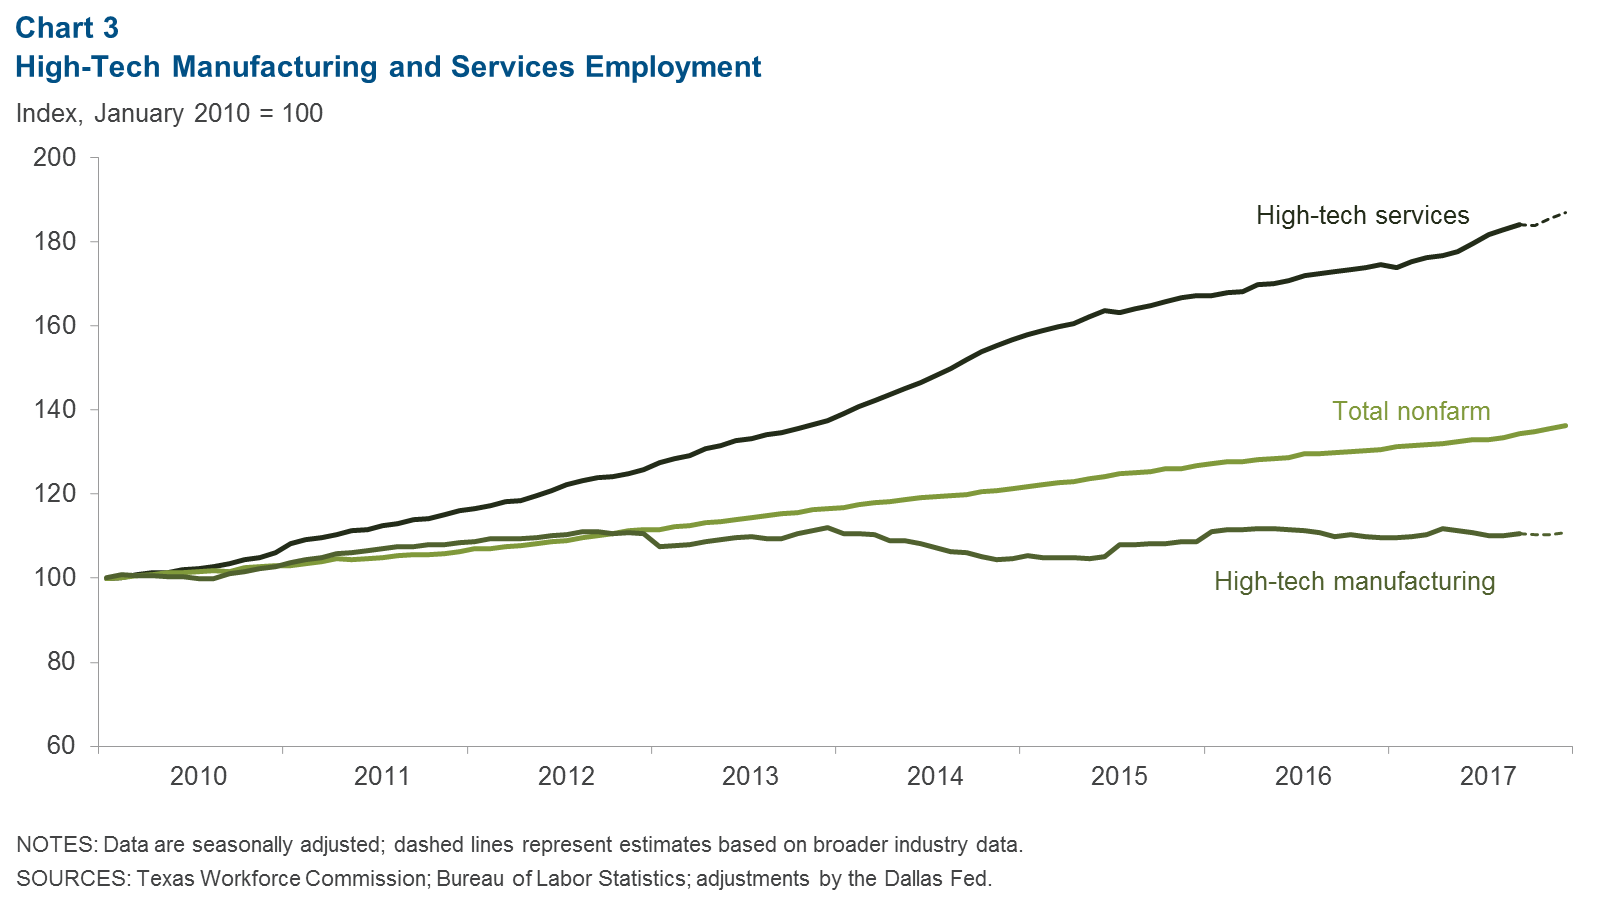
Recently released data suggest that high-tech employment in Austin grew at a robust rate in third quarter 2017, rising 6.7 percent overall (Chart 3). High-tech services employment—which includes computer systems design, scientific research and development, and data processing—surged at a 10.2 percent annualized rate. However, high-tech manufacturing jobs—which include computer and electronics production—declined 1.3 percent. Broader industry data suggest continued strong growth in tech employment in the fourth quarter as well as overall growth last year of 7.1 percent in high-tech services and 1.0 percent in high-tech manufacturing.
Real Estate
Home Sales Remain Elevated
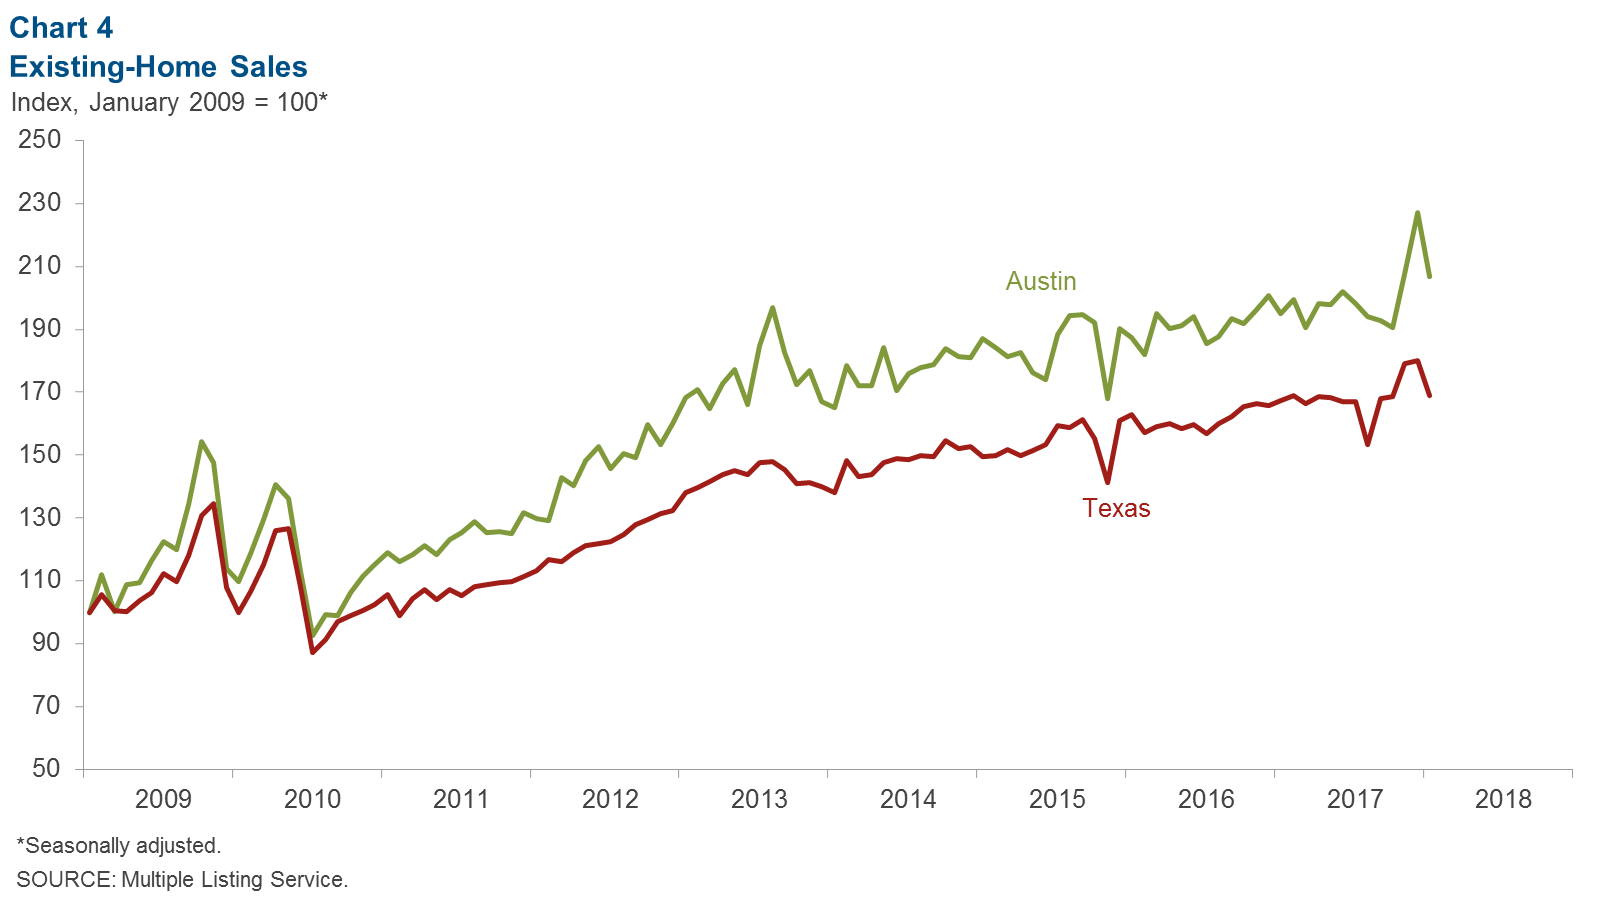
January home sales in Austin slipped slightly to 2,938 after reaching an all-time high in December 2017. Nevertheless, year-over-year growth was a strong 6.1 percent, compared with just 1 percent for the state as a whole (Chart 4). Home inventories remained lean at 2.5 months’ supply, while the median price remained near the all-time high of $307,438 reached in December.
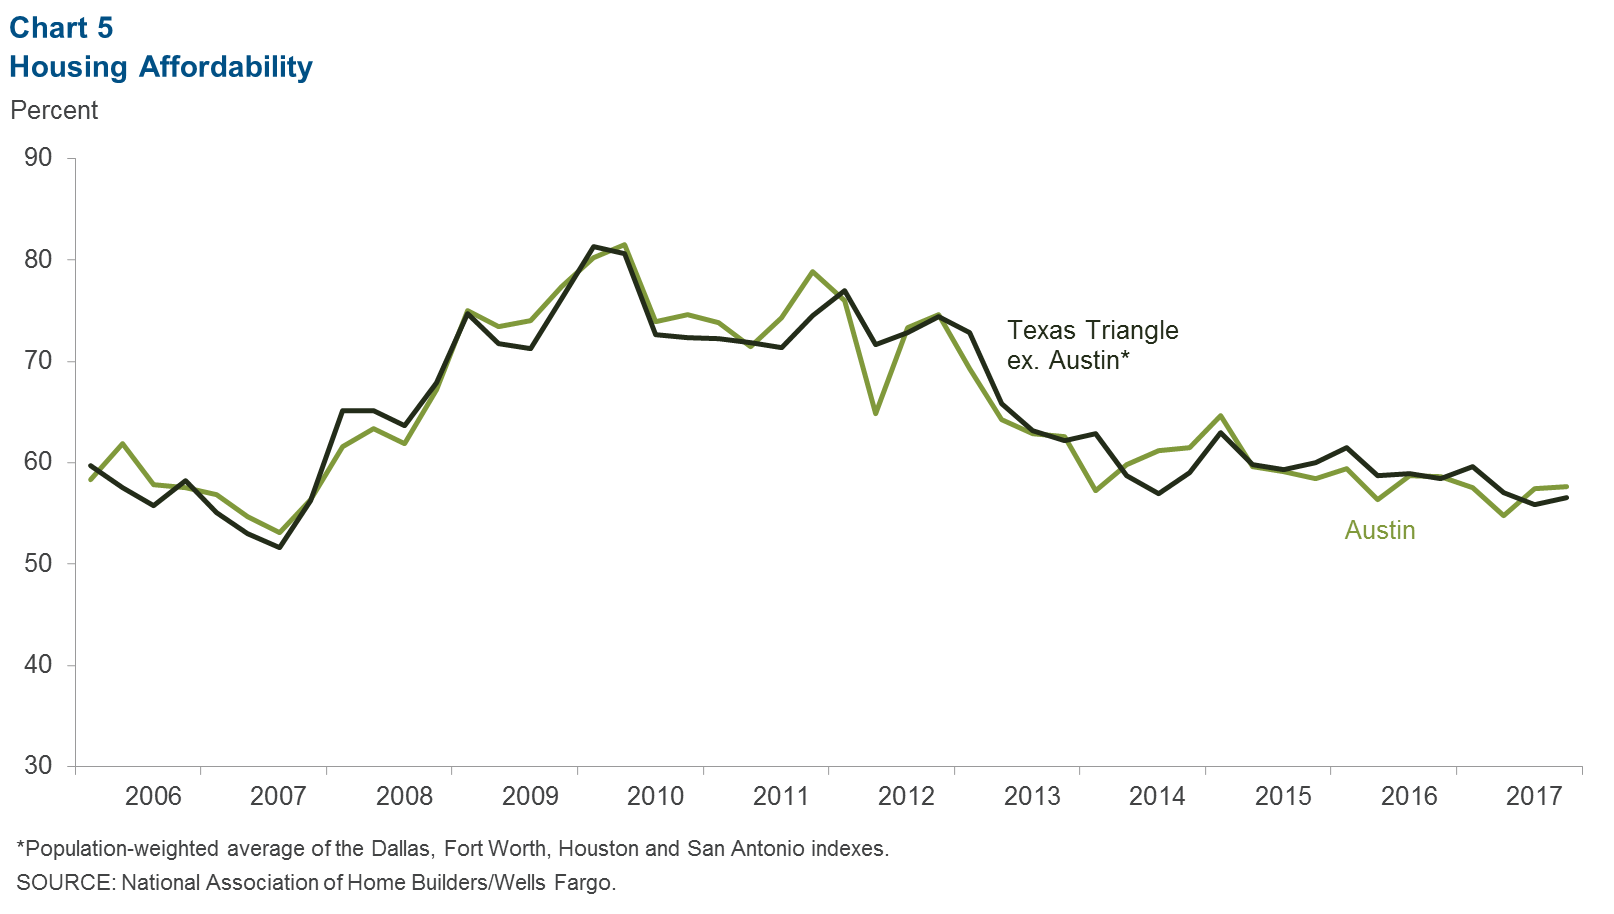
Home Affordability Flat in Fourth Quarter
Home affordability in Austin remained flat in fourth quarter 2017 (Chart 5). Despite the continued rise in home prices, the share of homes sold in Austin that a median-income family could afford was 57.6 percent, compared with the 56.5 percent average for the four other largest metros in Texas. This is due to the higher wages and salaries in Austin. Nevertheless, in 2017 the price distribution of homes sold in Austin continued to shift upward, with only 14.4 percent of homes sold priced below $200,000. By comparison, the number of homes sold below $200,000 was 41.6 percent for the state as a whole, according to the Real Estate Center at Texas A&M University.
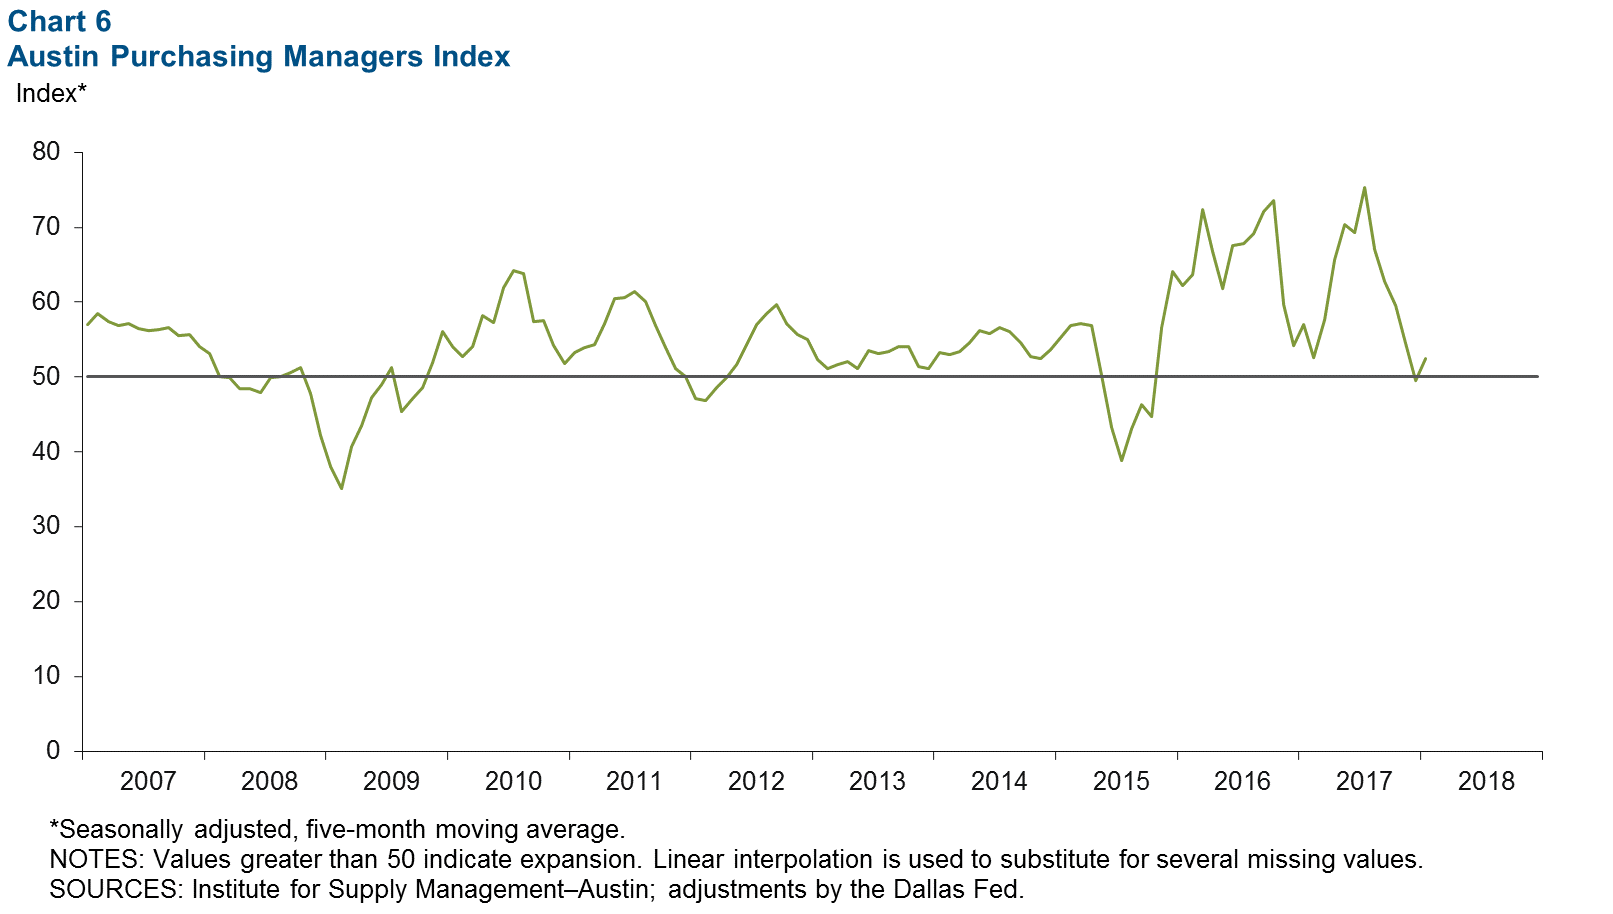
Austin Purchasing Managers Index
The Austin Purchasing Managers Index indicated weak but positive growth in the region’s manufacturing sector. The index’s five-month moving average picked up to 52.5 in January (Chart 6). The PMI components were mixed, with the production index slipping to 46.9, indicating some decline in manufacturing output. However, forward-looking indicators were strongly positive, with the new orders index still high at 83.5.
NOTE: Data may not match previously published numbers due to revisions.
About Austin Economic Indicators
Questions can be addressed to Christopher Slijk at christopher.slijk@dal.frb.org. Austin Economic Indicators is released on the first Thursday of every month.