Austin Economic Indicators

Austin economic activity accelerated in February. The Austin Business-Cycle Index grew at its fastest pace since late 2015, bolstered by strong employment growth over the first two months of this year. The unemployment rate increased slightly but remained near a two-decade low. Regional real estate indicators point to robust housing growth. Census data for 2017 suggest that Austin’s population growth was well above the state average.
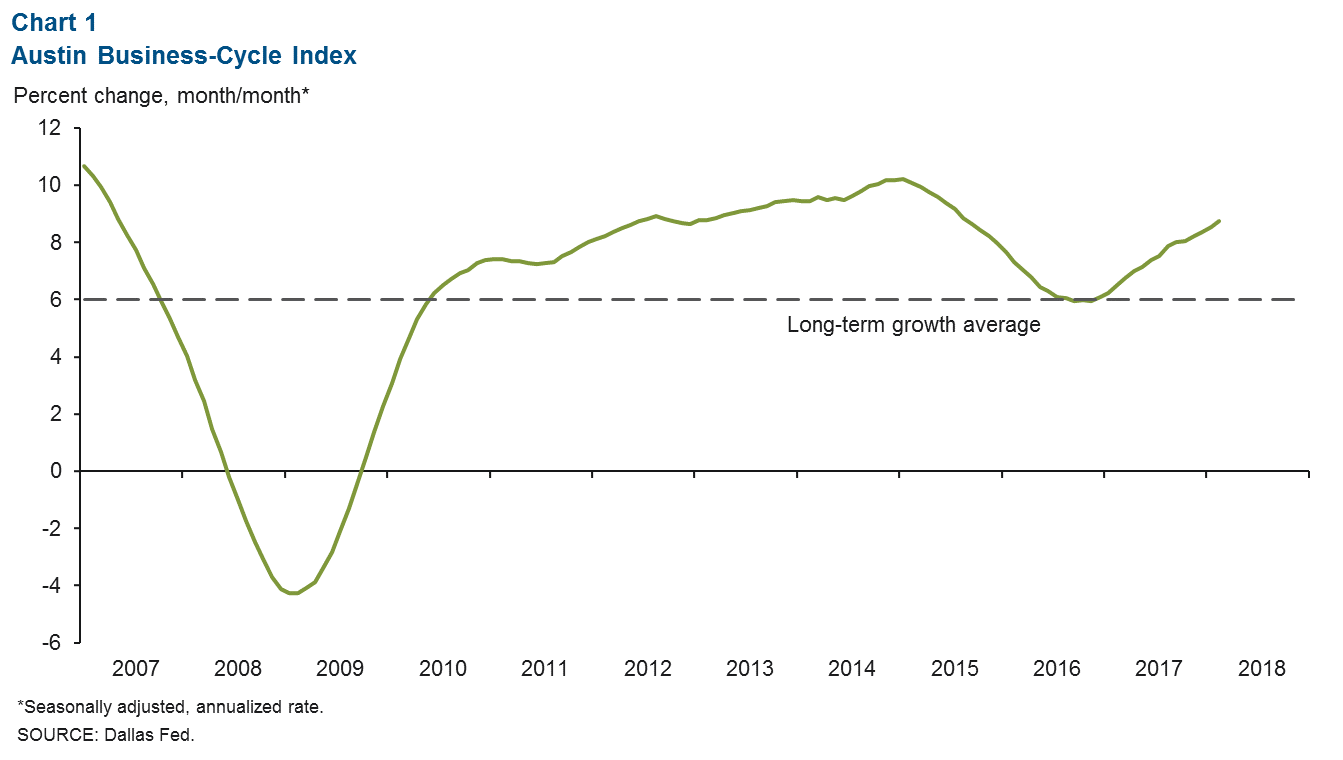
Austin Business-Cycle Index
The Austin Business-Cycle Index grew at an 8.7 percent pace in February (Chart 1). This is well above the 6 percent long-term growth rate of the index and last year’s 7.4 percent rate. Job growth of over 7 percent in January and February was a significant boost to the index.
Labor Market
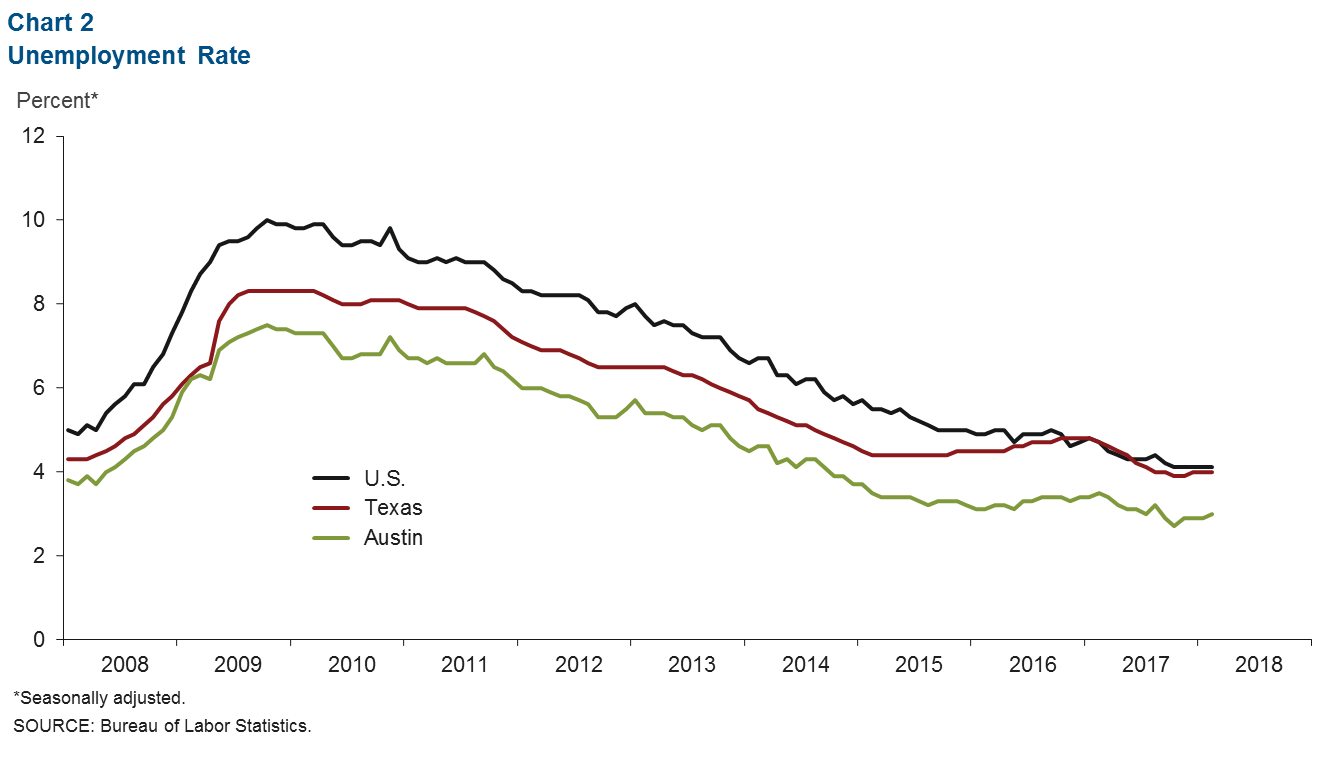
Unemployment Rate Lowest Among Major State Metros
Austin’s unemployment rate was 3.0 percent in February, up from an 18-year low of 2.7 percent in October (Chart 2). This increase was due to a surge in the local labor force, which grew at an 8.6 percent annualized rate in the first two months of 2018—significantly faster than last year’s 3 percent. The state and U.S. jobless figures held steady at 4.0 and 4.1 percent, respectively.
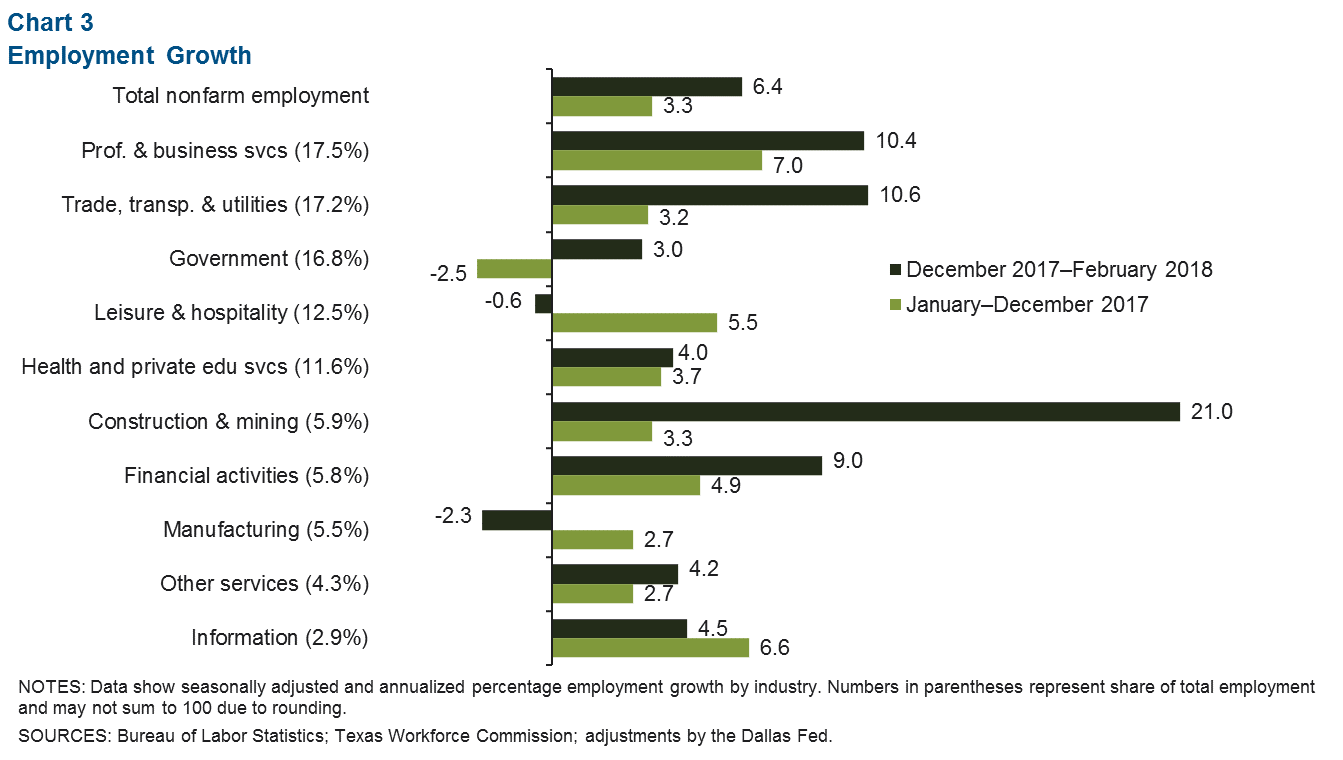
Employment Accelerates Through February
Austin jobs grew at a robust 6.4 percent annualized rate over the three months through February (Chart 3). Growth was broad based, with the exception of declines in leisure and hospitality—due to a slowing in food services jobs—and manufacturing—due to a decline in computer and electronics-related jobs. Construction and mining led overall growth, adding 3,000 jobs over this time. Trade, transportation and utilities expansion was driven largely by a surge in wholesale trade, and with similar strong growth in professional and business services, these two industries added a combined 9,100 jobs. Health care, financial activities and government saw healthy growth as well.
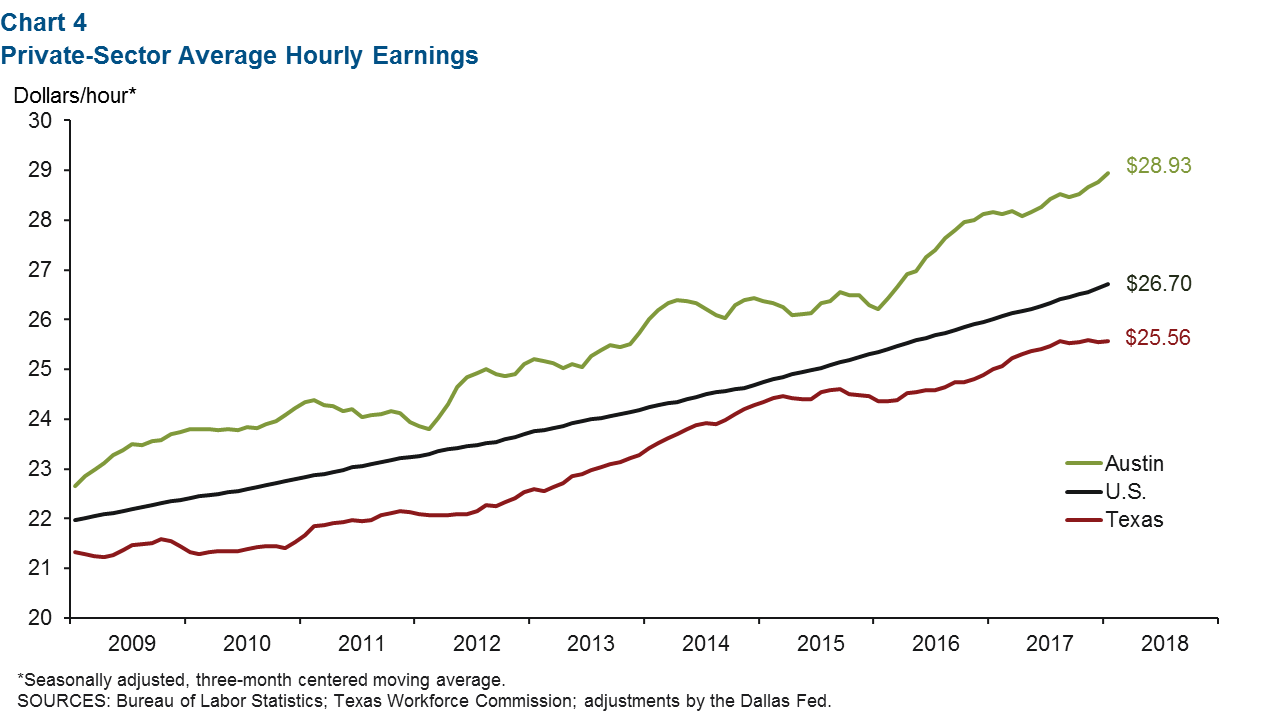
Wage Growth Picking Up
Hourly wages in Austin rose to a new high in February, and the three-month average of $28.93 was well above the U.S. and Texas averages (Chart 4). While year-over-year growth of 2.7 percent was comparable to the nation and above the state’s 2.3 percent, wages over the three months through February accelerated in Austin to a 5.9 percent annualized pace, compared with just 2.9 percent nationally and 0.4 percent statewide. The significant growth in the high-paying professional and financial services sectors in recent months was a contributing factor.
Real Estate
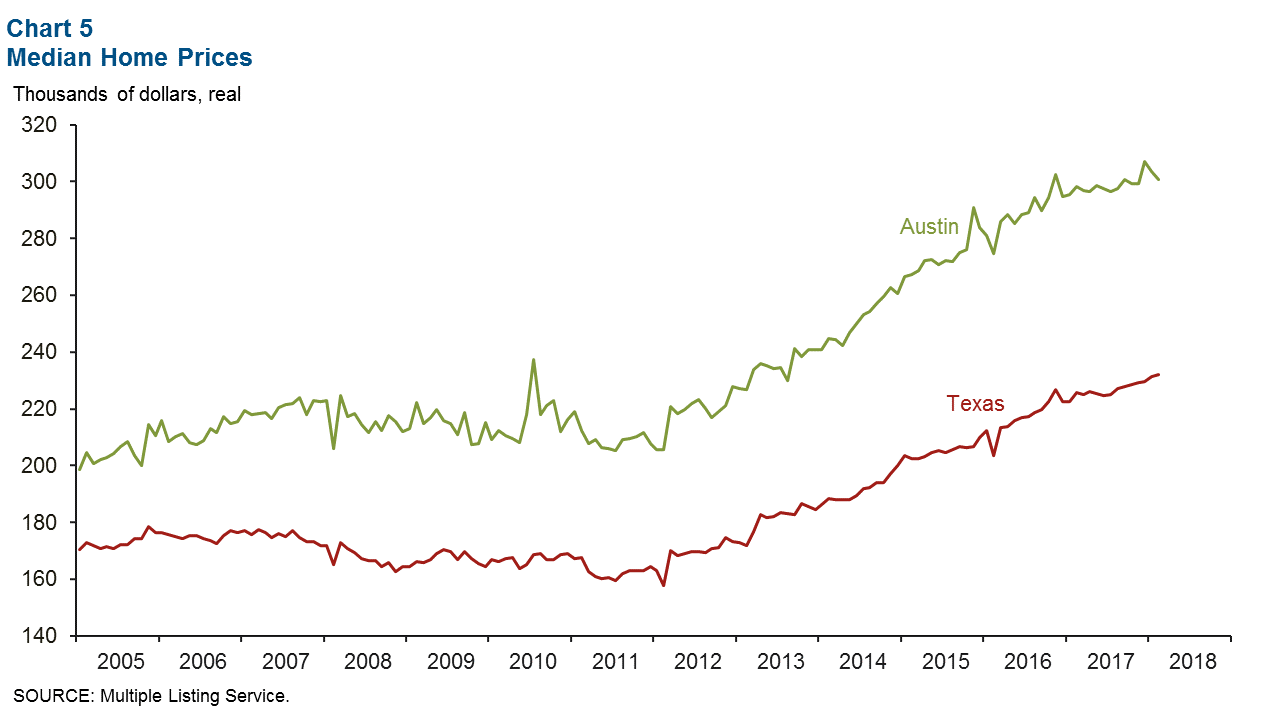
The February median home price in Austin was $300,756, only slightly below the all-time high of $306,862 reached in December 2017 (Chart 5). This puts Austin home prices higher than any of the state’s other large metros and well above the Texas average. Home inventories held at a lean 3.6 months’ supply, while home sales rose sharply.
Population
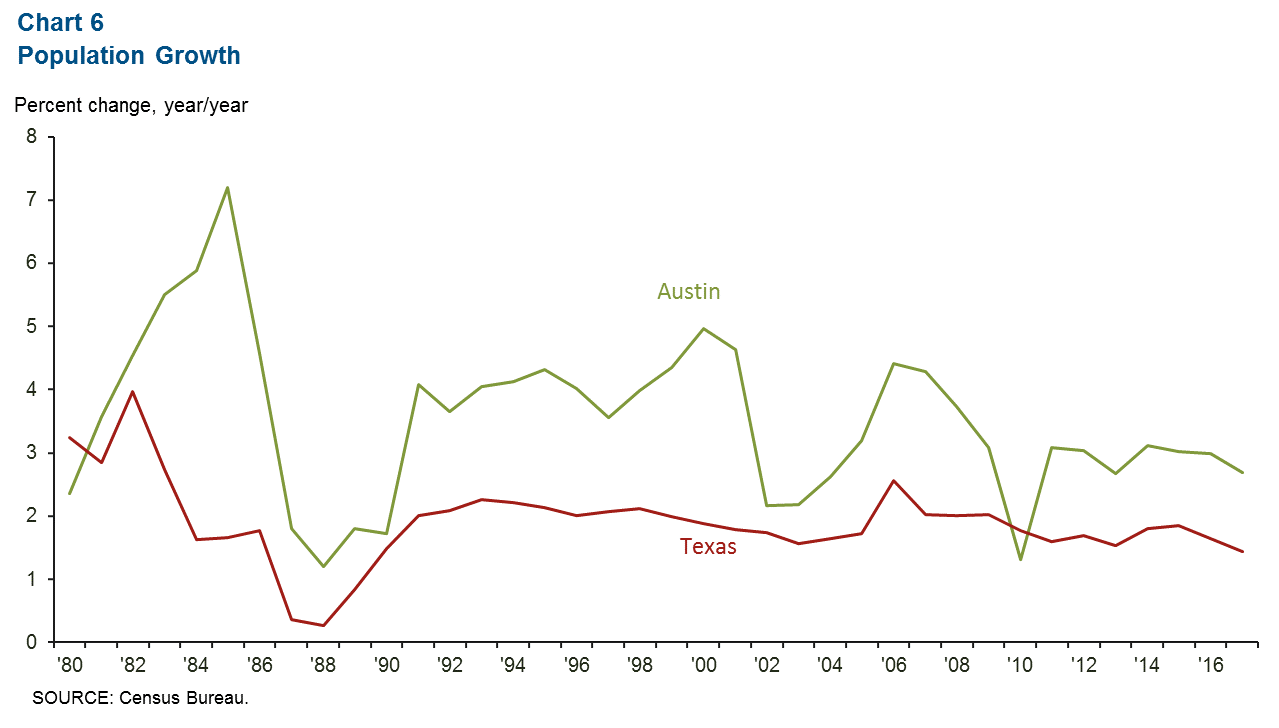
Population expansion in Austin slowed slightly to 2.7 percent in 2017 from 3.0 percent the prior year, below the long-term population growth rate of 3.5 percent since the 1980s (Chart 6). However, this was nearly double the 1.4 percent pace for the state, which has seen population growth slip from a recent high of 1.9 percent in 2015. In comparison, the U.S. has averaged just a 1 percent population increase per year since the early 1980s.
NOTE: Data may not match previously published numbers due to revisions.
About Austin Economic Indicators
Questions can be addressed to Christopher Slijk at christopher.slijk@dal.frb.org. Austin Economic Indicators is released on the first Thursday of every month.