Austin Economic Indicators

Austin economic growth weakened in July. The Austin Business-Cycle Index performed well below its long-term trend. The unemployment rate dipped and job growth softened, but wages inched up. Housing permits expanded, while housing affordability declined.
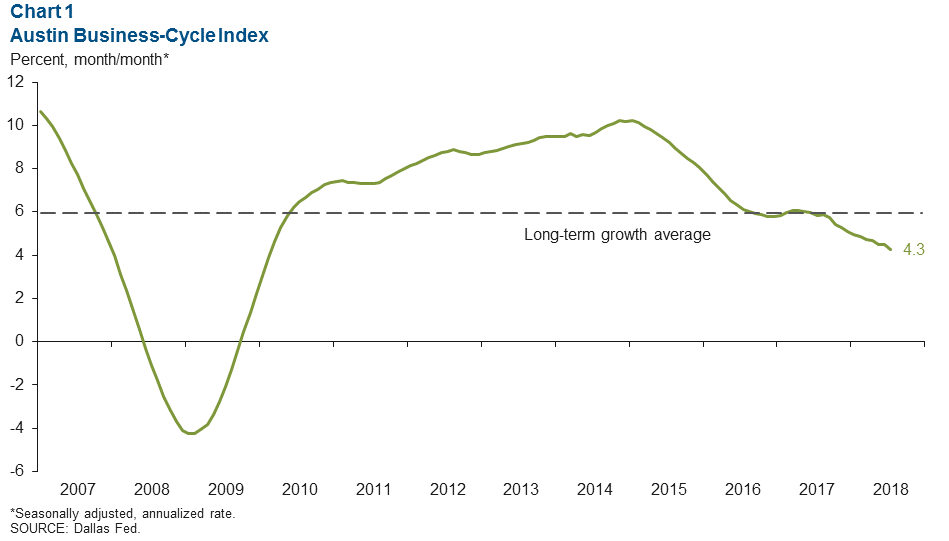
Business-Cycle Index
The Austin Business-Cycle Index expanded at a 4.3 percent annualized rate in July, well below the long-run average of 6.0 percent (Chart 1). After a considerable downward revision, the index has now underperformed its historical growth rate each month since mid- 2017.
Labor Market
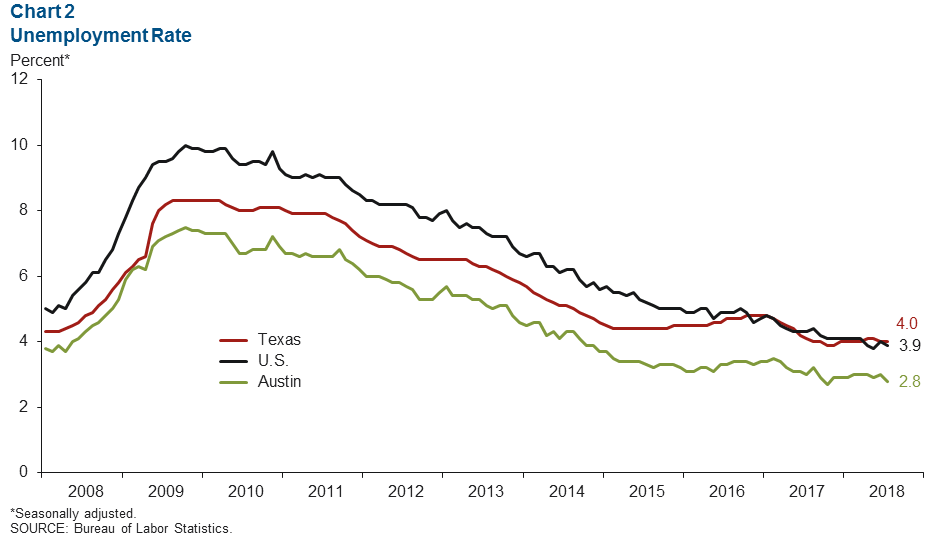
Unemployment Rate Remains Low
Austin’s unemployment rate dipped to 2.8 percent in July, well below its post-recession (January 2010–December 2017) average of 4.8 percent and less than the state and national rates (Chart 2). The Texas unemployment rate held steady for the month, while the U.S. rate ticked down, and both remained well below their long-run averages. The metro’s labor force has expanded an annualized 2.7 percent year to date, near the state’s 3.0 percent increase.
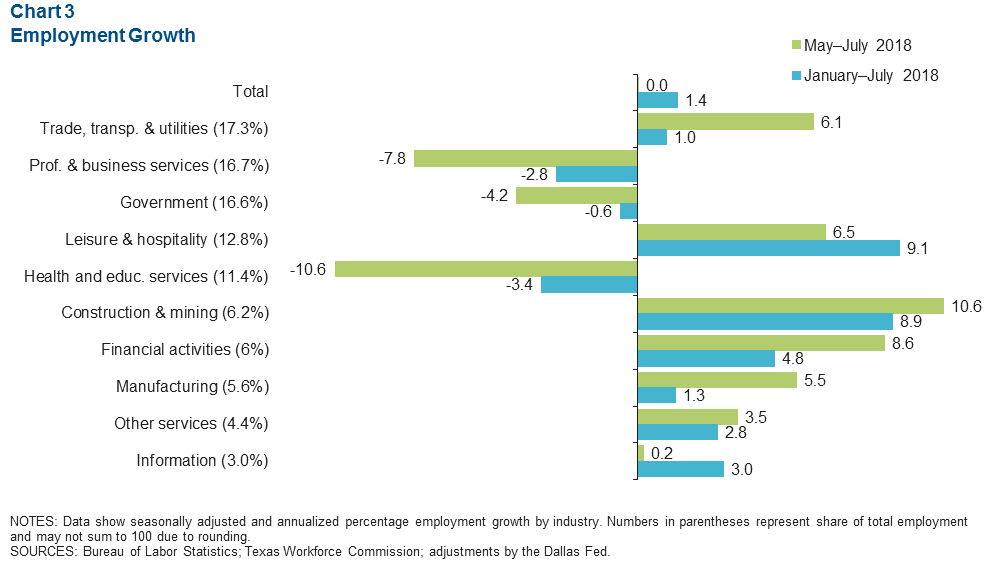
Job Growth Slumps in July
Austin employment levels were flat over the three months through July (Chart 3). The Dallas Fed Early Benchmark for first quarter 2018 shows that the metro has added jobs at a 1.4 percent annualized rate year to date. The metro shed jobs in the professional and business services, government, and health and education services sectors over the same three-month period and year to date. Payrolls in the construction and mining sector expanded a brisk 10.6 percent over the three months through July—the fastest among the sectors.
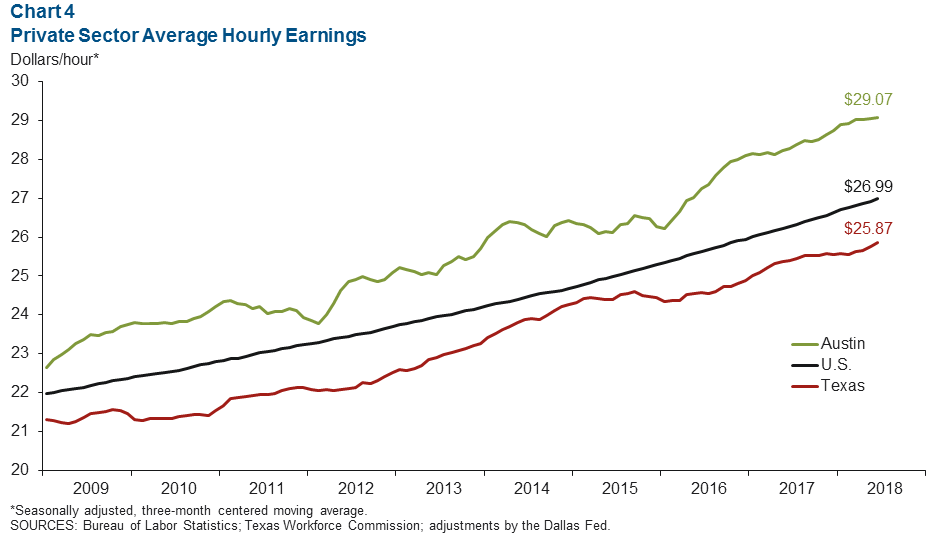
Wages Continue to Climb
The three-month average of hourly wages in Austin climbed to $29.07 in July, and the metro’s wages are 2.0 percent above year-ago levels (Chart 4). Year over year, U.S. wages rose 2.7 percent in the month, faster than Texas’ 1.8 percent increase.
Housing
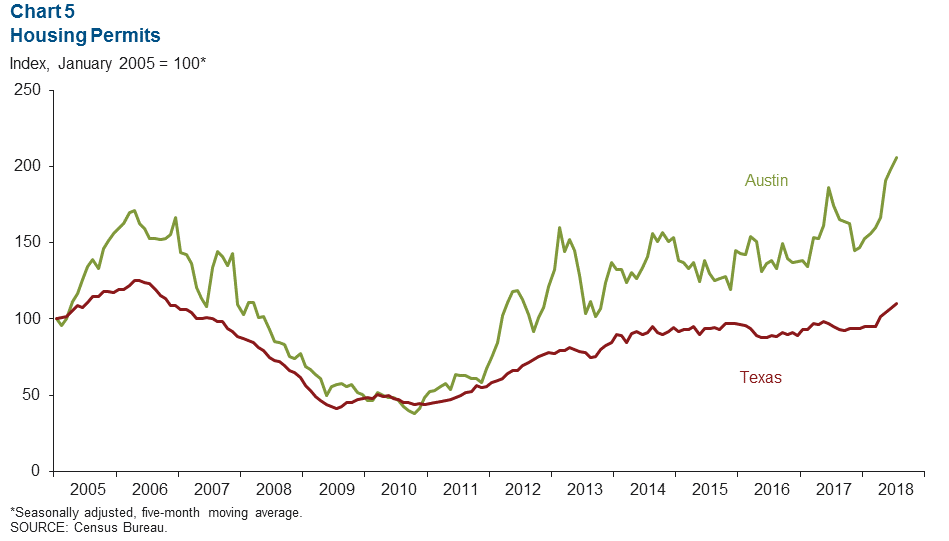
New-Home Permits Surge
The five-month moving average of permits for Austin home construction rose 3.8 percent in July (Chart 5). The number of permits issued in the metro expanded 15.0 percent in the first seven months of 2018 compared with the same period last year, surpassing the state’s 9.7 percent increase.
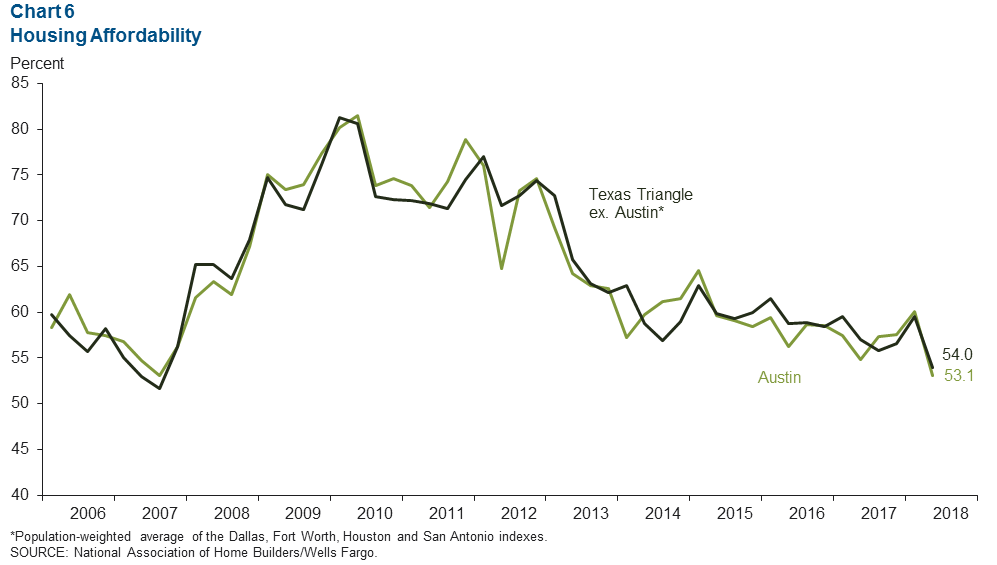
Austin Home Affordability Declines
Austin housing affordability dropped in second quarter 2018, with the percentage of homes sold that a median-income family could afford falling to 53.1 percent, the lowest level since 2007 (Chart 6). Dallas housing affordability was lower at 45.2 percent, while Fort Worth, Houston and San Antonio had higher housing affordability.
Austin home inventories dipped slightly to 2.5 months’ supply in July—well below the six months considered a balanced market—and existing-home sales edged up.
NOTE: Data may not match previously published numbers due to revisions.
About Austin Economic Indicators
Questions can be addressed to Stephanie Gullo at stephanie.gullo@dal.frb.org. Austin Economic Indicators is released on the first Thursday of every month.