Austin Economic Indicators

The Austin economy grew at a solid pace in April. The Austin Business-Cycle Index expanded and remained above its long-term trend. Job growth was brisk, with increases in the construction and mining and financial activities sectors but a sharp decline in retail jobs. Hourly wages continued to tick down in April, while housing affordability improved. Population growth in 2018 slowed from 2017.
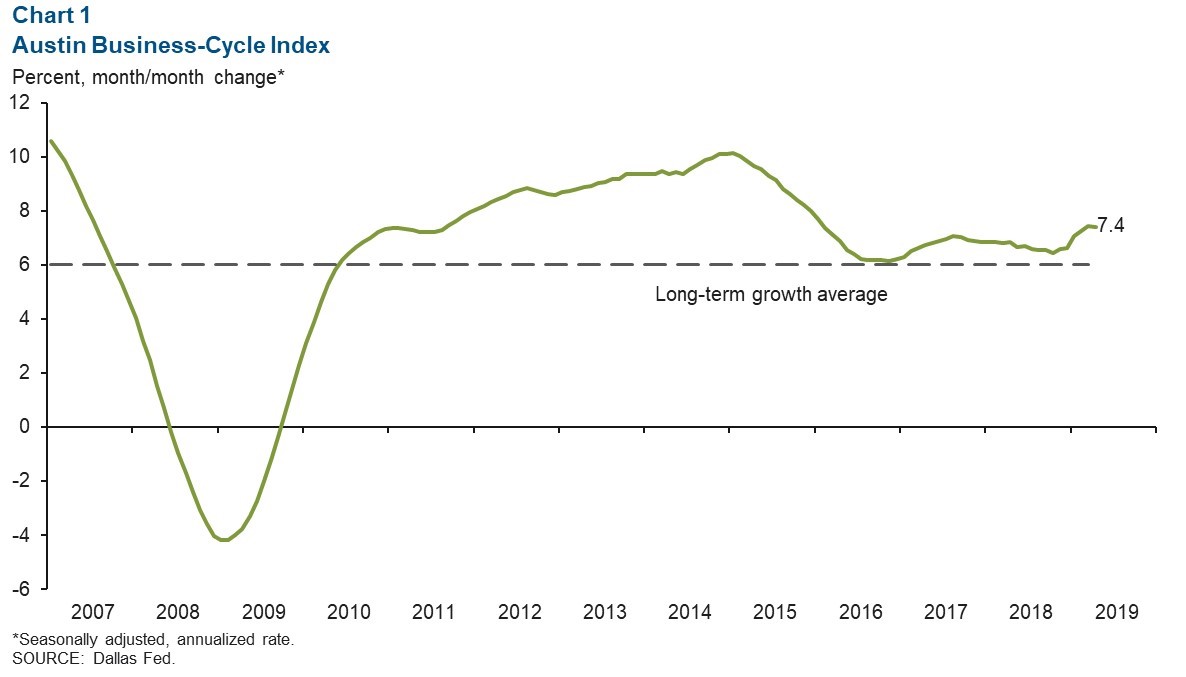
Business-Cycle Index
The Austin Business-Cycle Index expanded at a strong annualized rate of 7.4 percent in April, well above its long-term average of 6 percent (Chart 1). The index was propelled by an 19-year record low in the unemployment rate and strong growth in April payrolls.
Labor Market
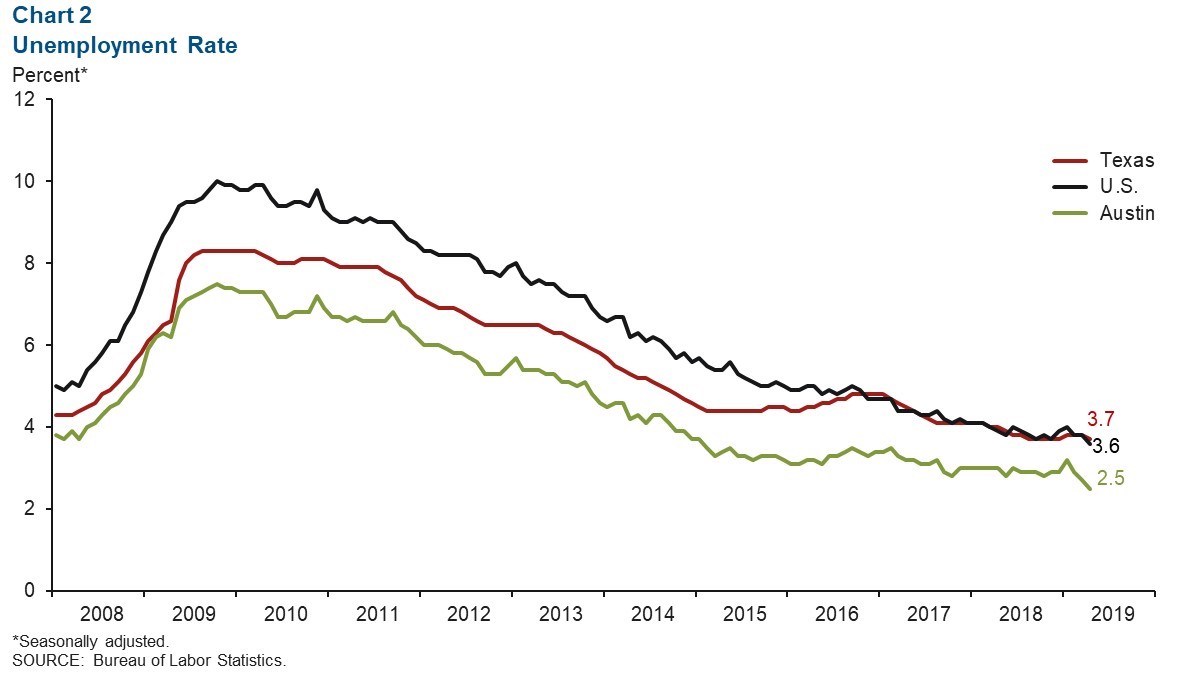
Unemployment Rate at Multiyear Low
Austin’s unemployment rate declined from 2.7 percent to 2.5 percent in April, the lowest posting since December 1999 (Chart 2). The nation (3.6 percent) and state (3.7 percent) also saw their unemployment rates fall in April. The metro’s labor force has expanded at an annualized rate of 0.3 percent so far this year.
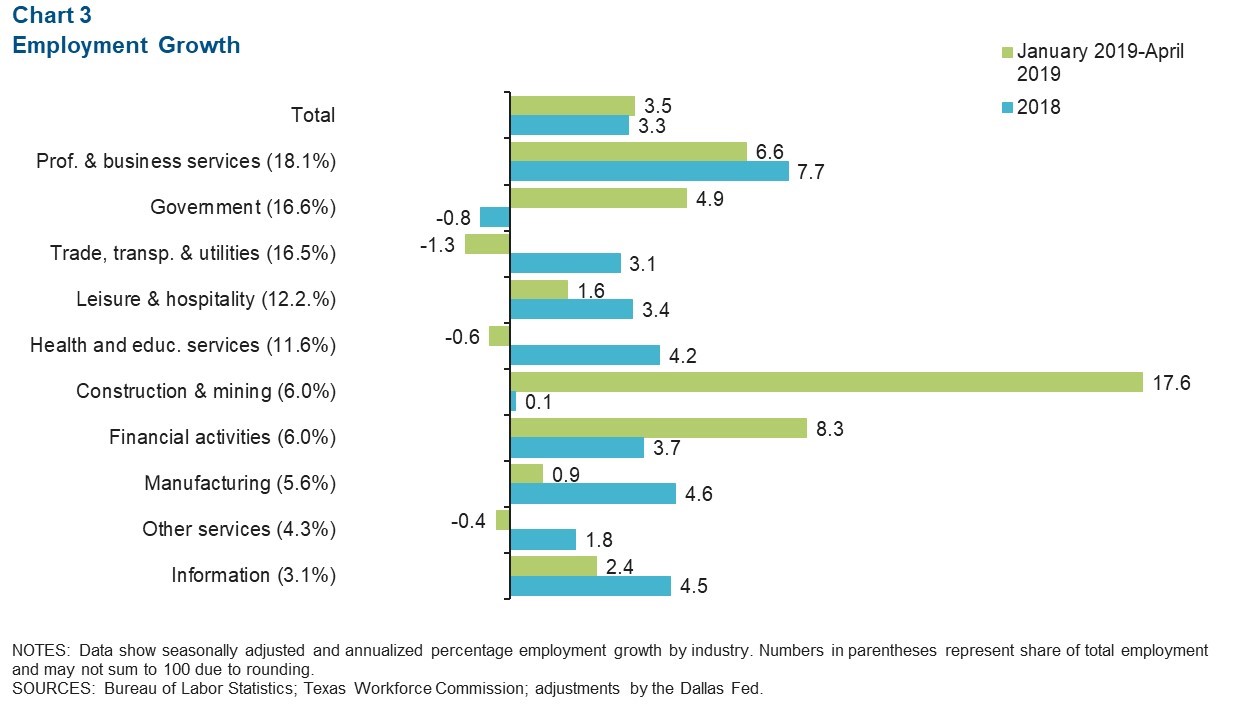
Job Expansion Healthy
The Austin metro added jobs at an annualized rate of 3.5 percent during the three months ending in April (Chart 3). Recently released early benchmarked data show an upward revision to last year’s growth rate to 3.3 percent from the previous estimate of 2.4 percent. Recent job growth was led by the construction and mining sector, which surged at an annualized rate of 17.6 percent, adding a net 2,600 jobs. The financial activities sector grew 8.3 percent (roughly 1,300 jobs), while professional and business services grew 6.6 percent (3,100 jobs) with a boost from the professional, scientific and technical services subsector. An area of weakness was trade, transportation and utilities, which contracted 1.3 percent (600 jobs). The retail trade subsector posted a substantial net loss of approximately 1,850 jobs.
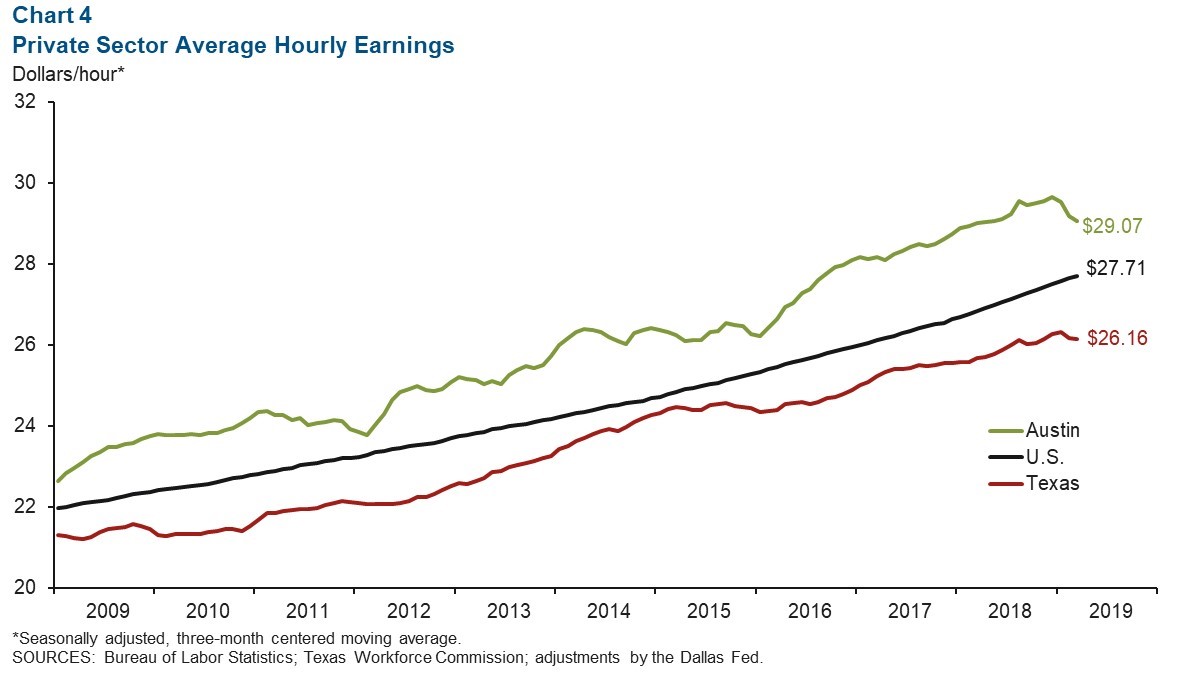
Hourly Wages Dip
Austin’s three-month moving average of private sector hourly wages declined in April for the third consecutive month (Chart 4). The metro’s average wage remained above the Texas and U.S. averages. Austin wages declined 0.7 percent from the same period a year ago, whereas U.S. and Texas wages increased 3.2 percent and 1.2 percent, respectively.
Real Estate
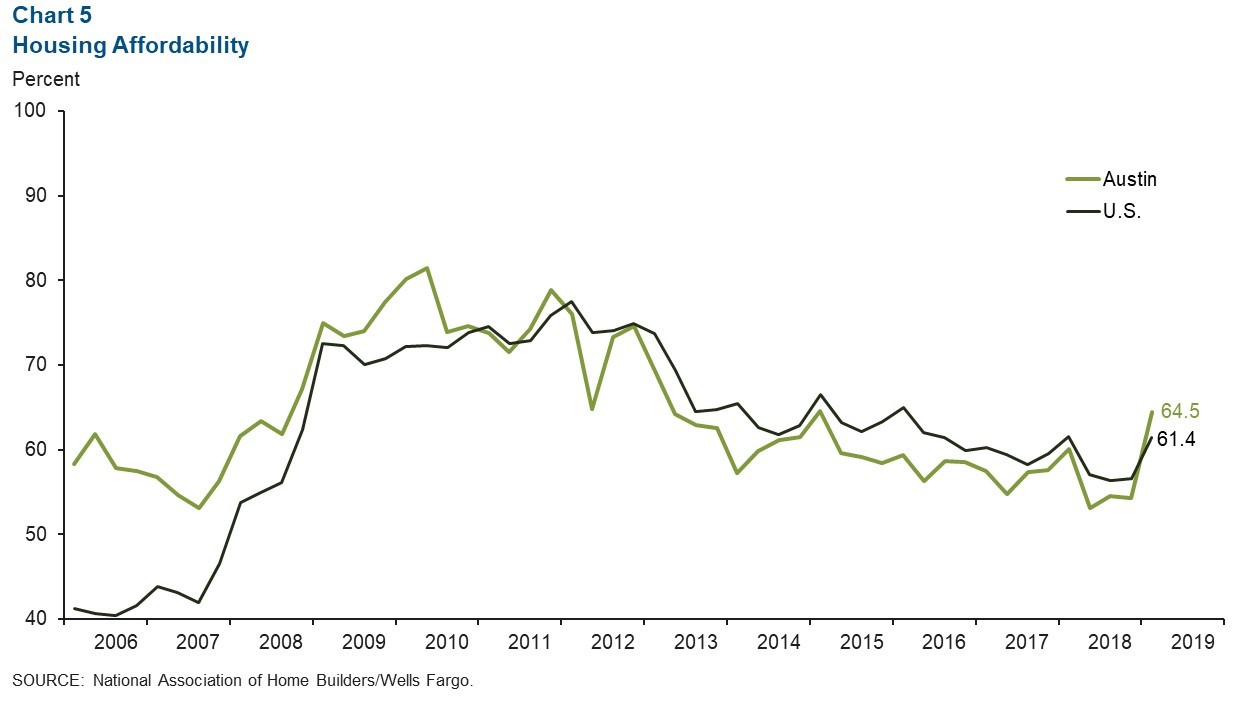
Housing affordability, defined as the percentage of homes sold that the median-income household can afford, increased 10 percentage points from fourth quarter 2018 to first quarter 2019 in Austin (Chart 5). The metro’s median home price has continued to soften in recent months: The three-month centered moving average peaked in September 2018 at $312,975 and stood at $303,562 in March. That compares with $237,575 in the state in March. Austin sales volumes have increased 3.4 percent this year through April from the same period last year—well above the state’s 1.5 percent increase. Inventory in the metro declined from 2.6 months to 2.5 months in April, well below the six months considered a balanced market.
Population
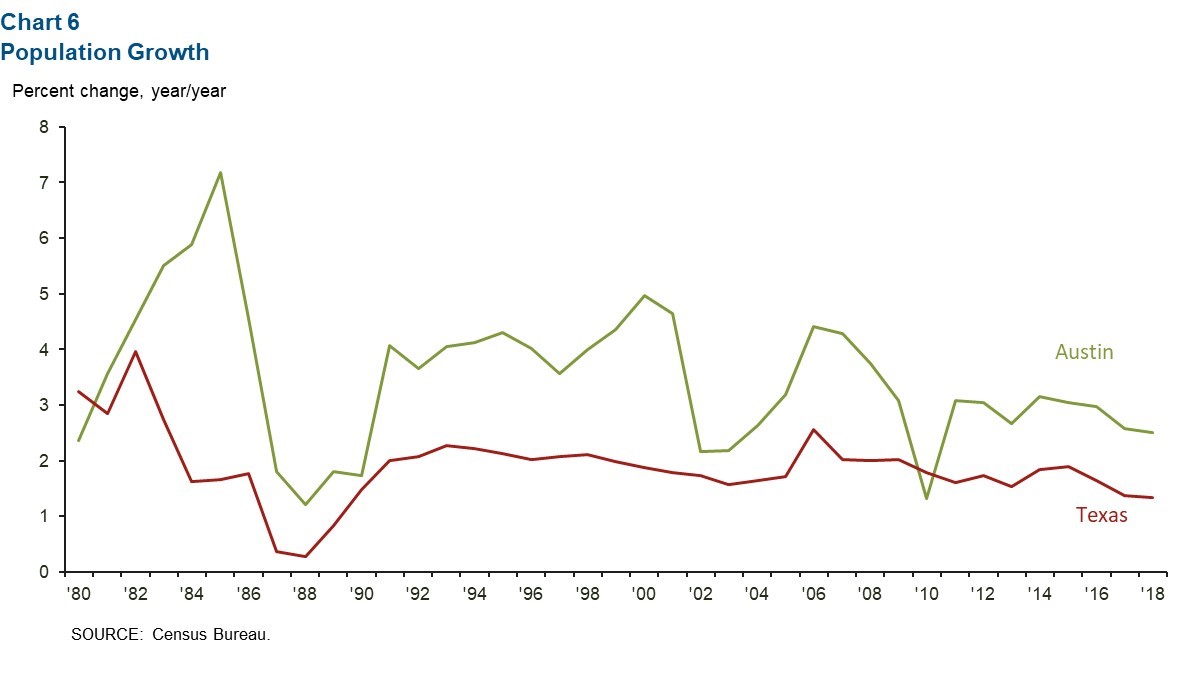
Population growth in Austin decreased in 2018 (Chart 6). According to recently released census data, the metro’s population expanded at a rate of 2.5 percent, slightly slower than 2017’s 2.6 percent rate and well below the long-term average of 3.5 percent. Population growth in Texas was 1.3 percent in 2018, down from 1.4 percent in 2017.
NOTE: Data may not match previously published numbers due to revisions.
About Austin Economic Indicators
Questions can be addressed to Judy Teng at judy.teng@dal.frb.org. Austin Economic Indicators is released on the first Thursday of every month.