Austin Economic Indicators

November 7, 2019
The Austin economy continued to expand in September. The Austin Business-Cycle Index expanded near its long-term growth average. During the third quarter, the labor market remained tight with the jobless rate near historic lows, and jobs grew slightly. Demand for office space remained strong. Housing prices in the metro swelled, while residential construction permits and home sales contracted slightly.
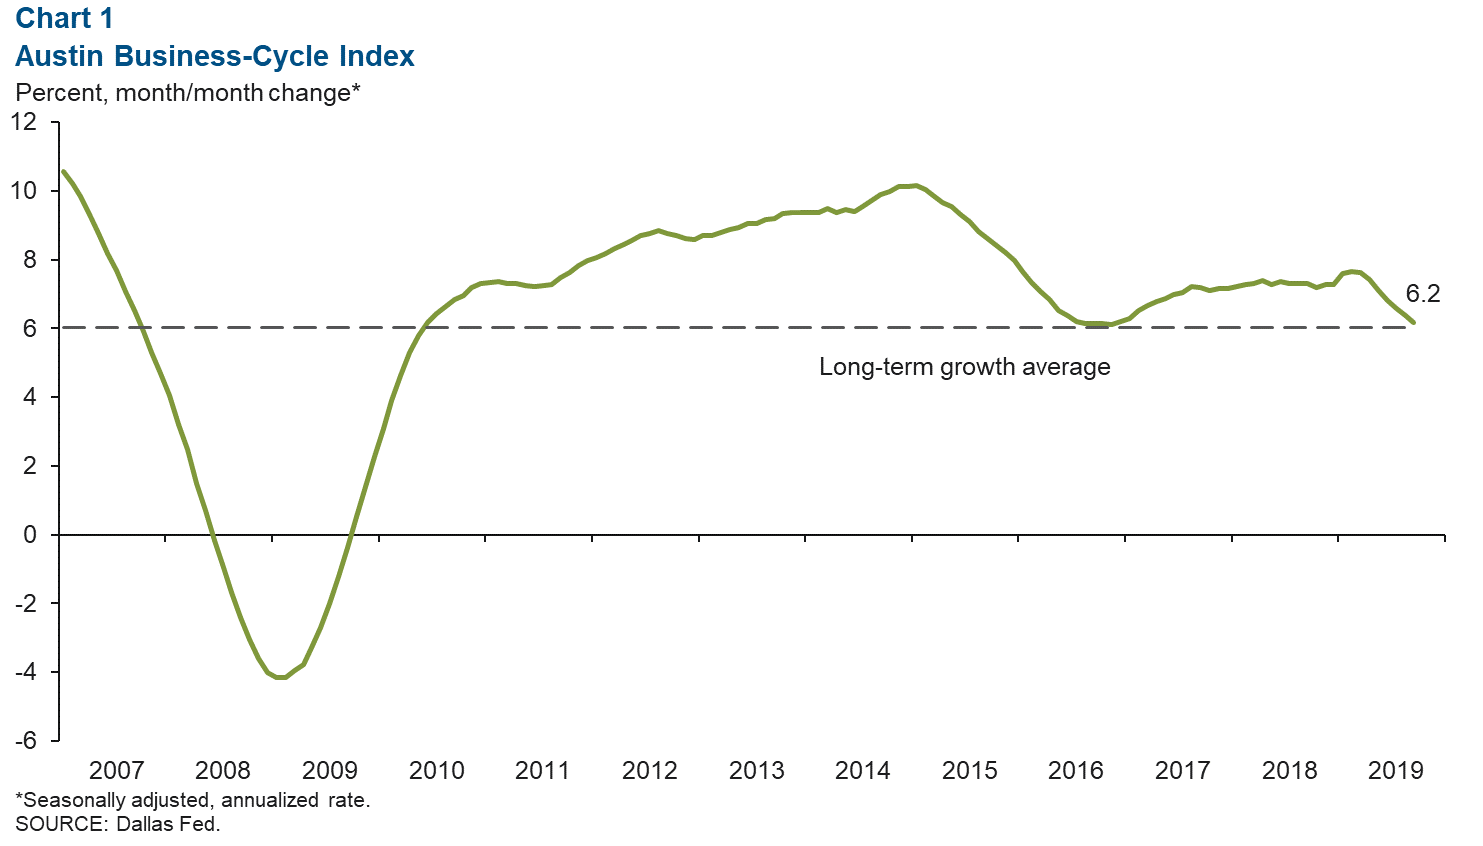
Business-Cycle Index
The Austin Business-Cycle Index expanded at an annualized rate of 6.2 percent from August to September (Chart 1). While the index remains above its long-term average, recent growth in the index likely has been constrained by very tight labor markets. In recent months, job growth has slowed, and the unemployment rate has flattened out—although at a very low rate.
Labor Market
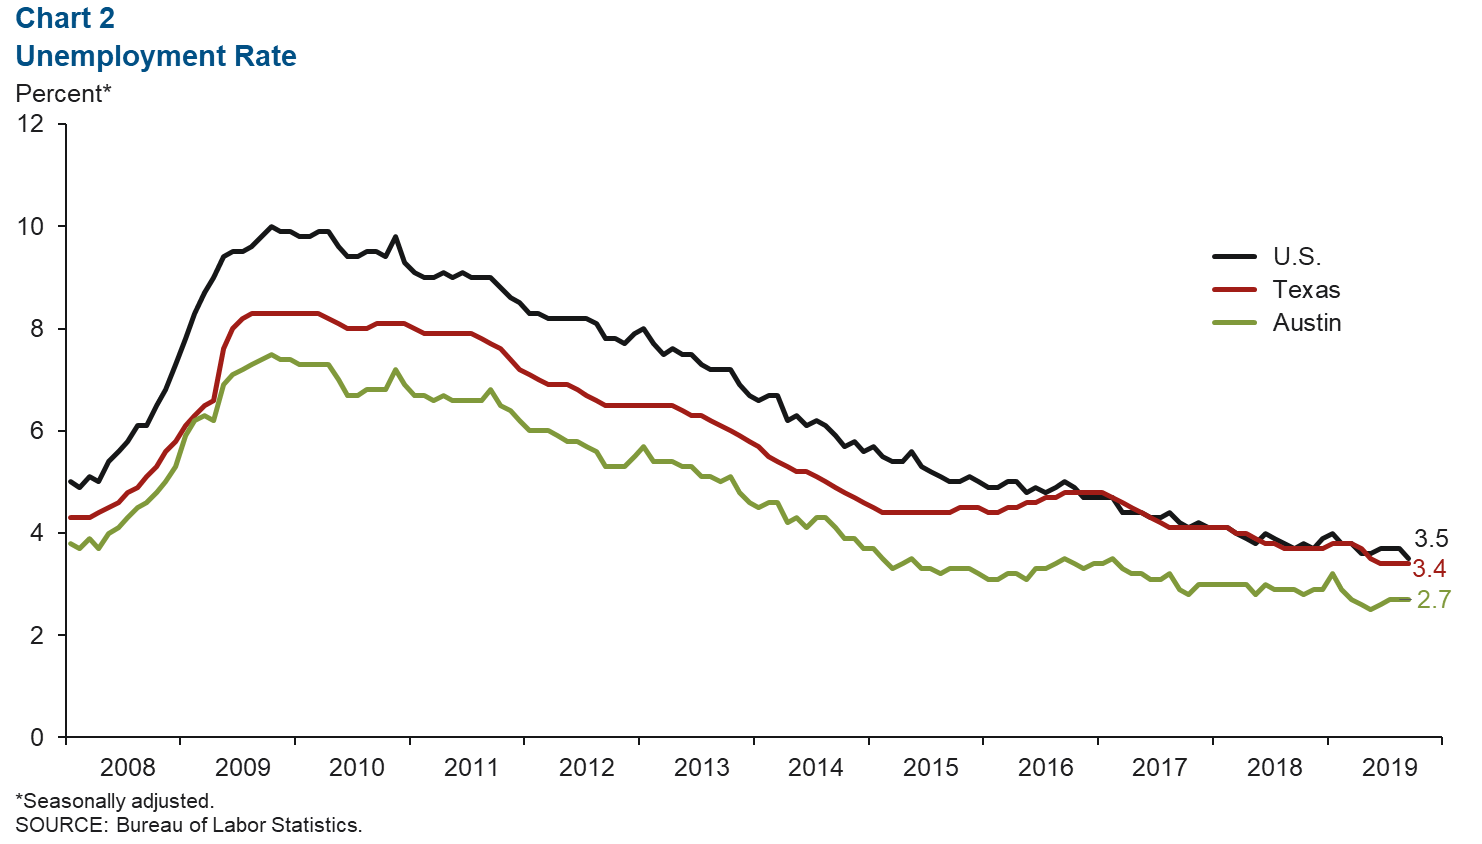
Labor Market Remains Tight
Austin’s unemployment rate was 2.7 percent in September, unchanged since July 2019 (Chart 2). This is lower than both the U.S. (3.5 percent) and Texas (3.4 percent) rates. This year through September, the metro’s labor force grew an annualized 1.3 percent, slower than growth in 2017 (3.6 percent) and 2018 (2.7 percent).
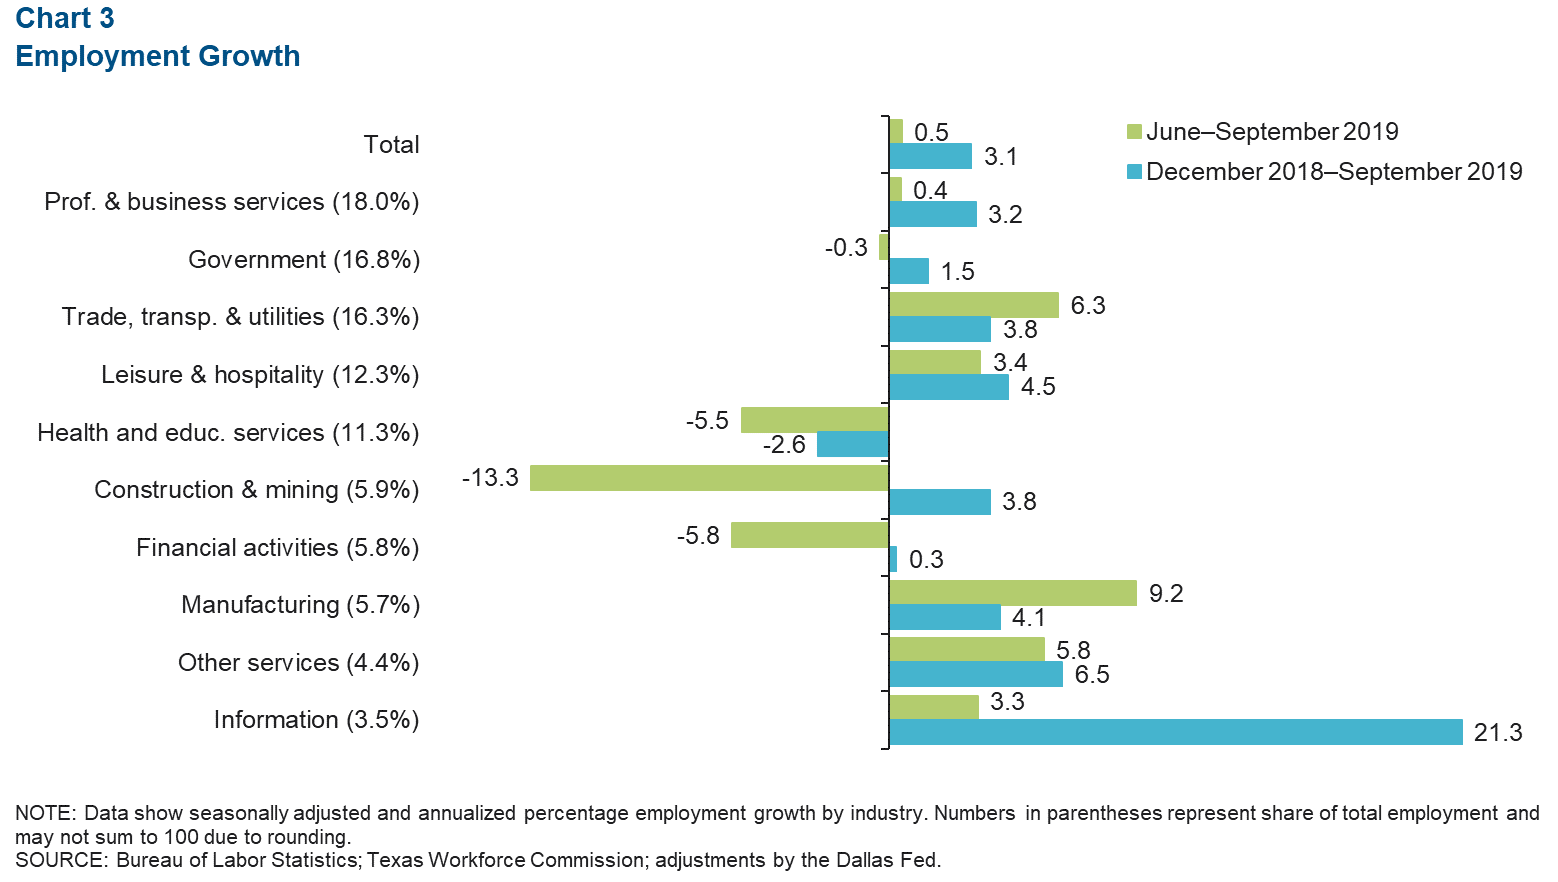
Recent Job Growth Broad Based
The Austin metro added jobs at a sluggish annualized rate of 0.5 percent in the third quarter (Chart 3). Trade, transportation and utilities led growth (2,800 net jobs or 6.3 percent) and was followed by the manufacturing (1,400 jobs or 9.2 percent annualized) and information (300 jobs, or 3.3 percent) sectors. Payrolls contracted in the government (loss of 140 jobs or -0.3 percent), health and private education (loss of 1,770 jobs or -5.5 percent), construction and mining (loss of 2,400 jobs or -13.3 percent) and financial activities (loss of 1,000 jobs or -5.8 percent) sectors.
Real Estate
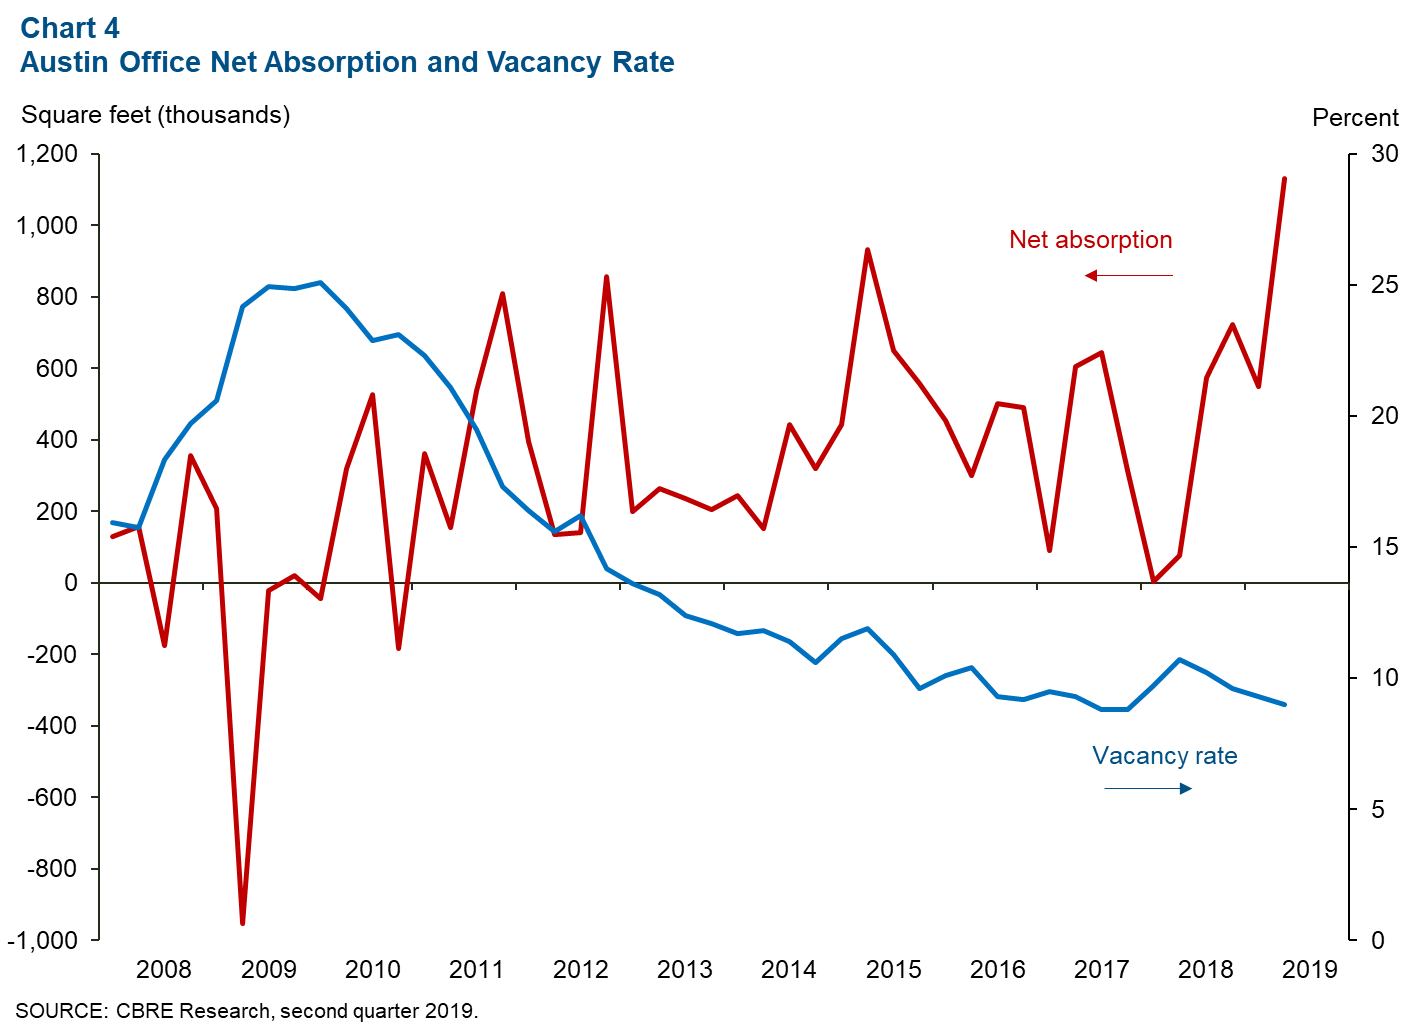
Office Space Demand Booms
Demand for office space boomed in second quarter 2019. Net absorption swelled to 1.1 million square feet, the highest by far since the data series began in 2008 (Chart 4). The vacancy rate declined to 9.0 percent, the lowest rate since fourth quarter 2017. Average asking rents rose a slight 0.5 percent from the previous quarter but increased 5.4 percent year over year.
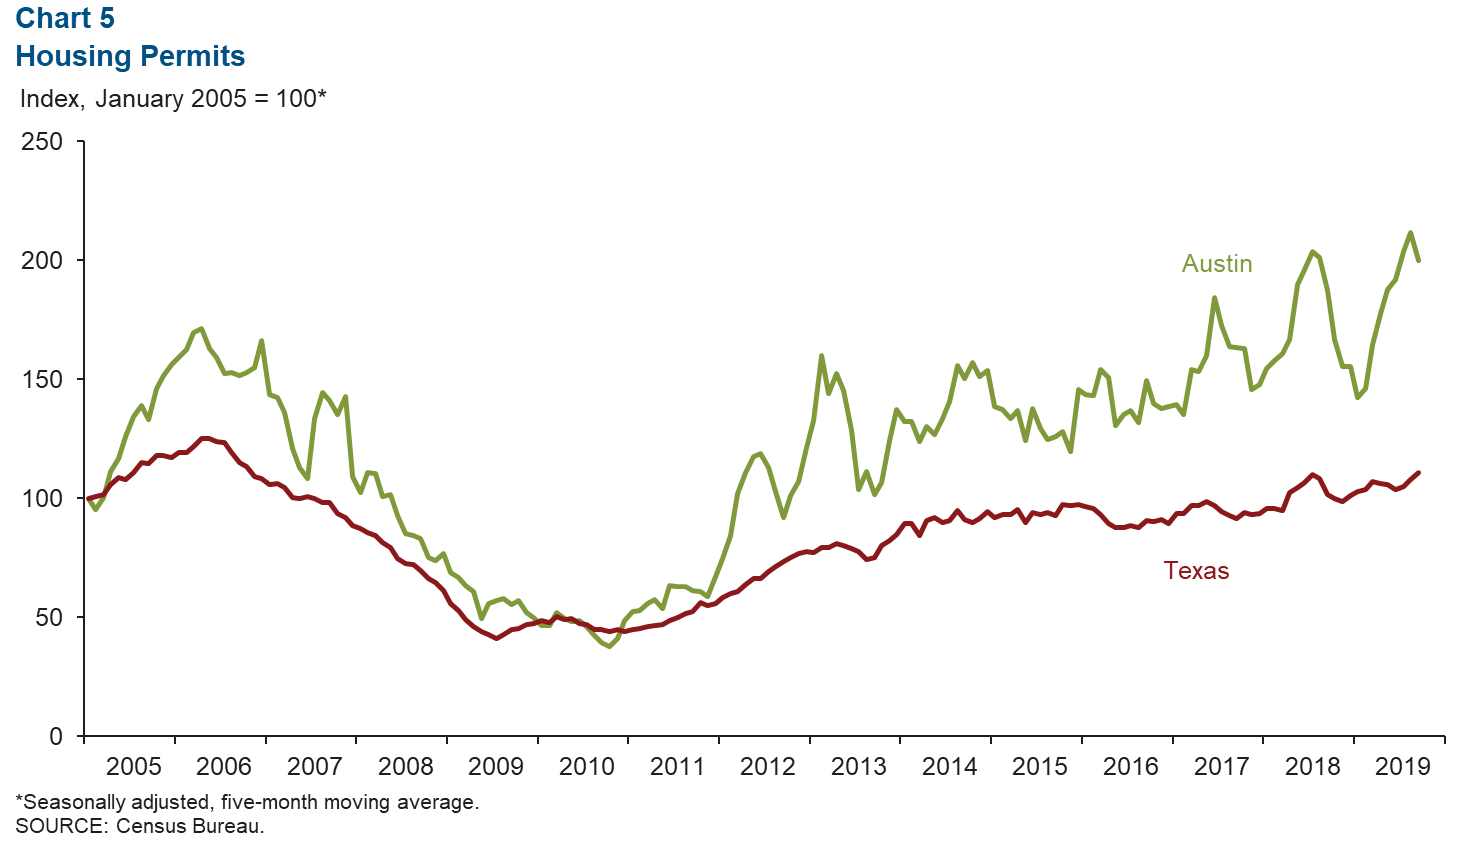
Home Construction Permits Tick Down
The five-month moving average for Austin’s total home construction permits (single family and multifamily) contracted 5.6 percent from August to September, while permits in the state grew 2.9 percent (Chart 5). From December 2018 to September 2019, total permits in Austin expanded 28.7 percent, well above Texas’ 9.4 percent.
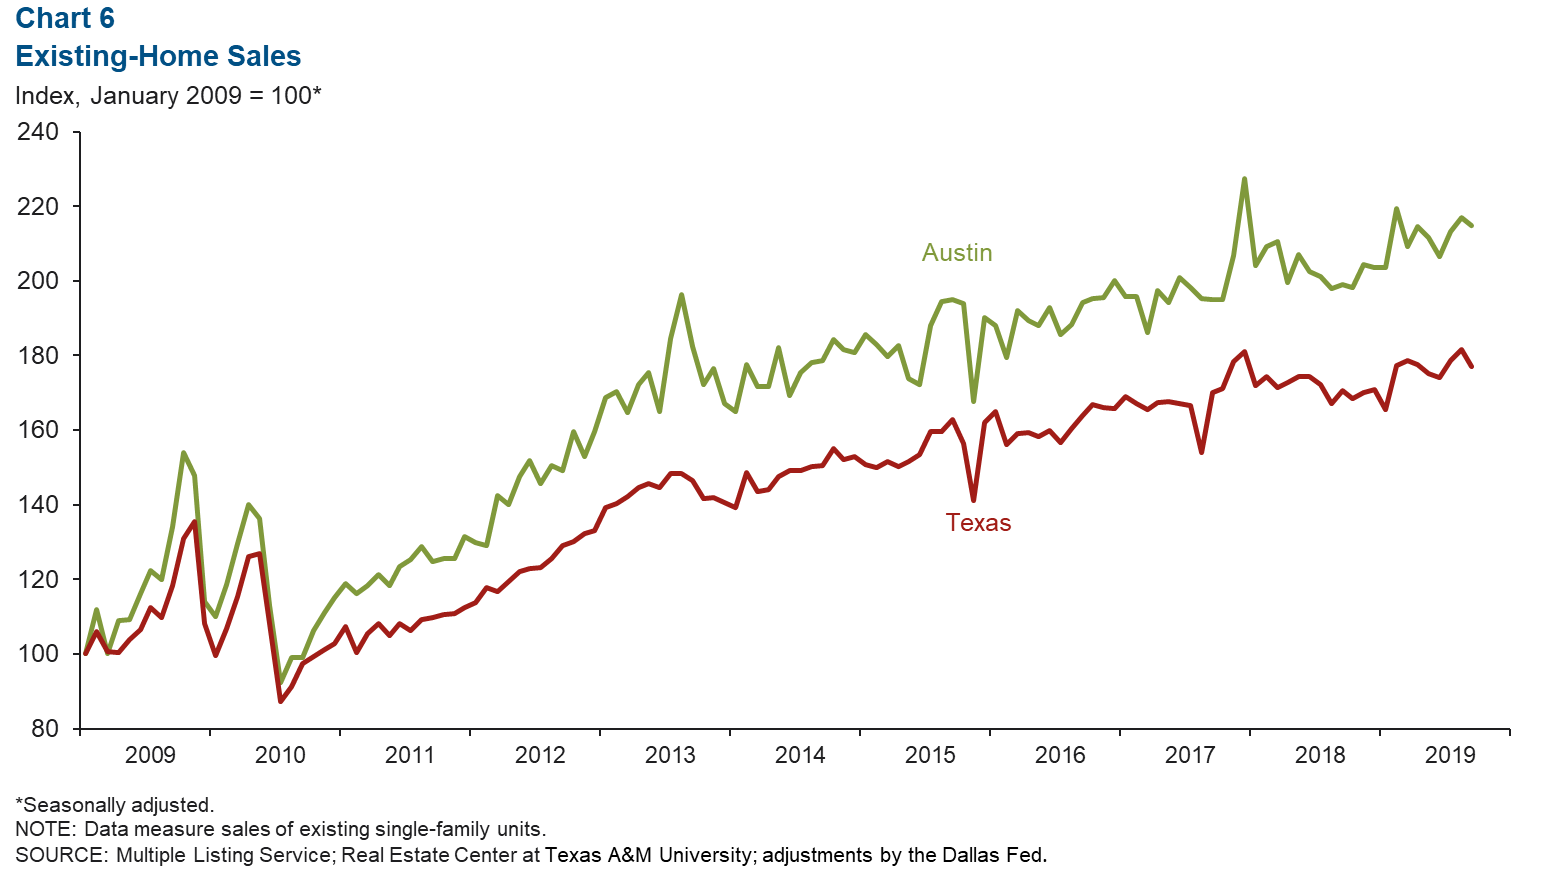
Metro Home Sales Activity Slows
Metro home sales declined 1.0 percent from August to September, and Texas sales fell 2.5 percent (Chart 6). Nonetheless, September home sales in Austin were 5.7 percent higher than the 2018 monthly average and were 3.2 percent higher in Texas. Metro inventory stood at 2.3 months, well below the six months considered a balanced market. The median home price increased 5.2 percent year over year to $327,189 in September, higher than the state’s 3.4 percent growth.
NOTE: Data may not match previously published numbers due to revisions.
About Austin Economic Indicators
Questions can be addressed to Judy Teng at judy.teng@dal.frb.org. Austin Economic Indicators is released on the first Thursday of every month.