Austin Economic Indicators

January 3, 2020
The Austin economy continued to expand in November. The Austin Business-Cycle Index grew near its long-term average. Unemployment remained unchanged from the previous month, while job growth slowed somewhat in recent months. Housing affordability increased in third quarter 2019, metro home sales were robust, and median home prices decreased.
Business-Cycle Index
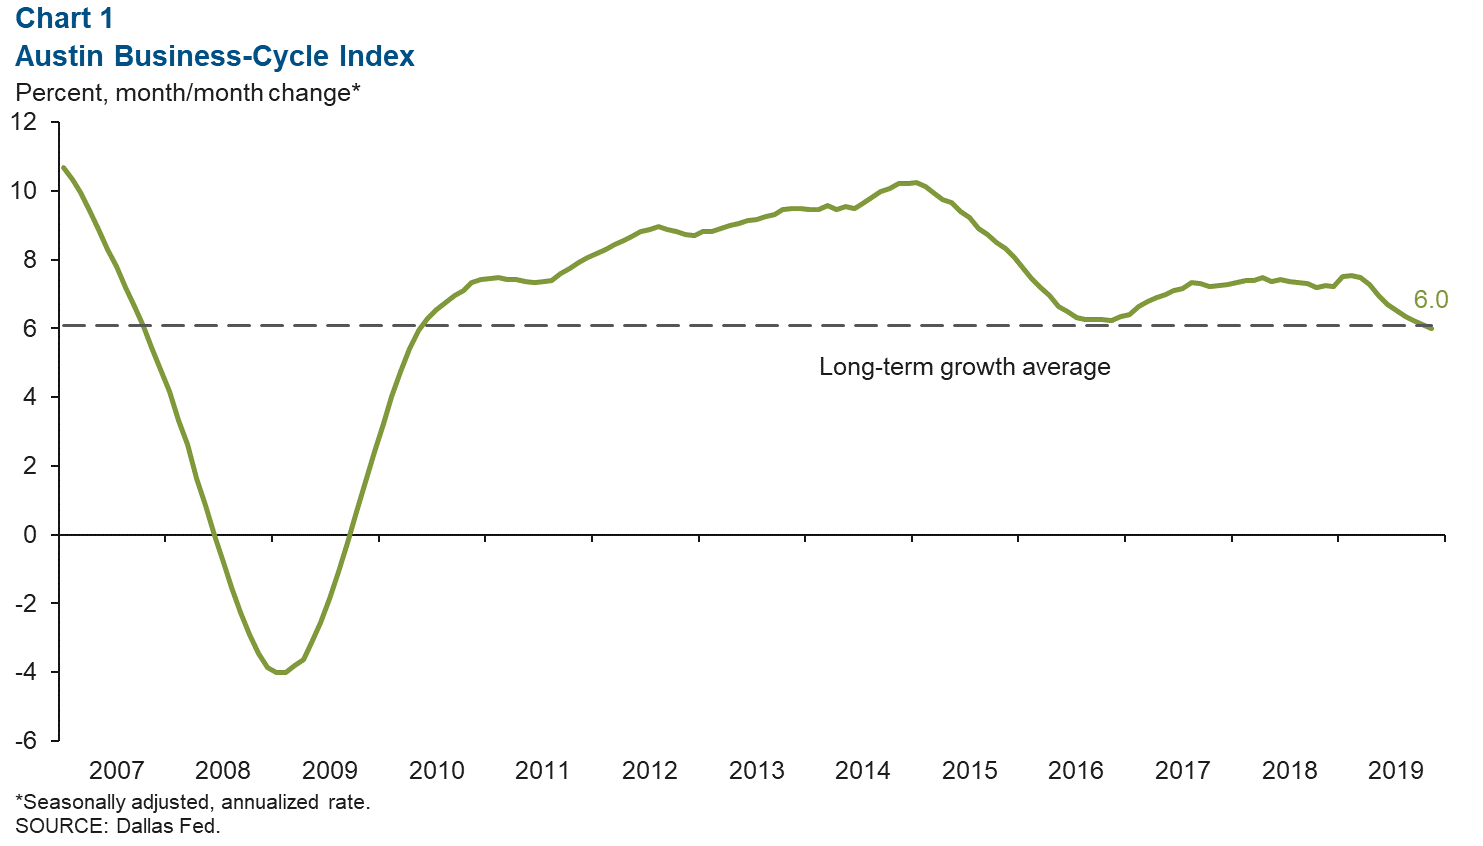
The Austin Business-Cycle Index's November growth marked more than 10 years of consecutive expansion (Chart 1). In November, the index expanded slightly below its long-term average of 6.1 percent—the lowest rate since May 2010. The recent moderation in growth in the index is likely due to tightness in the labor market constraining job growth.
Labor Market
Unemployment Rates Unchanged
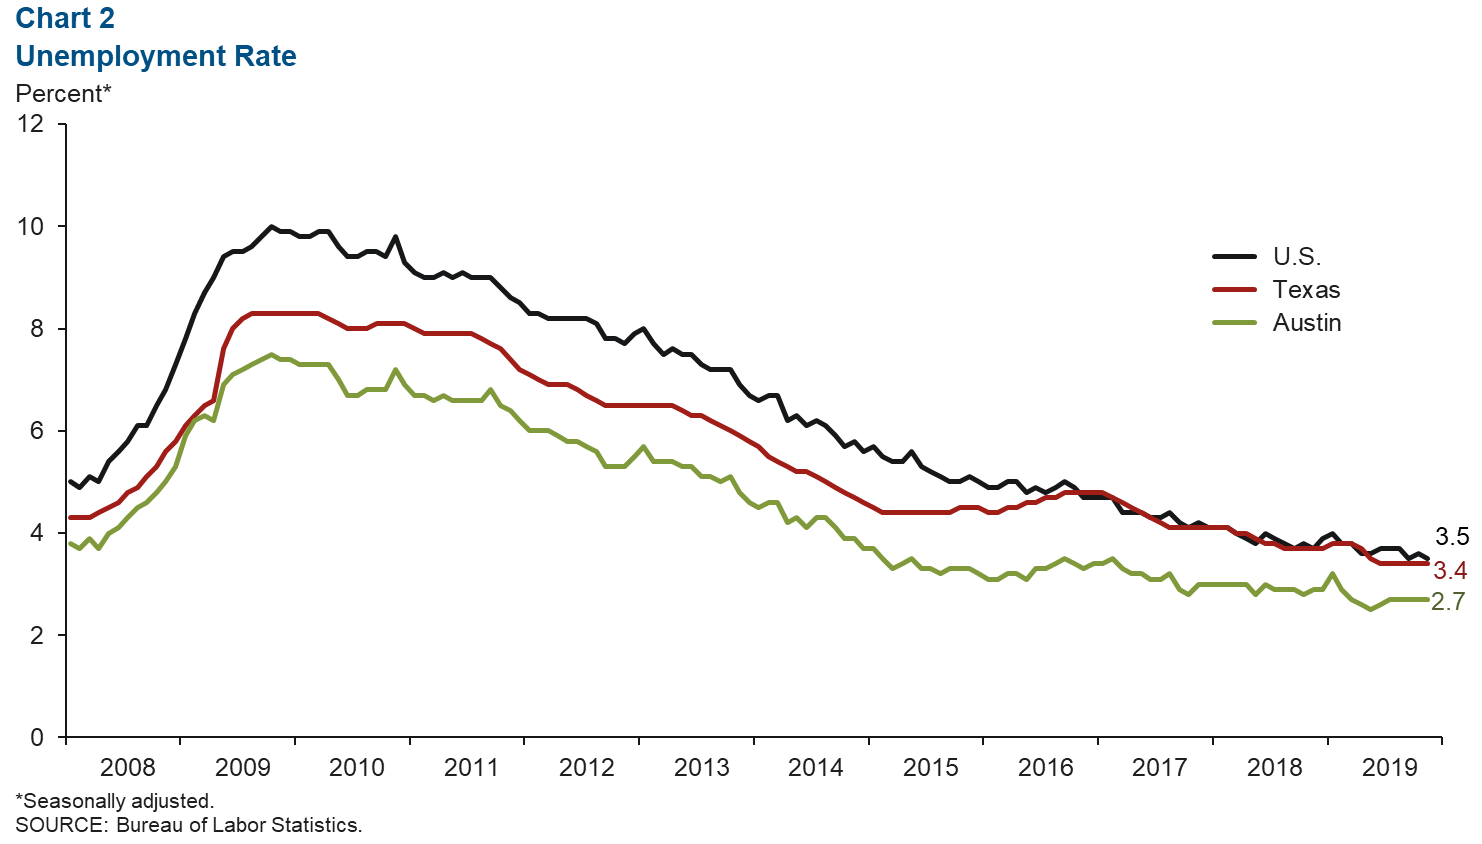
Austin’s unemployment rate lingered at 2.7 percent in November for the fourth consecutive month (Chart 2). The unemployment rate for the state held at 3.4 percent for the fifth consecutive month, while the jobless rate for the U.S. ticked down to 3.5 percent. During the first 11 months of 2019, the metro’s labor force grew 2.1 percent annualized, a slow rate compared with 2017 (3.6 percent) and 2018 (2.7 percent).
Recent Job Growth Slowing
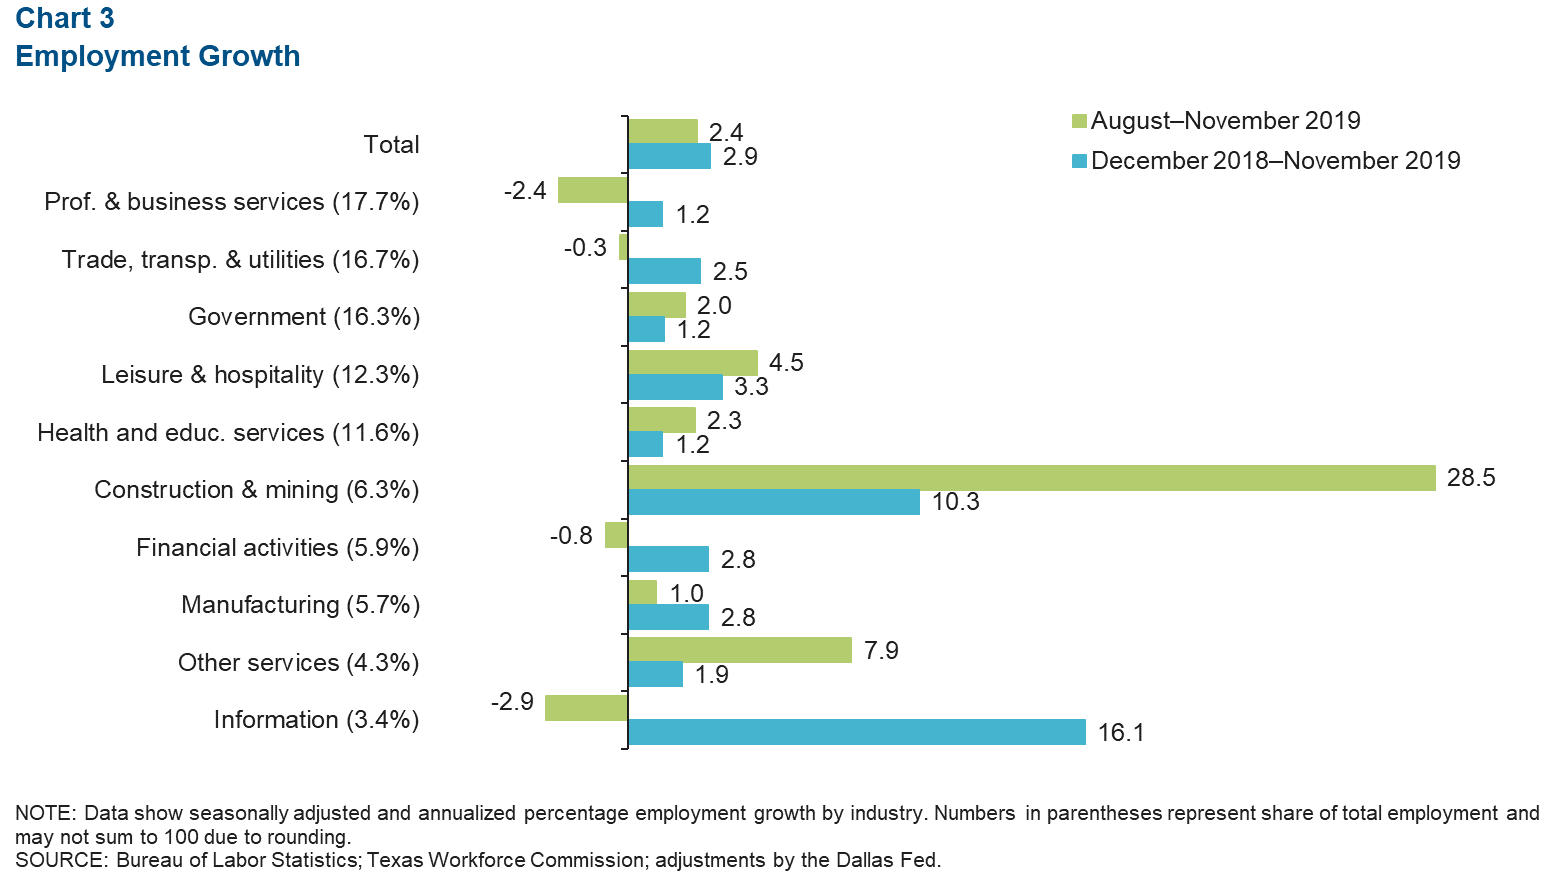
In the three months ending in November, Austin jobs were added at a moderate rate of 2.4 percent, or a net 6,700 jobs (Chart 3). Growth was led by the construction and mining sector, which added 4,200 net jobs (28.5 percent). Other services (7.9 percent; 900 jobs) and leisure and hospitality (4.5 percent; 1,500 jobs) also posted strong growth. Industries that saw net job contractions during this period were professional and business services (-1,200 jobs), information (-290 jobs), financial activities (-130 jobs) and trade, transportation and utilities (-140 jobs).
Real Estate
Home Affordability Increasing
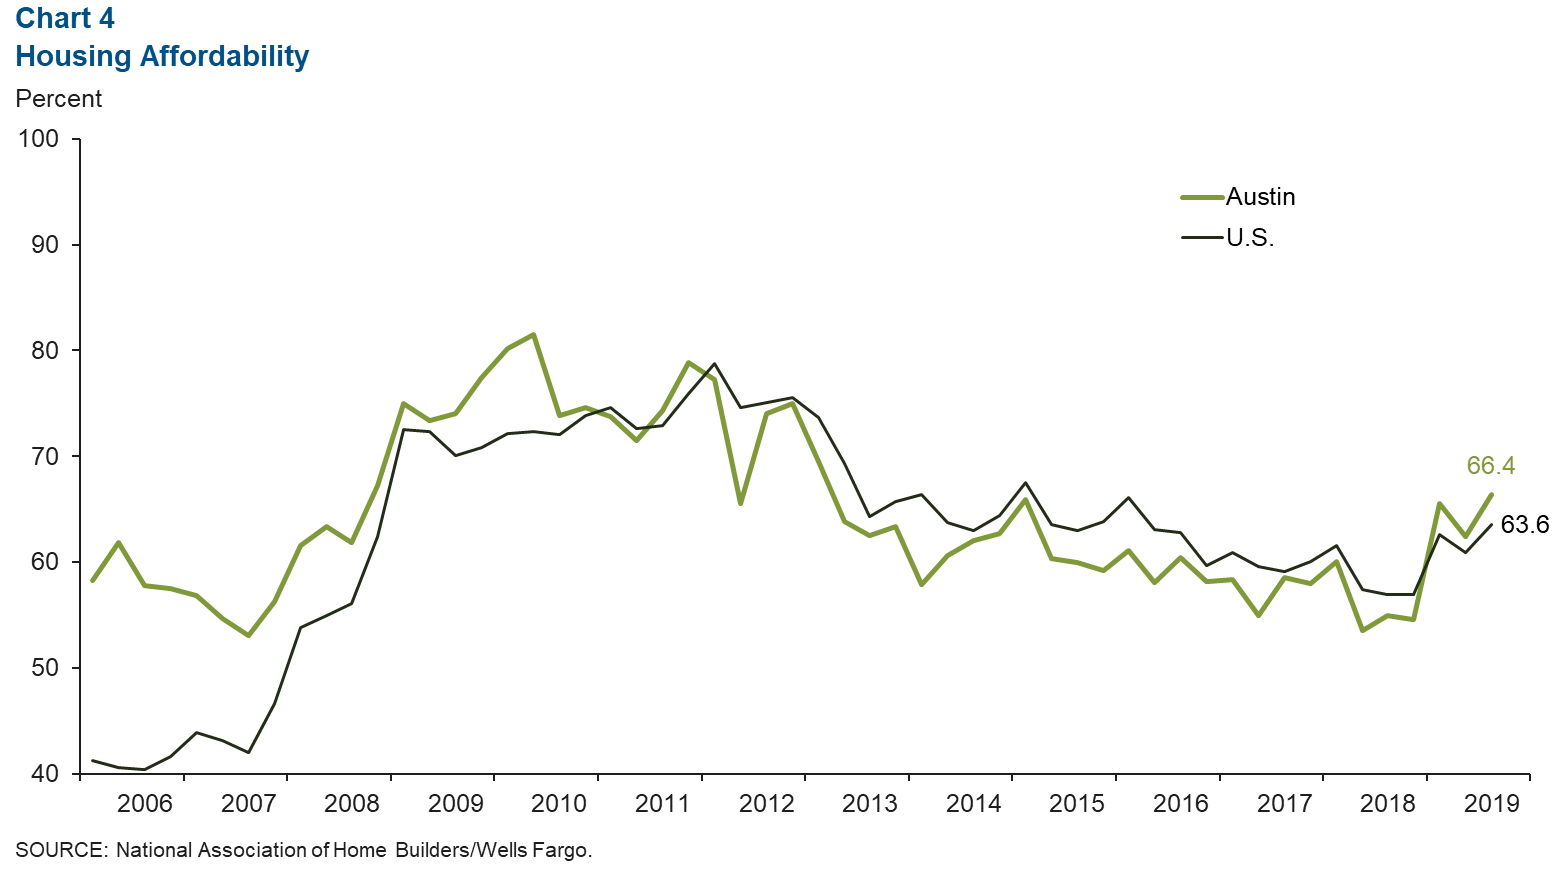
Housing affordability, defined as the percentage of homes sold that the median-income household can afford, has steadily risen at the metro and national levels since second quarter 2018 (Chart 4). Austin’s affordability index ticked up from a reading of 62.4 in second quarter 2019 to 66.4 in the third quarter. The U.S. index increased from 60.9 to 63.6 during those periods, likely due to the declining mortgage rates since October 2018.
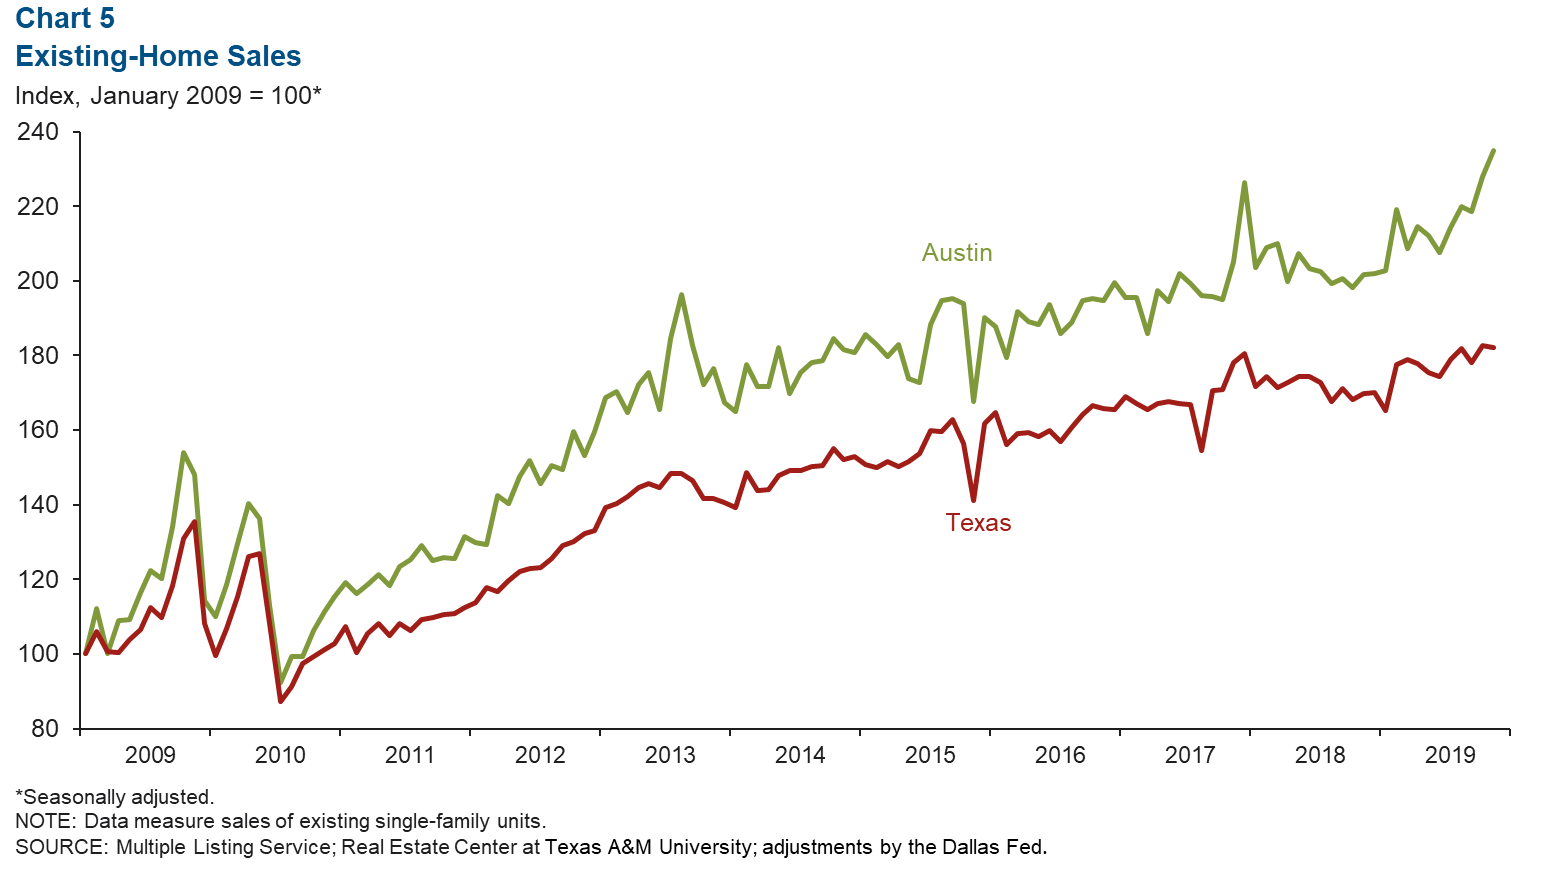
Metro Existing-Home Sales Activity Strong
Austin’s existing-home sales surged 3.1 percent month over month in November, while sales in Texas contracted 0.3 percent (Chart 5). During the first 11 months of 2019, Austin home sales declined 4.0 percent compared with the same period in 2018, and total home sales for Texas fell 6.2 percent during the same period. Austin’s home sales volume in November was 15.6 percent higher than the monthly average in 2018, while the state’s home sales volume was 6.2 percent higher.
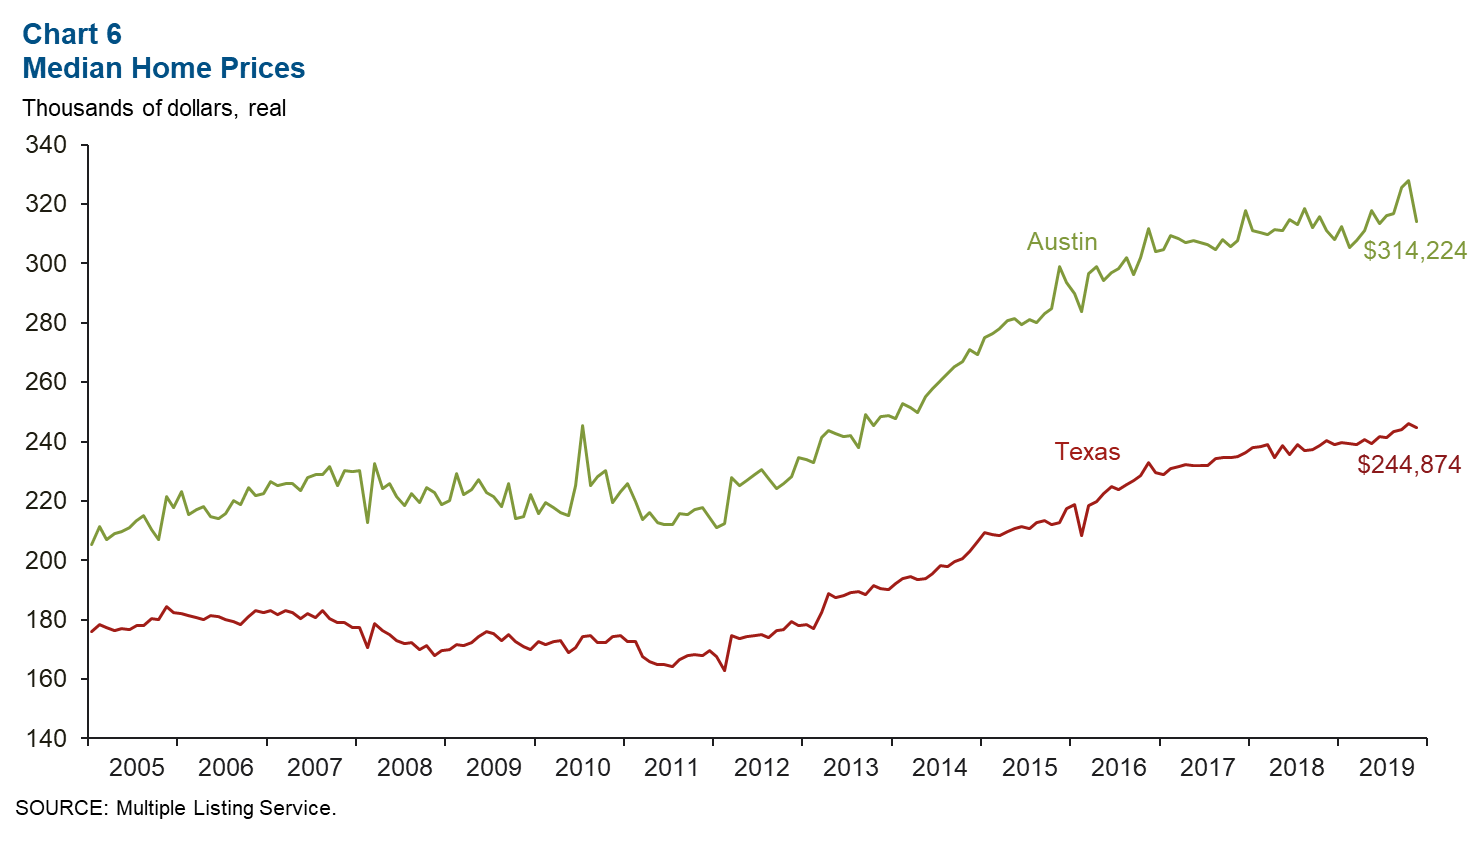
Home Prices Decline
The median home price in Austin dropped to $314,224 in November but was up 1.0 percent year over year (Chart 6). The Texas median home price ticked down to $244,874—a 1.9 percent increase year over year. Austin home inventory remained at 2.2 months, far below the six months considered a balanced market.
NOTE: Data may not match previously published numbers due to revisions.
About Austin Economic Indicators
Questions can be addressed to Judy Teng at judy.teng@dal.frb.org. Austin Economic Indicators is released on the first Thursday of every month.