Austin Economic Indicators

February 6, 2020
The Austin economy expanded at a healthy pace in December. The Austin Business-Cycle Index grew at a strong rate. Labor markets tightened further as the unemployment rate dropped in the fourth quarter and job growth accelerated. Fourth-quarter office space demand remained healthy; in December, home sales volume declined, while the average sales price climbed.
Business-Cycle Index
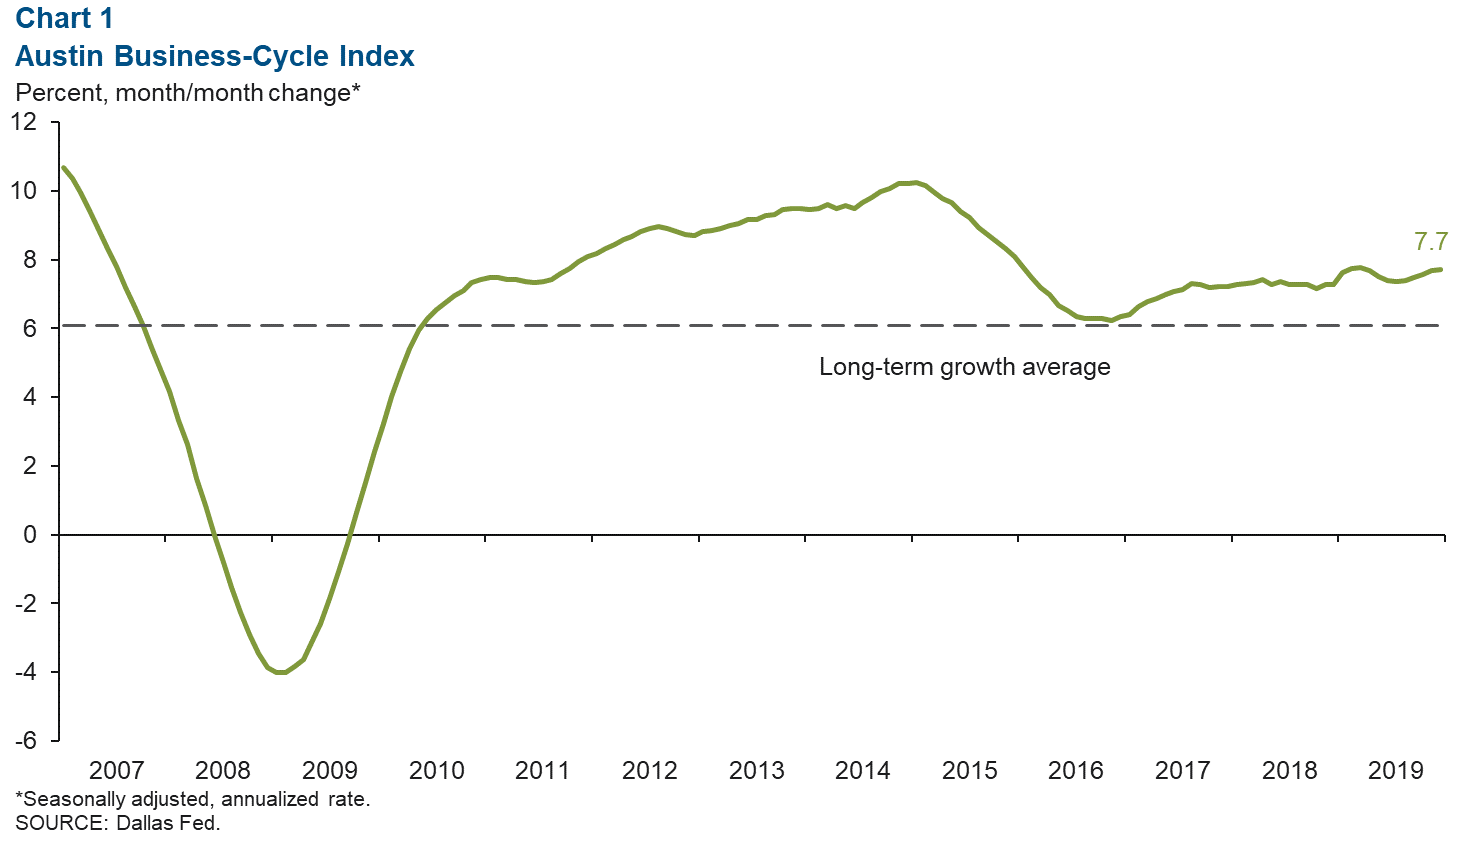
The Austin Business-Cycle Index expanded 7.7 percent in December, well above its long-term average of 6.3 percent (Chart 1). Recent strength in the index is due to robust job growth and lower unemployment rates, indicating healthy economic performance in the metro.
Labor Market
Unemployment Rate Declines
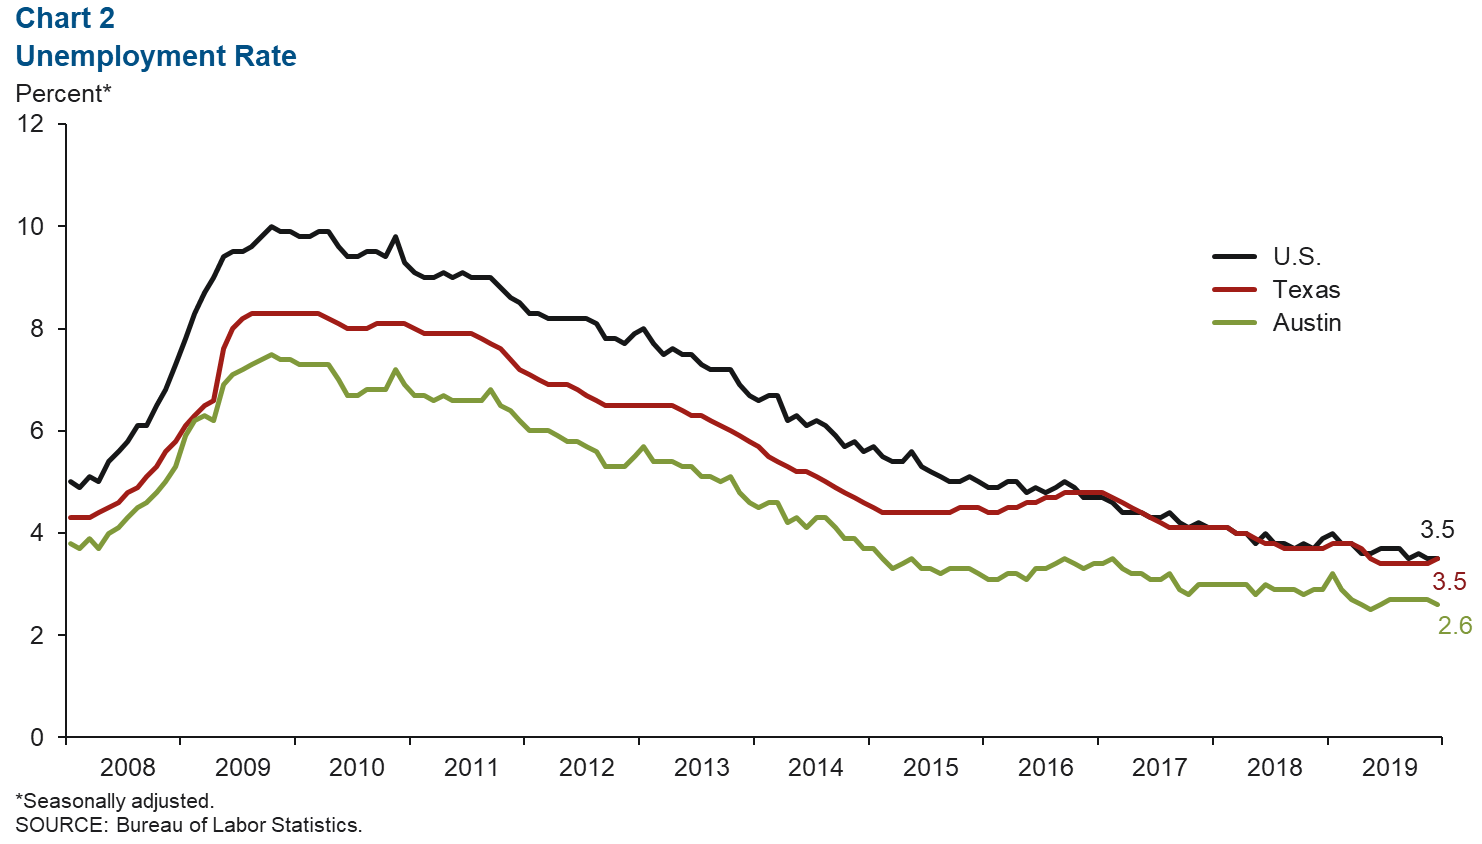
Austin’s unemployment rate dropped to 2.6 percent in December after lingering at 2.7 percent for five consecutive months (Chart 2). The unemployment rate for the state ticked up to 3.5 percent, while the jobless rate for the U.S. remained at 3.5 percent. The labor market remained tight in Austin in 2019 as labor force growth expanded 2.4 percent, a slowdown compared with 2017 (3.6 percent) and 2018 (2.7 percent).
Job Growth Brisk in Fourth Quarter
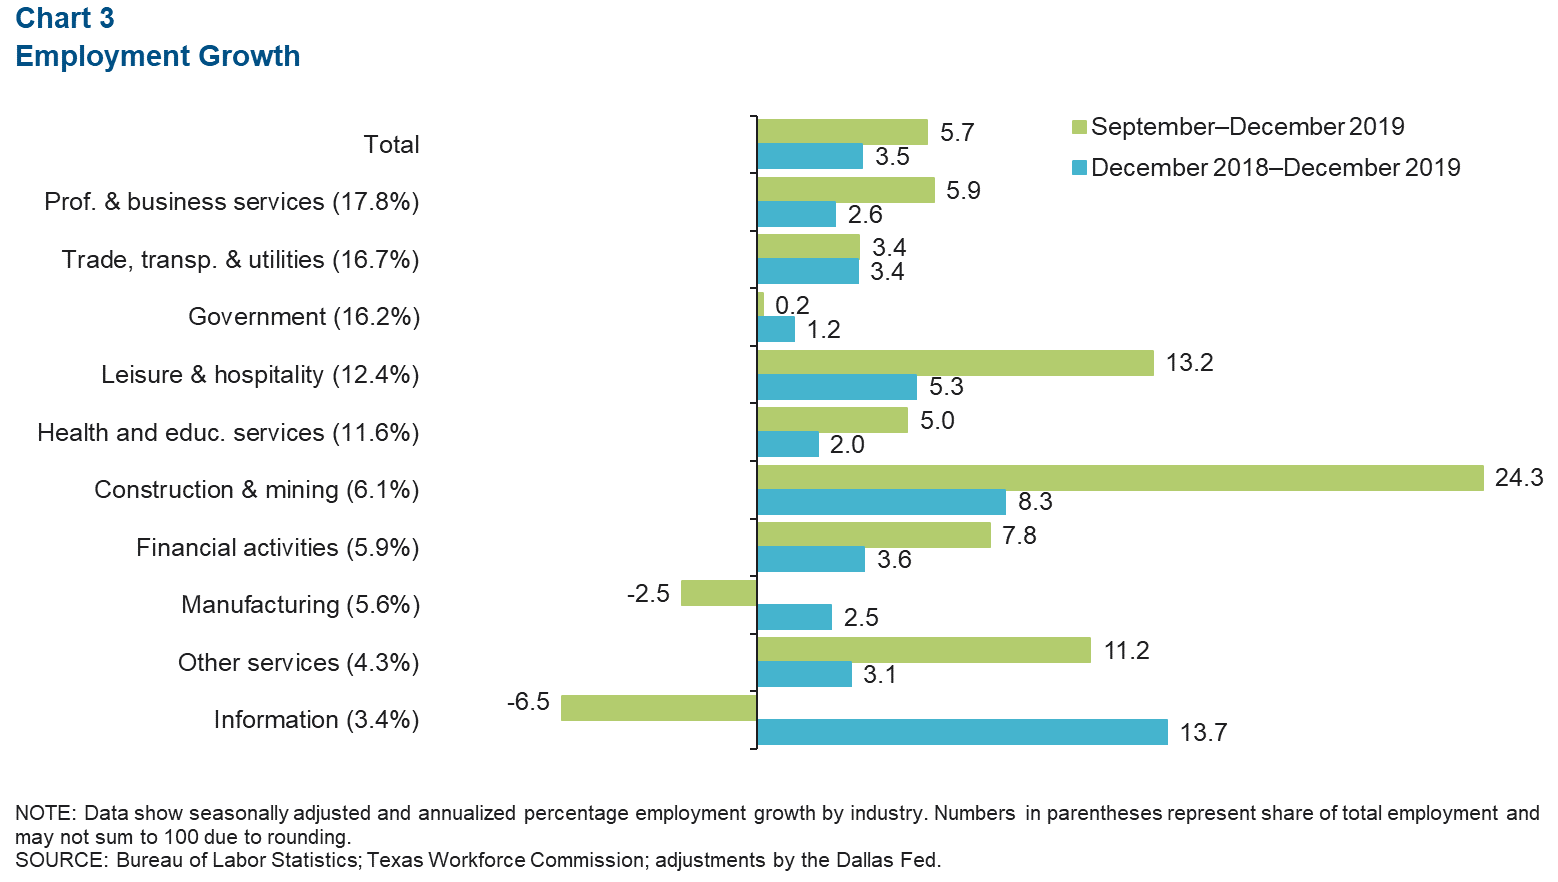
Austin added jobs at a brisk pace of 5.7 percent, or a net 15,500 jobs, in fourth quarter 2019 (Chart 3). Expansion by industry was led by the construction sector, which added 3,700 net jobs (24.3 percent). Other industries that saw healthy growth were leisure and hospitality (13.2 percent, or 4,200 jobs), other services (11.2 percent, or 1,300 jobs), financial activities (7.8 percent, or 1,230 jobs) and professional and business services (5.9 percent, or 2,850 jobs). Sectors that saw job losses during this period were information (-650 jobs) and manufacturing (-400 jobs). For the year, job growth was a strong 3.5 percent and was positive across all broad industry groups.
Real Estate
Office Space Demand Healthy
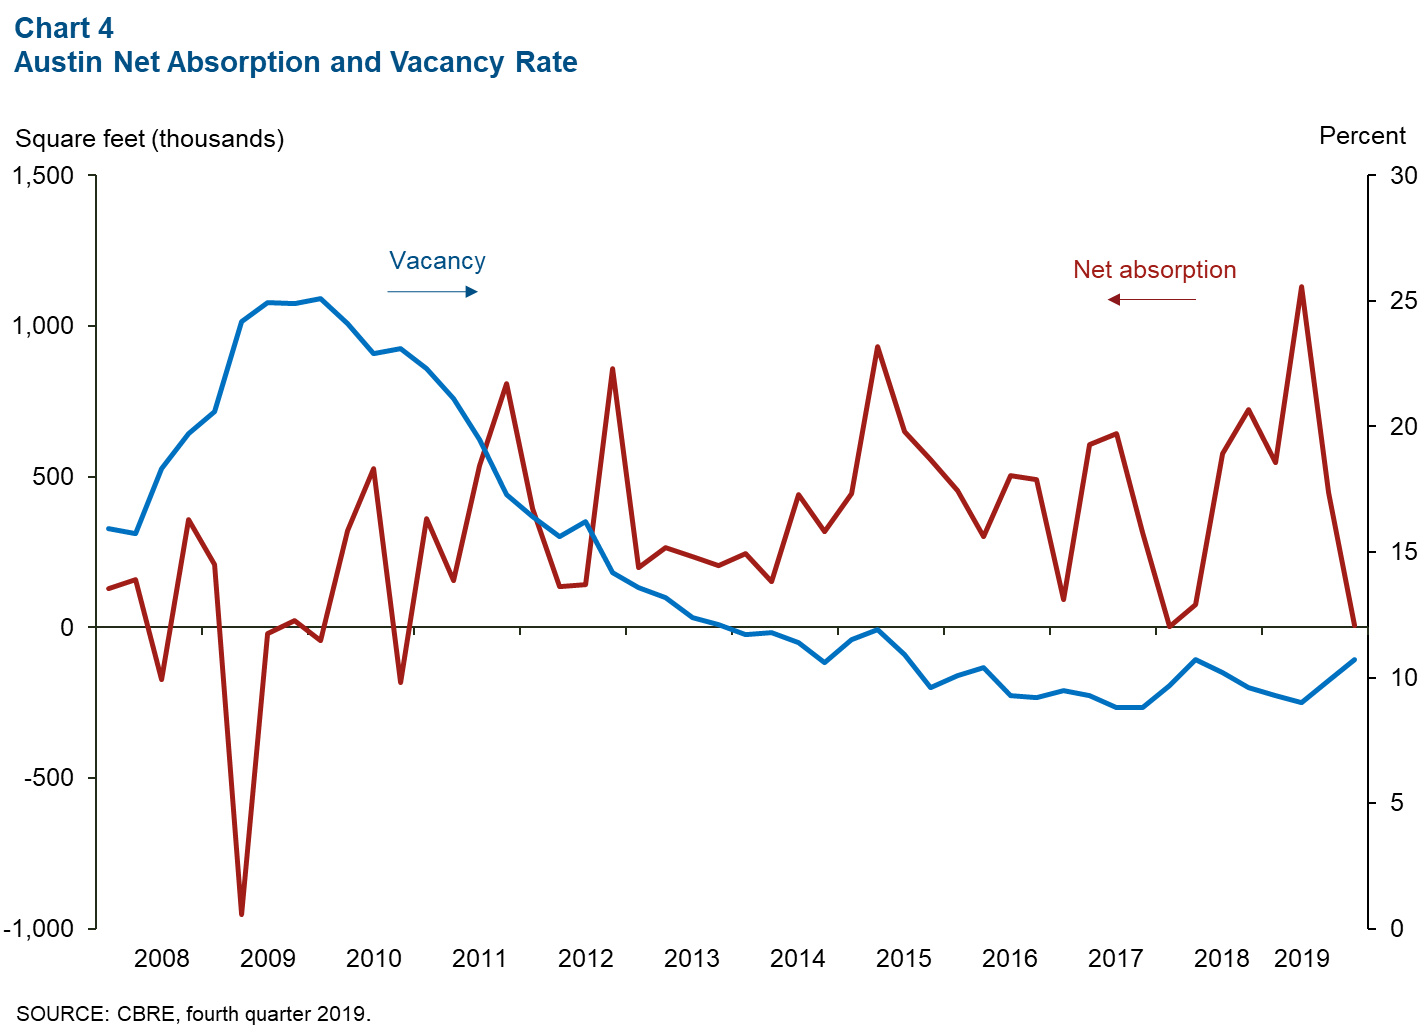
Demand for office space remained healthy in Austin in the fourth quarter, although activity slowed somewhat. Net absorption was 7,147 square feet, and the vacancy rate climbed to 10.7 percent—the highest since second quarter 2018, although still the lowest of all major Texas metros (Chart 4). Average asking rent was unchanged from the third quarter but increased 6.1 percent year over year.
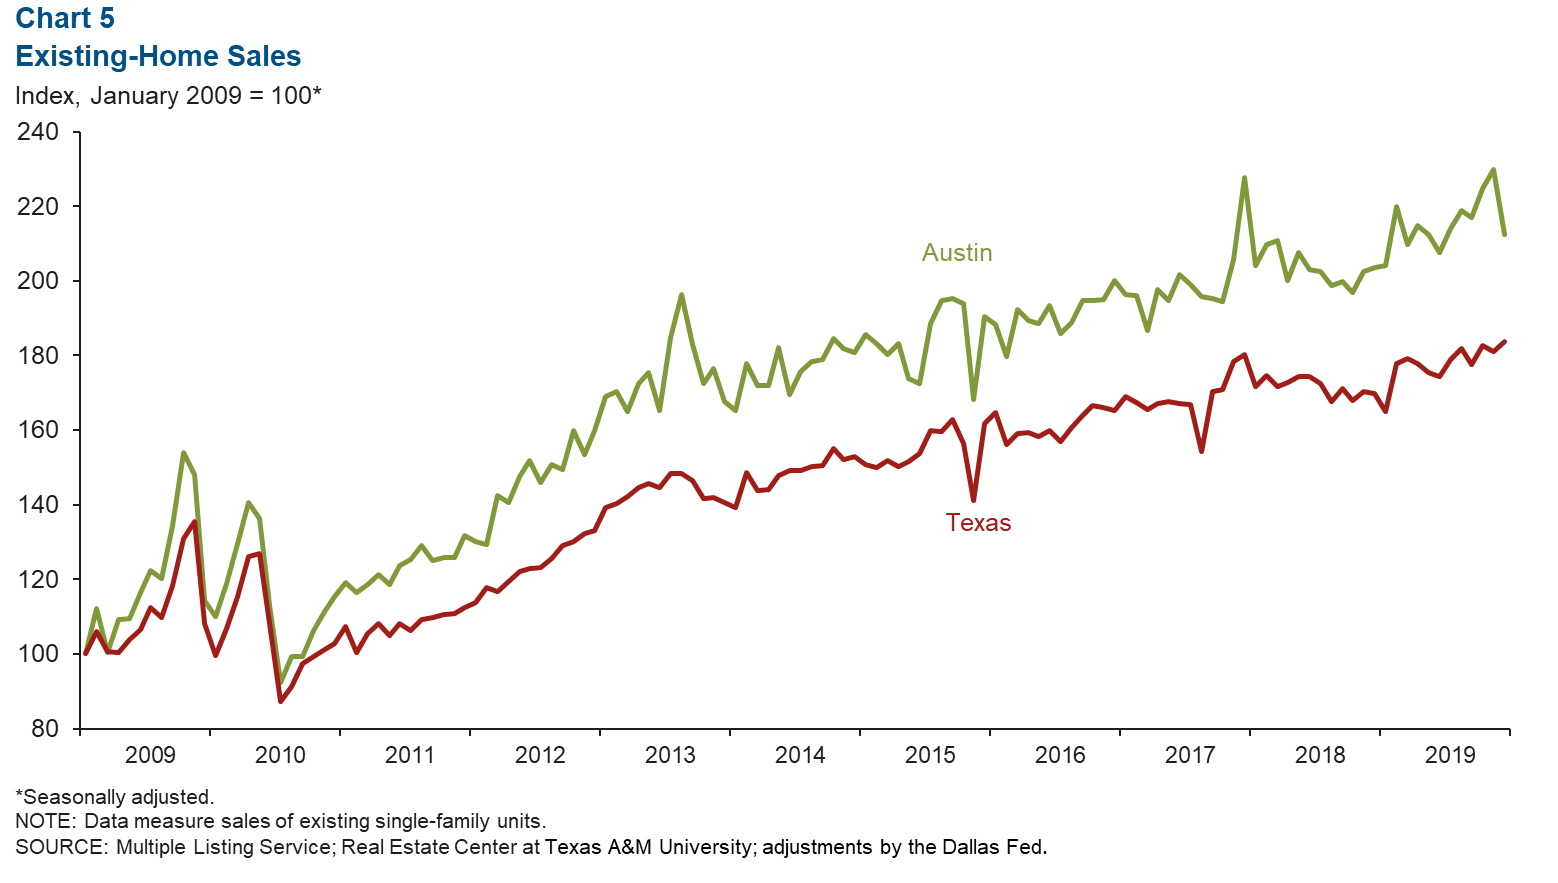
2019 Metro Existing-Home Sales Activity Strong
Austin existing-home sales fell 7.6 percent in December, while sales rose 1.5 percent in Texas (Chart 5). In 2019, Austin home sales increased 6.0 percent relative to 2018, well above Texas’ growth of 3.7 percent. Austin home inventory was 2.1 months, the lowest since March 2015 and well below the six months considered to be a balanced market.
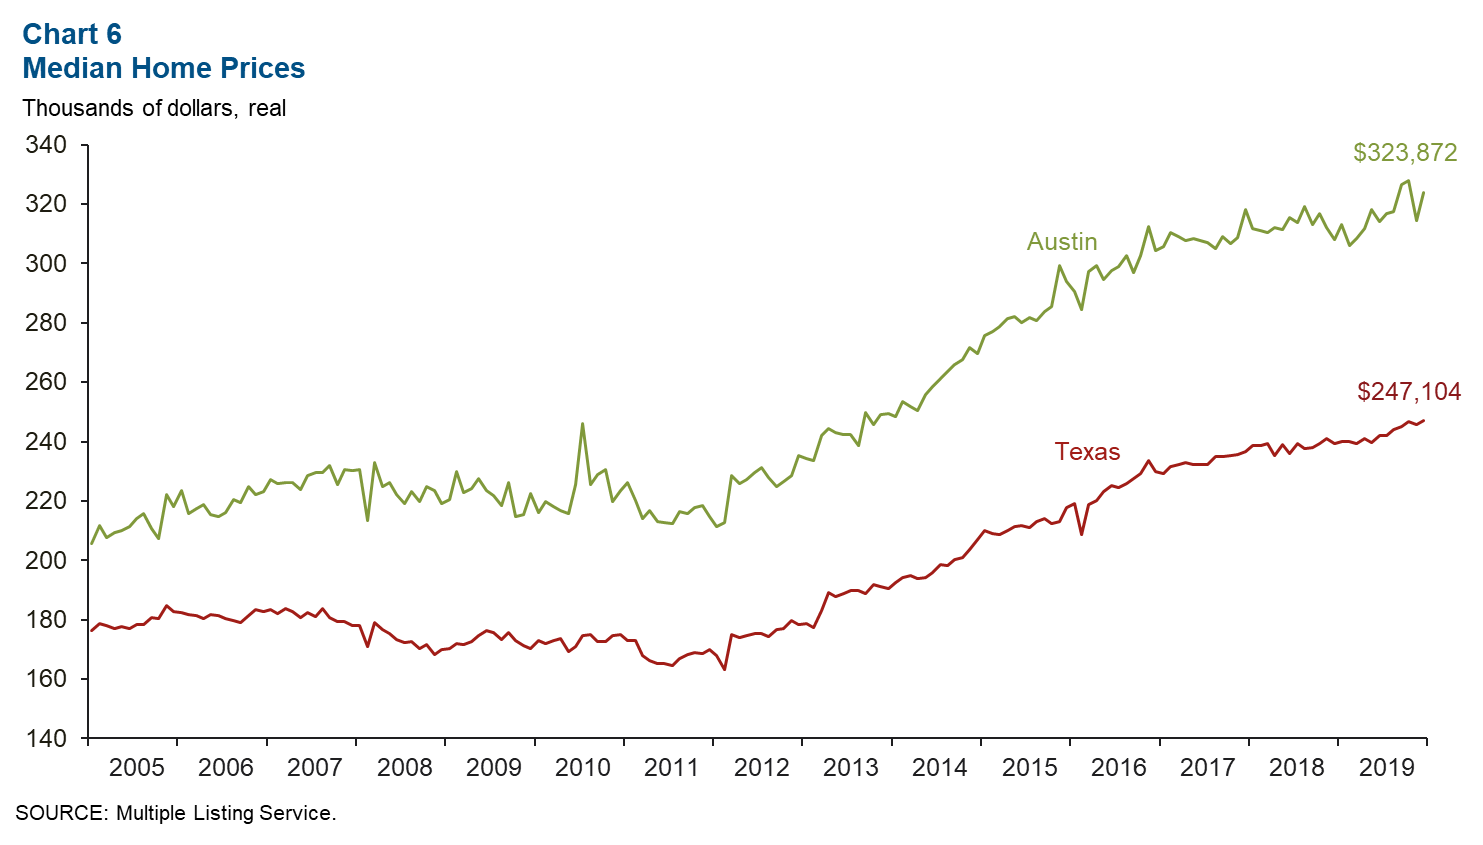
Metro Home Sales Prices Rise
The median price of homes sold in Austin climbed to $323,872 in December, up 5.1 percent year over year (Chart 6). The median home sales price for Texas ticked up to $247,104, a 3.2 percent increase year over year. As of third quarter 2019, housing affordability, defined as the percentage of homes that the median income household can afford, was 66.4 percent.
NOTE: Data may not match previously published numbers due to revisions.
About Austin Economic Indicators
Questions can be addressed to Judy Teng at judy.teng@dal.frb.org. Austin Economic Indicators is released on the first Thursday of every month.