Austin Economic Indicators

Aug. 6, 2020
The Austin economy showed signs of improvement in June following the impact of COVID-19. The Austin Business-Cycle Index surged. While employment and the unemployment rate improved in June from May, both remain significantly below their February levels. Consumer spending has improved considerably since mid-April in Travis County. While existing-home sales increased sharply in June, building permits declined.
Business-Cycle Index
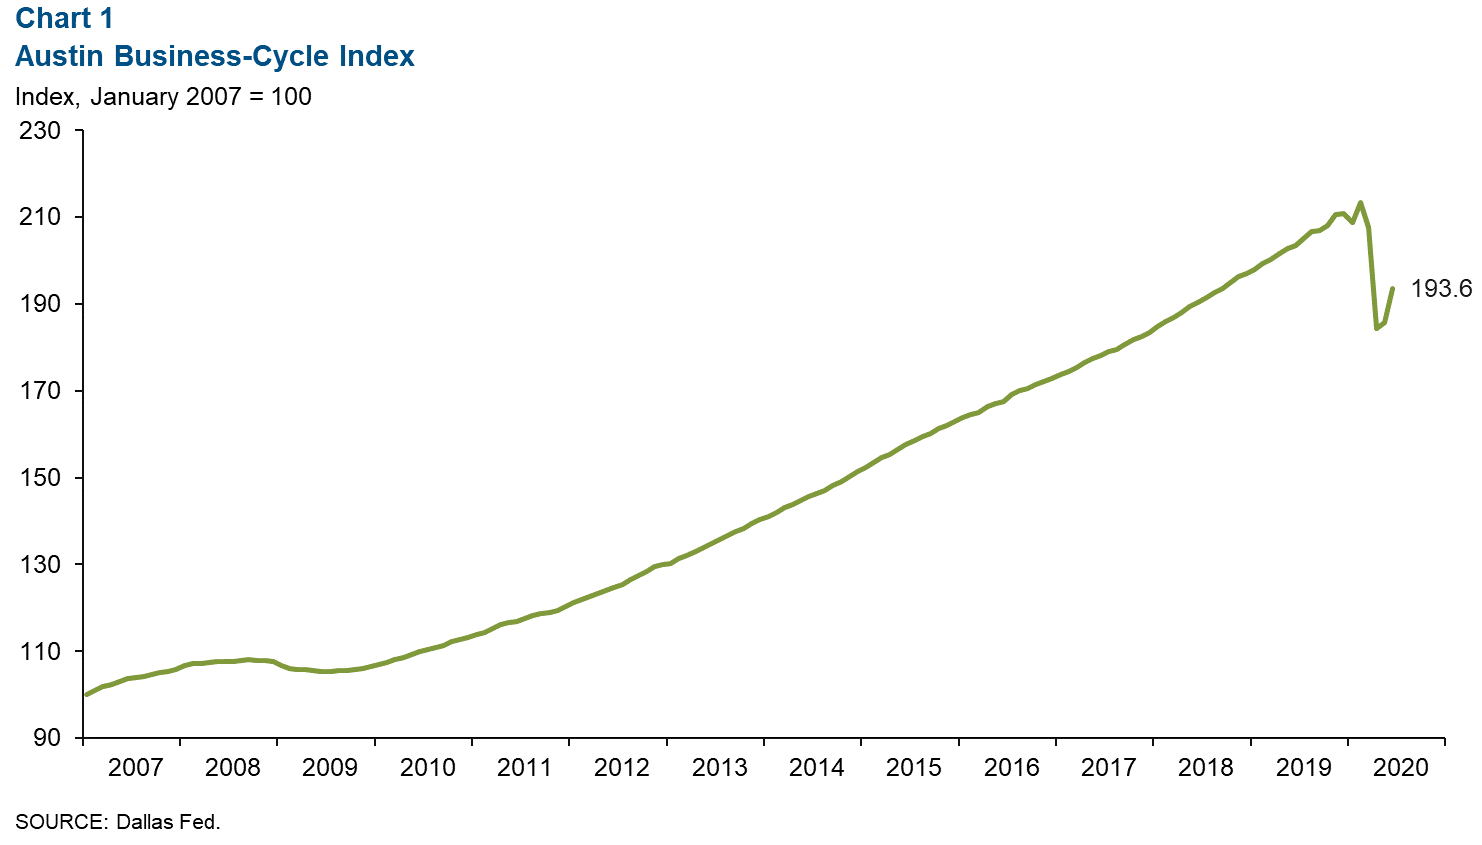
The Austin Business-Cycle Index—a broad measure of economic activity in the metro—expanded an annualized 65.1 percent in June, suggesting an improvement in economic performance (Chart 1).
Labor Market
Unemployment Rate Declines Further
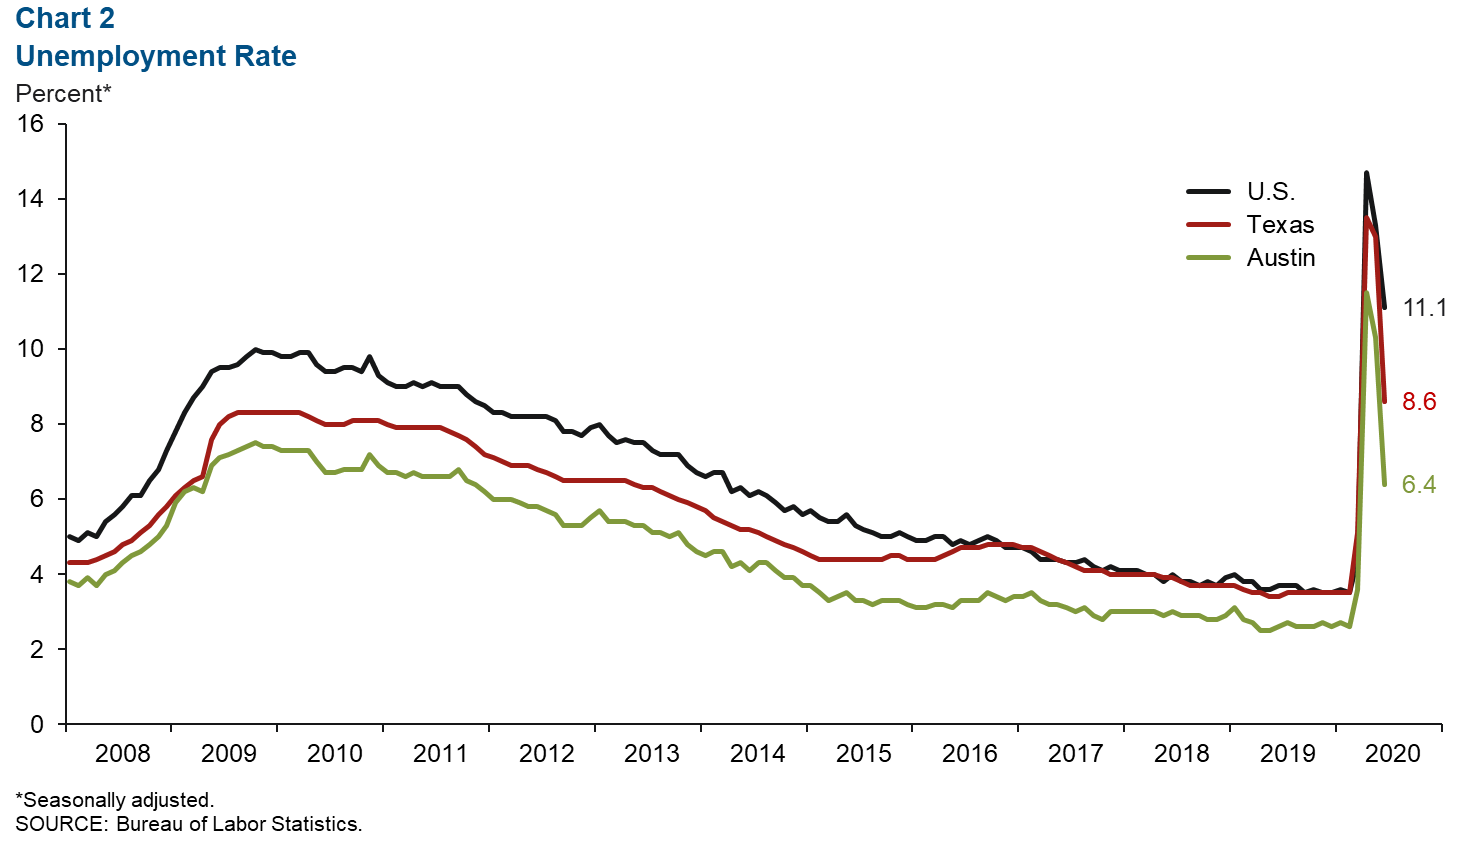
Austin’s unemployment rate fell to a still-elevated 6.4 percent in June (Chart 2). The jobless rate ticked down to 8.6 percent in the state and 11.1 percent in the nation.
Most Sectors Post Job Losses
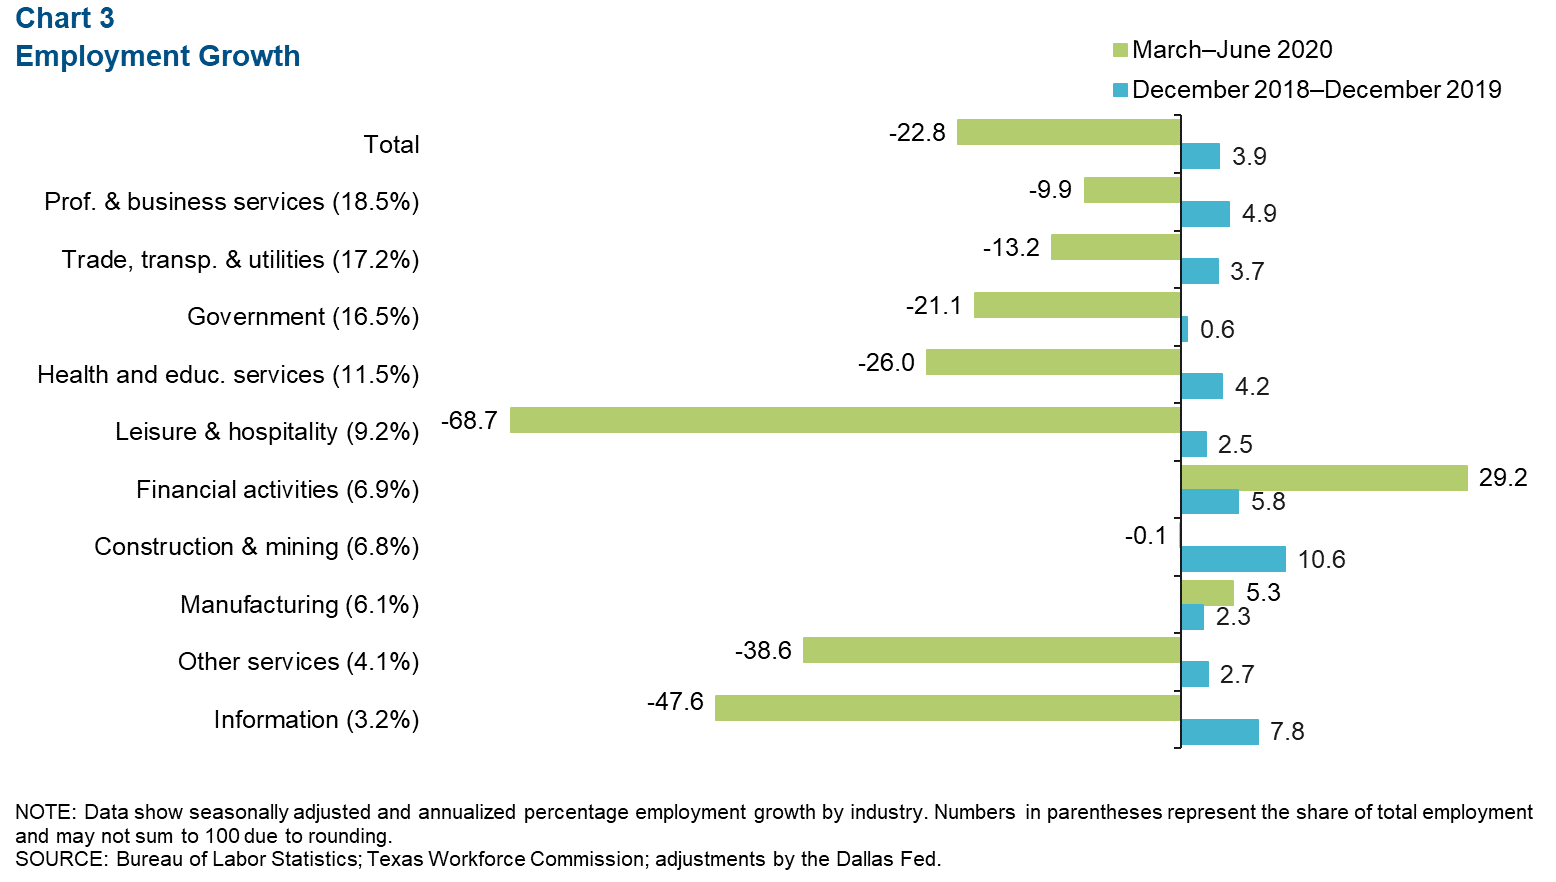
Austin payrolls contracted an annualized 22.8 percent (-71,020 net jobs, nonannualized) in the three months ending in June (Chart 3). All sectors other than manufacturing and financial activities shed jobs during this period. Leisure and hospitality plunged 68.7 percent, losing the most jobs (-32,820). It was followed by information, which contracted 47.6 percent (-5,950). Other services, such as automotive repair and barber shops, declined 38.6 percent (-5,600), health and private education services fell 26.0 percent (-9,560), and the government sector contracted 21.1 percent (-10,700). The financial activities industry saw a 29.2 percent gain, adding 4,600 jobs, and employment in the manufacturing sector grew 5.3 percent (840).
Consumer Spending
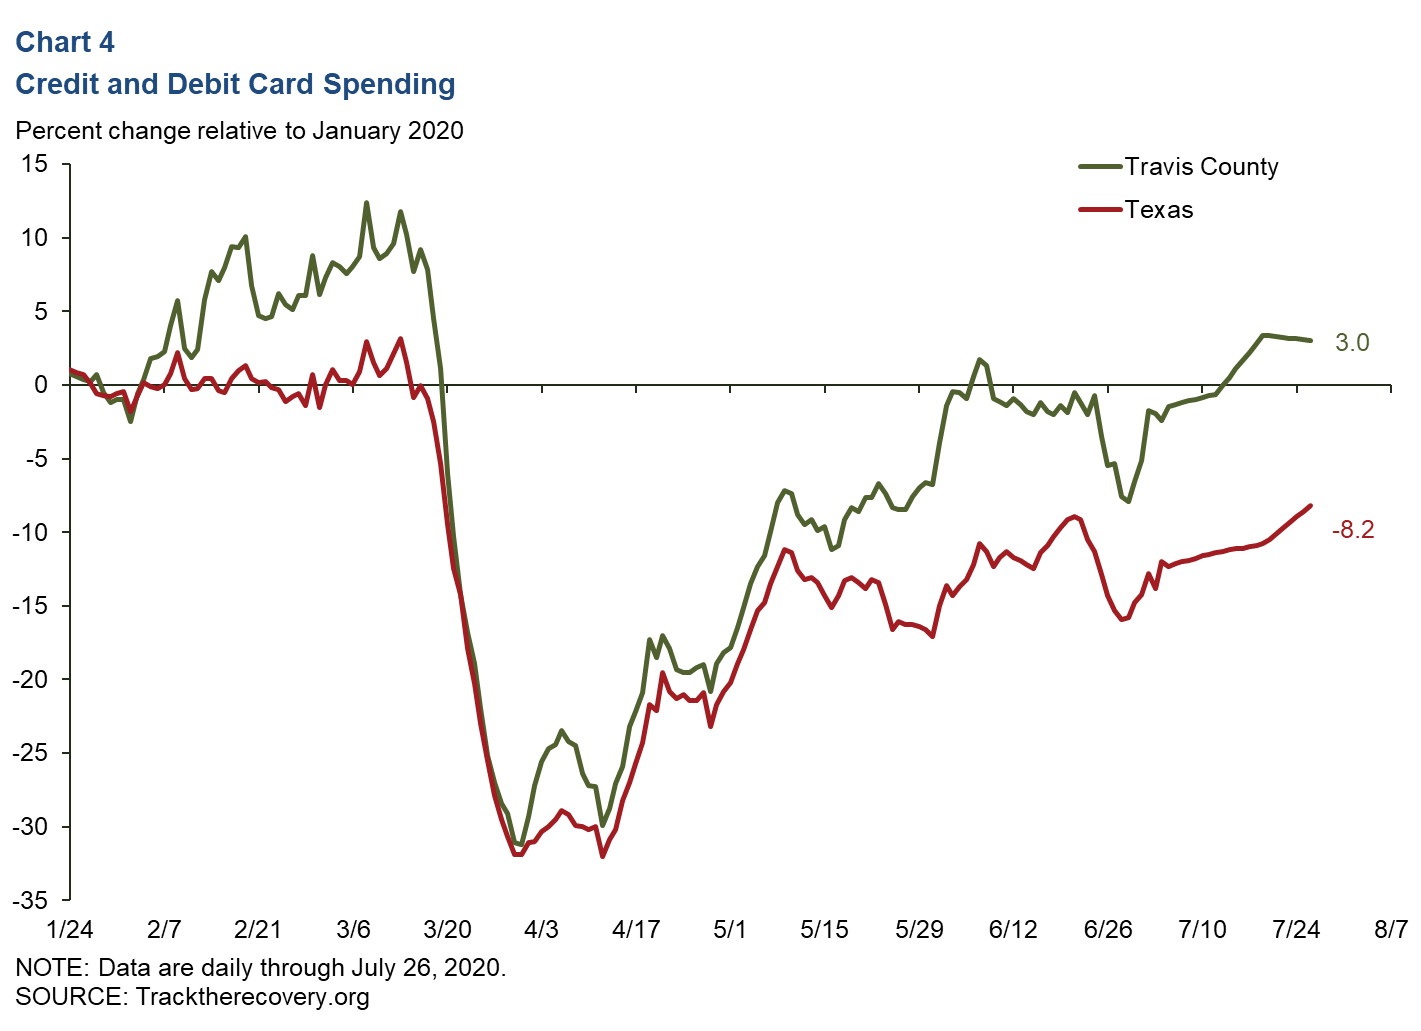
Consumer spending (measured by credit and debit card spending) in Travis County has improved significantly since early April. As of July 26, spending in the county was up 3.0 percent relative to January 2020, whereas spending in Texas was down 8.2 percent over the same period (Chart 4).
Real Estate
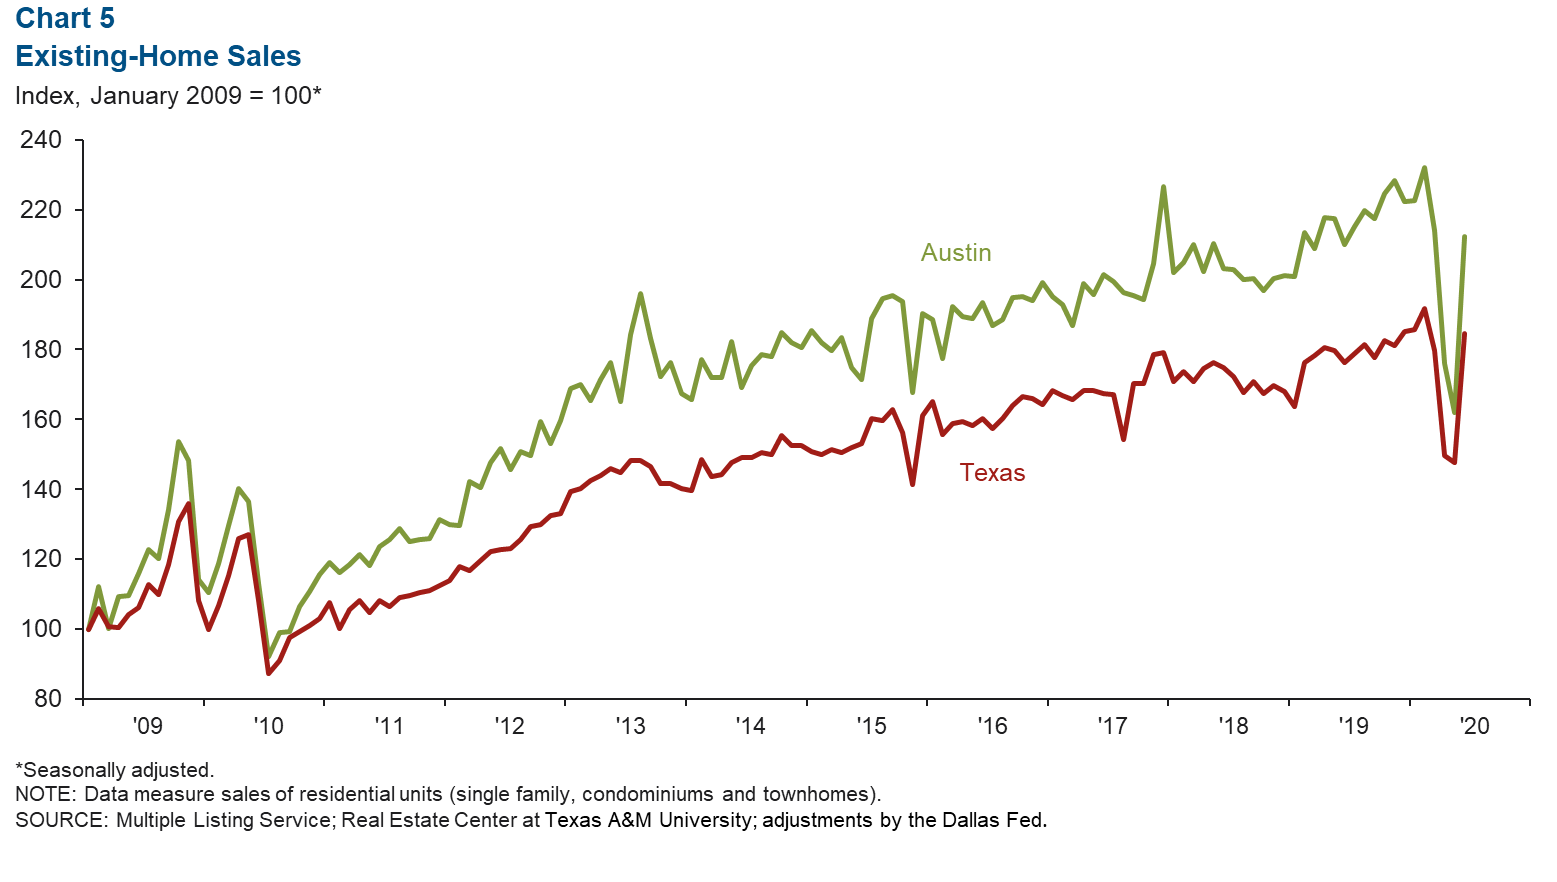
Home Sales Surge
Existing-home sales in June climbed 31.1 percent in Austin and 25 percent in Texas (Chart 5). Nonetheless, the metro’s home sales were down 3.9 percent during the first half of the year relative to the same period in 2019 due to COVID-19-related containment measures, while Texas sales were down 1.5 percent. The median price of homes sold in June was $324,208 in the metro, a 3.9 percent gain year over year, compared with $248,852 in Texas, a 3.4 percent increase.
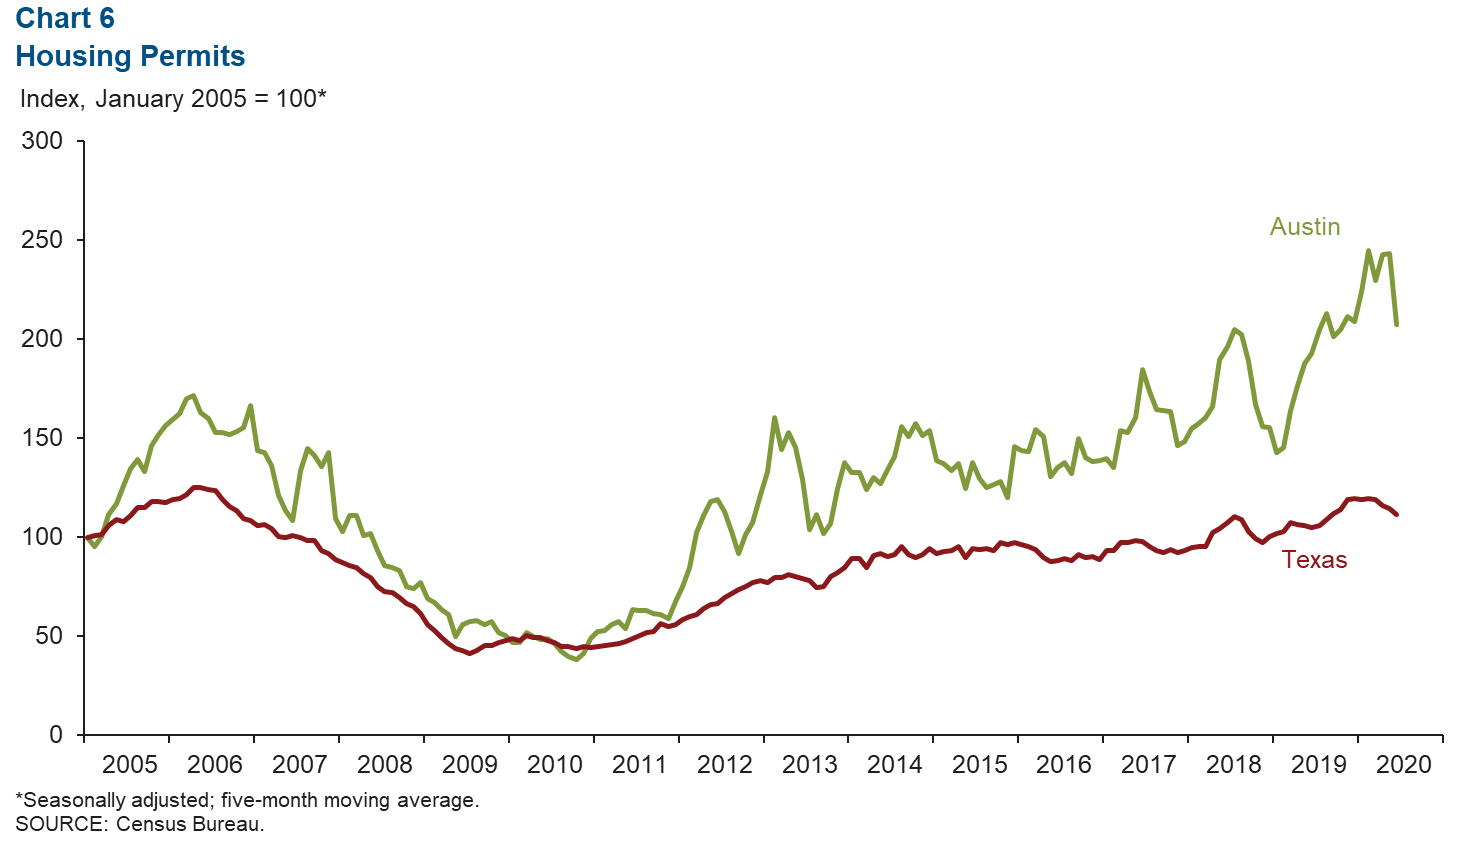
Home Construction Permits Fall
The five-month moving average of total housing (single-family and multifamily) permits in Austin contracted 14.7 percent from May to June and was down 2.4 percent in the state (Chart 6). Austin’s existing-home inventories ticked down to 1.6 months, remaining well below the six months of supply considered to be a balanced market.
NOTE: Data may not match previously published numbers due to revisions.
About Austin Economic Indicators
Questions can be addressed to Judy Teng at judy.teng@dal.frb.org. Austin Economic Indicators is released on the first Thursday of every month.