Austin Economic Indicators

August 4, 2021
The Austin economy continued to post a strong performance in June. The Austin Business-Cycle Index accelerated, led by declines in the unemployment rate and recent broad-based job gains. COVID-19 hospitalizations increased markedly since early July. Existing-home sales decelerated in June amid historically tight inventories, and regional consumer spending remained healthy.
Business-Cycle Index
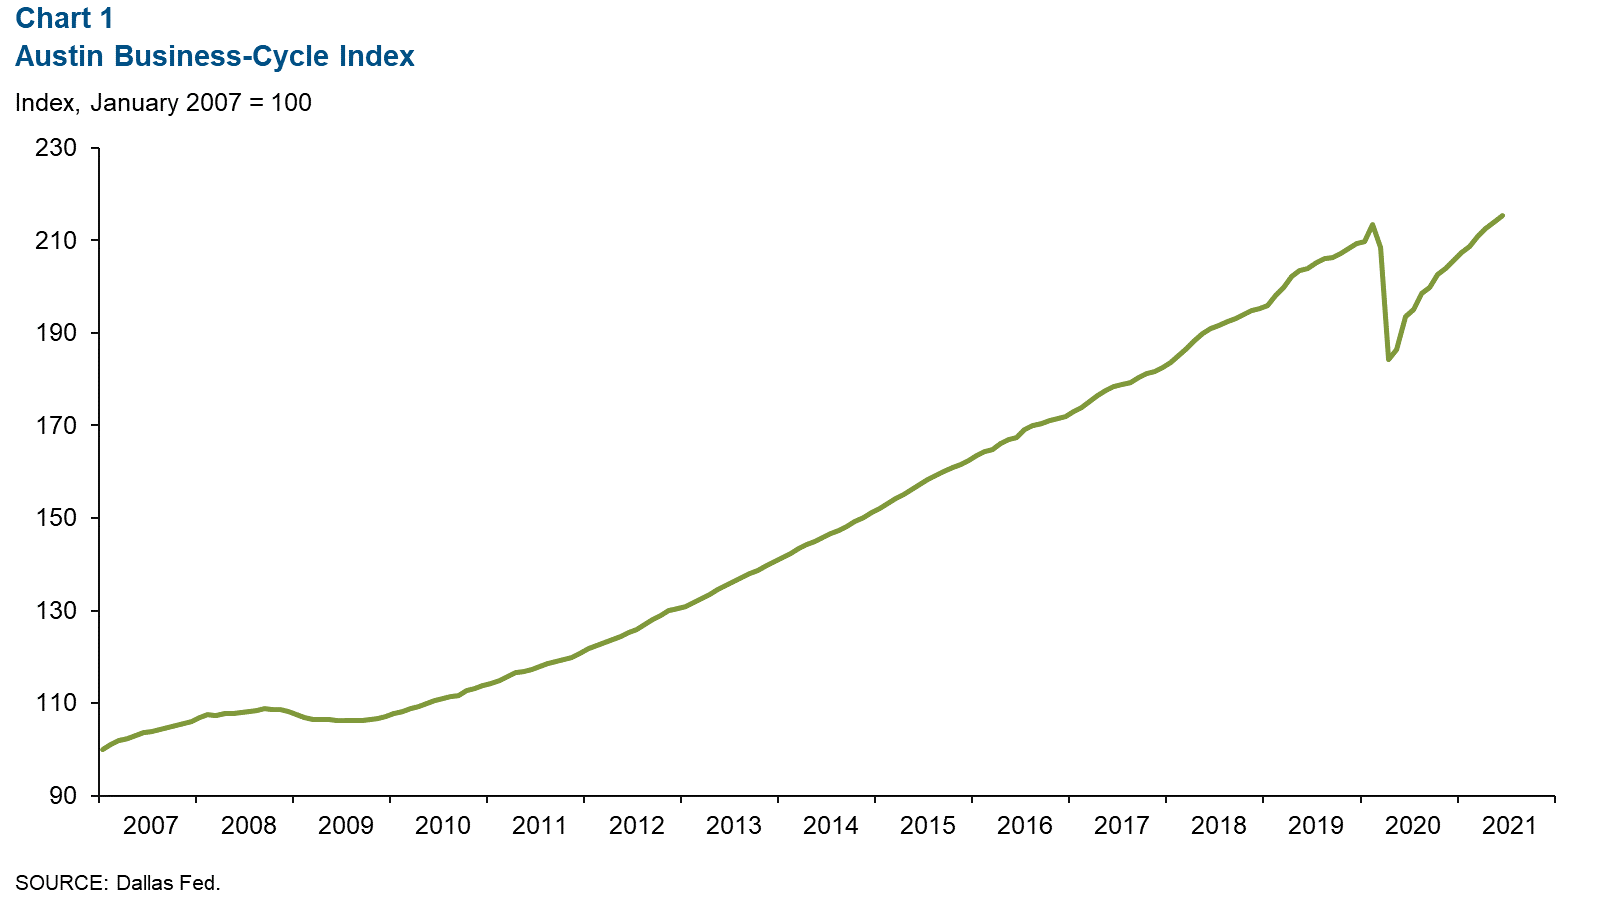
The Austin Business-Cycle Index—a broad measure of economic activity—accelerated an annualized 9.9 percent in June after growing 6.7 percent in May. Recent strength in the economy can be attributed to job gains and unemployment rate declines. June marked the 14th consecutive month of growth in the index, which suggests continued strength in the Austin economy (Chart 1).
Labor Market
Unemployment Rate Declines
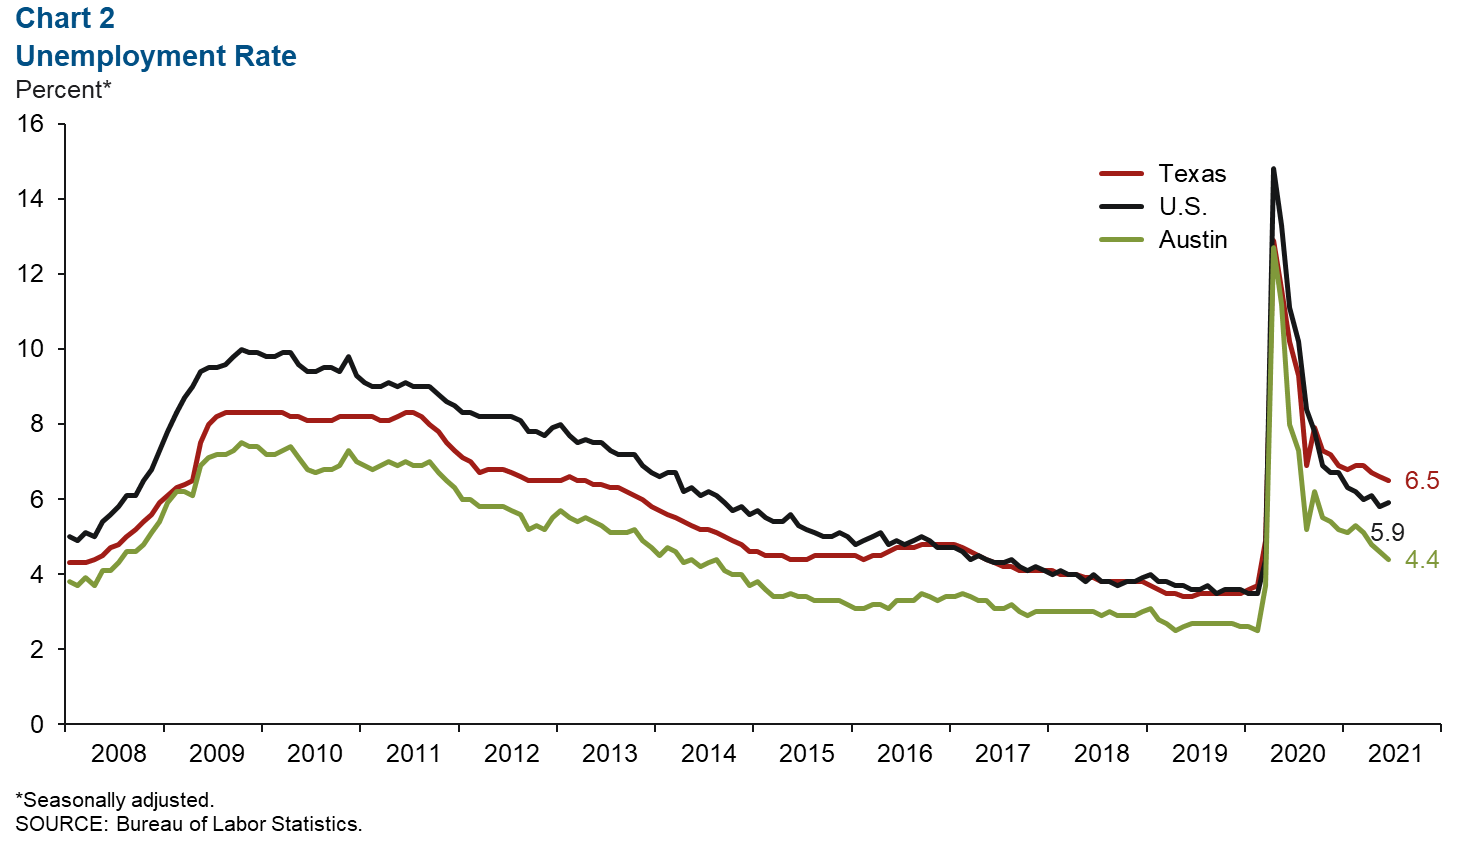
Austin’s unemployment rate continued to fall in June to 4.4 percent, the lowest level since March 2020 (Chart 2). This is well below the state’s jobless rate of 6.5 percent and the nation’s 5.9 percent rate. In the second quarter, the metro’s labor force expanded an annualized 2.6 percent—above the state’s 1.1 percent.
Second-Quarter Job Growth Positive in Most Sectors
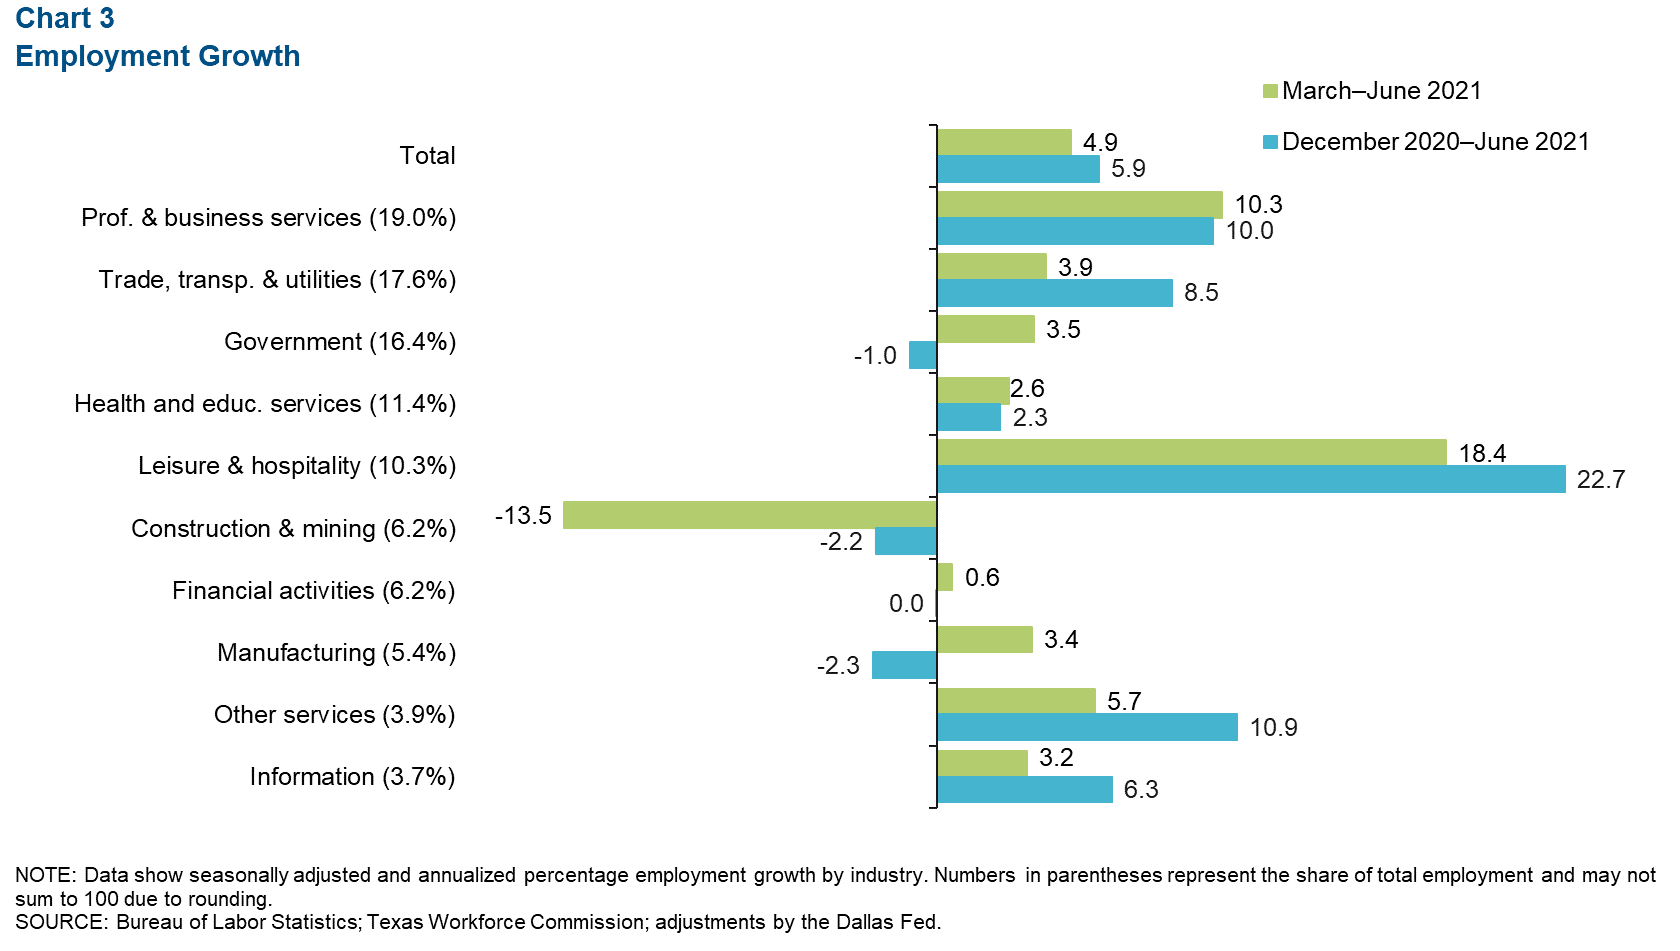
Austin payrolls expanded an annualized 4.9 percent, or 13,390 net jobs, in the second quarter (Chart 3). Leisure and hospitality led job growth (18.4 percent, or 4,865 jobs), followed by professional and business services (10.3 percent, or 5,225 jobs), other services (5.7 percent, or 605 jobs), and trade transportation and utilities (3.9 percent, or 1,920 jobs). The only sector that posted net job losses was construction and mining (-13.5 percent, or 2,610 jobs). As of June, 95.2 percent of the 133,211 jobs lost at the onset of the pandemic in March and April 2020 had been recovered.
Consumer Spending
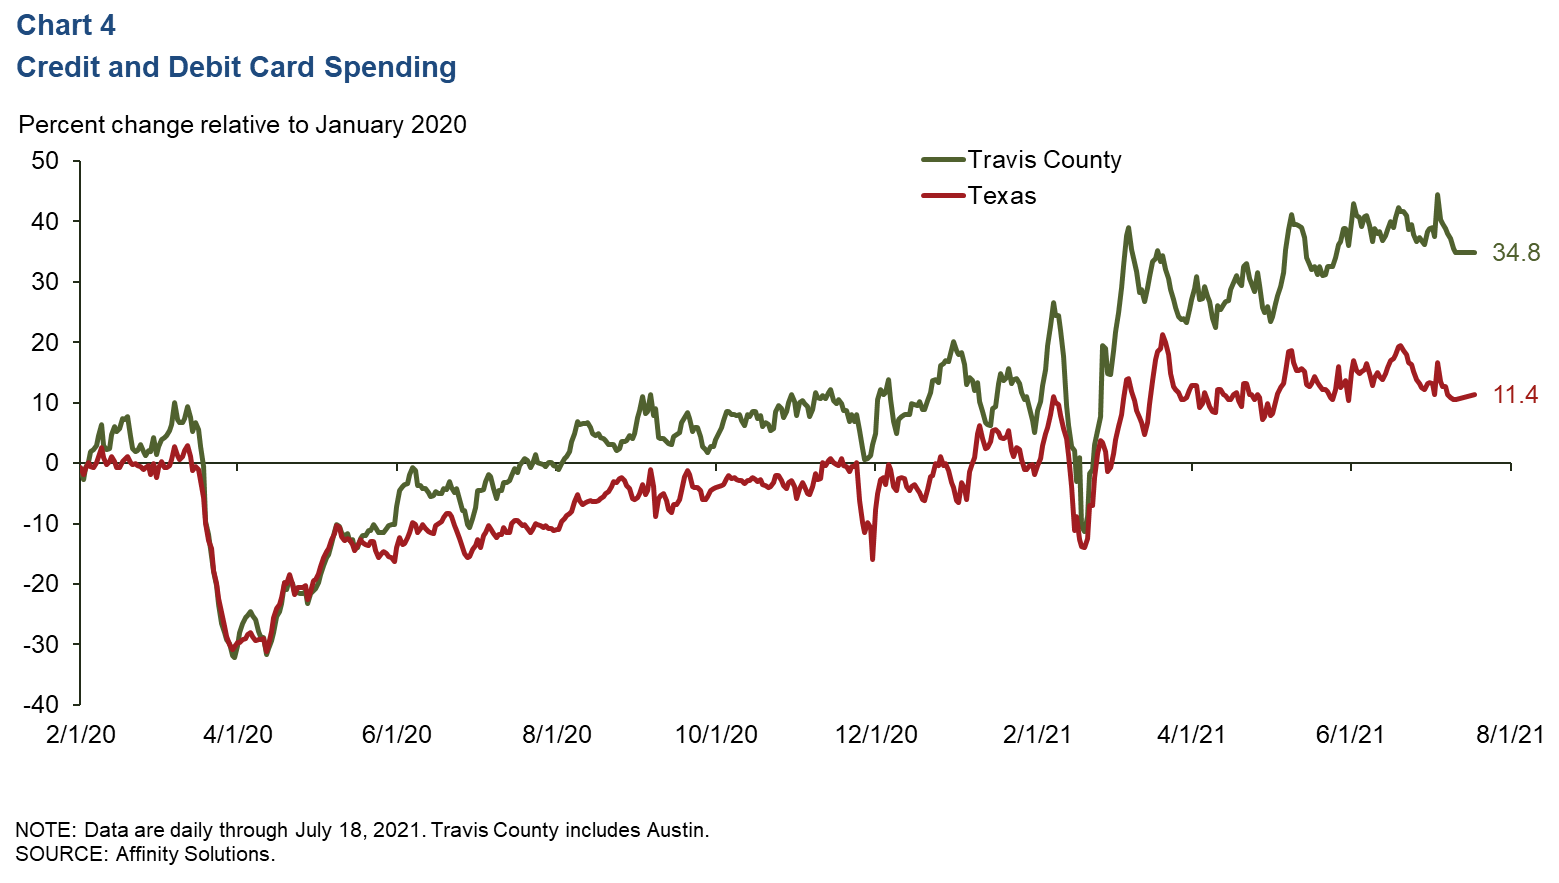
Consumer spending in Austin has been strong in recent months. In the metro’s most-populous county, Travis, credit and debit card spending has consistently surpassed January 2020 levels since last July, except for a dip in late November 2020 and during Winter Storm Uri in mid-February this year. As of July 18, 2021, spending in the county was up a robust 34.8 percent relative to January 2020, while spending in Texas was up 11.4 percent (Chart 4).
COVID-19 Statistics
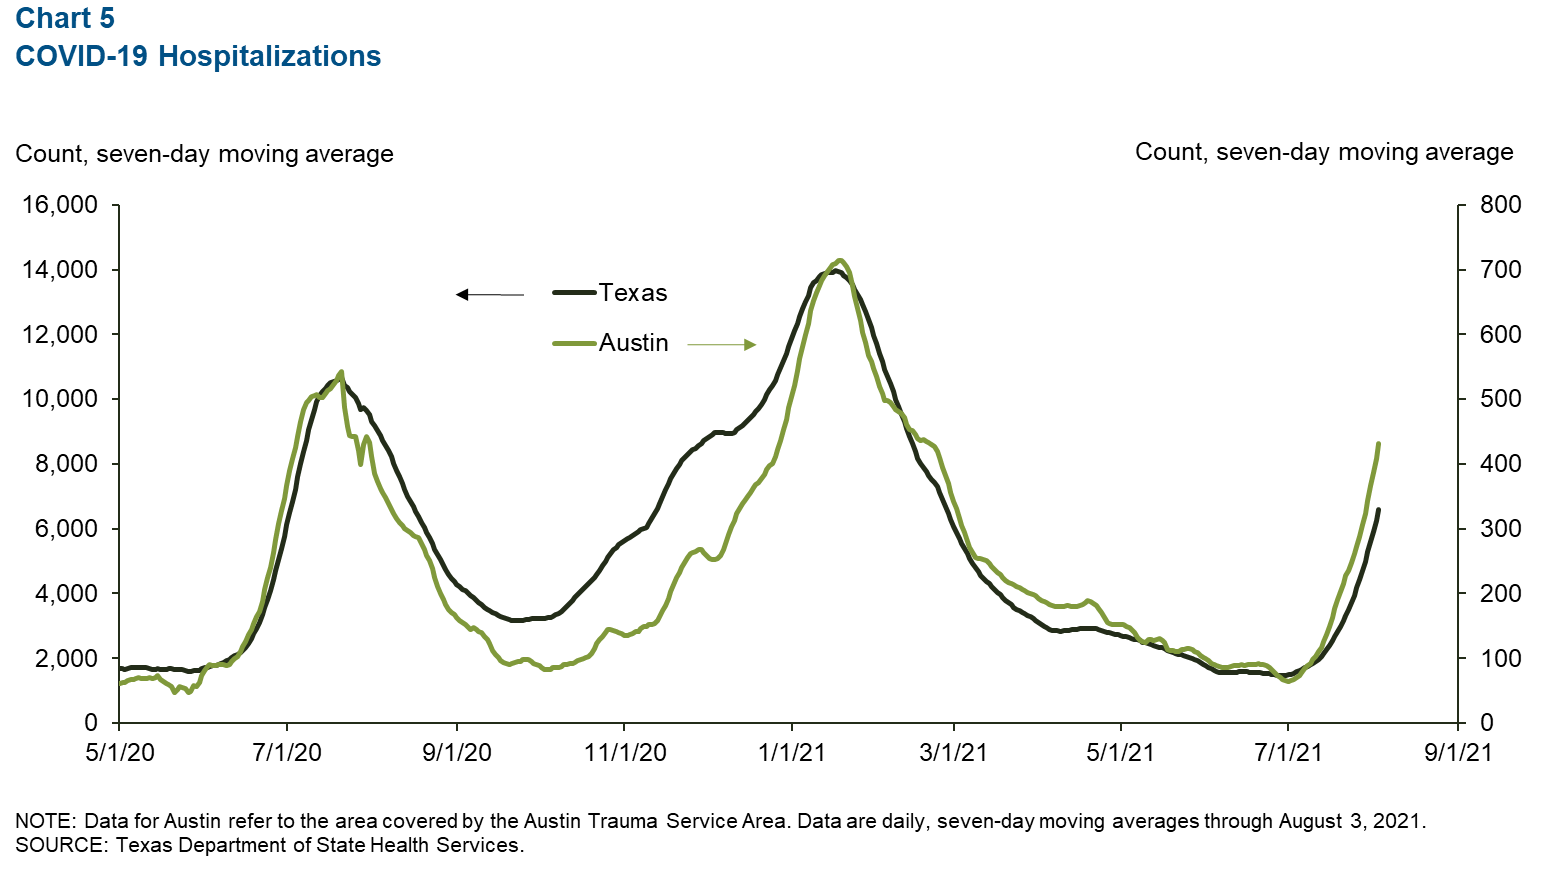
The number of people currently hospitalized with COVID-19 in Austin has risen sharply since early July, likely due to the spread of the Delta variant (Chart 5). As of Aug. 3, there were 431 people hospitalized in Austin, the highest since late February of this year. In the state, 6,600 people were hospitalized, also the highest level since late February.
Real Estate
Existing-home sales in Austin increased a tepid 0.2 percent in June after a moderate 2.2 percent rise in May (Chart 6). This compares with a 1.8 percent decrease in the state in June and a 1.5 percent increase in May. Nonetheless, in the first half of the year, metro home sales were up 16.5 percent relative to the same period in 2020. At the state level, sales were up 18.0 percent for that period.
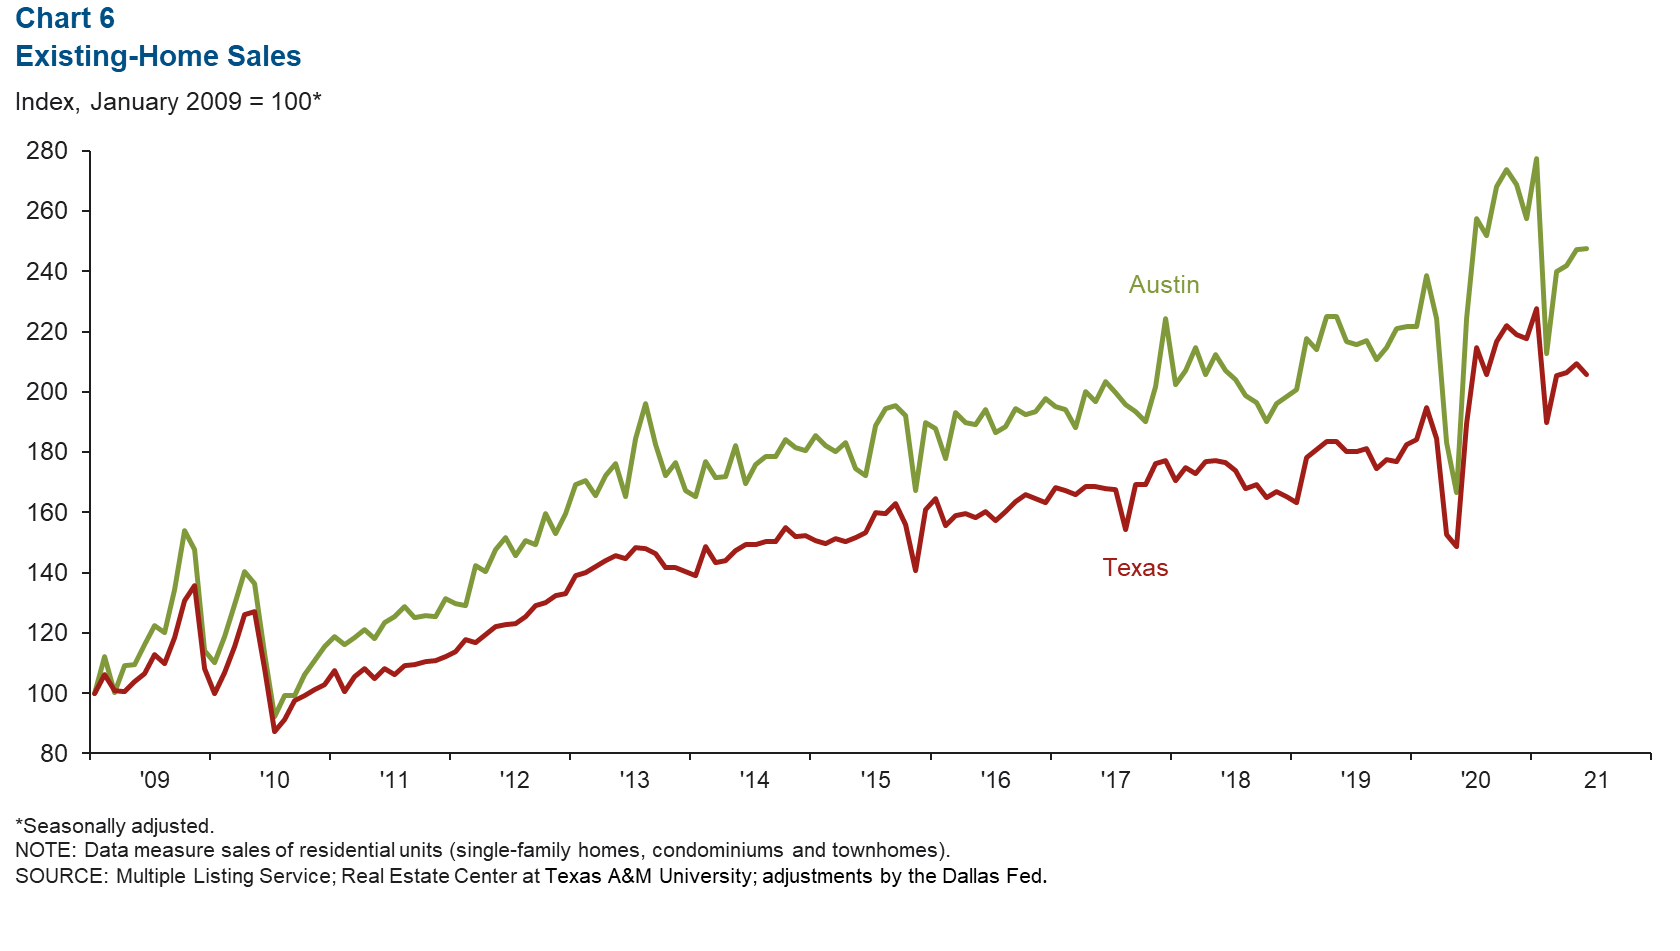
In June, the median price of homes sold was $462,748 in the metro, a 35.9 percent rise year over year, compared with $298,708 in Texas—a 13.2 percent increase. The recent slowing of home sales in Austin is likely due in part to a lack of supply; in June, there was a half-month supply of homes available.
NOTE: Data may not match previously published numbers due to revisions.
About Austin Economic Indicators
Questions can be addressed to Judy Teng at judy.teng@dal.frb.org. Austin Economic Indicators is released on the first Thursday of every month.