Austin Economic Indicators

December 2, 2021
The Austin economy continued to expand in October. The Austin Business-Cycle Index increased, led by strong payroll gains. The unemployment rate moved sideways, while the labor force grew strongly. Regional consumer spending growth remained healthy, and recent COVID-19 hospitalizations steadied after two months of decline. Existing-home sales contracted in October.
Business-Cycle Index
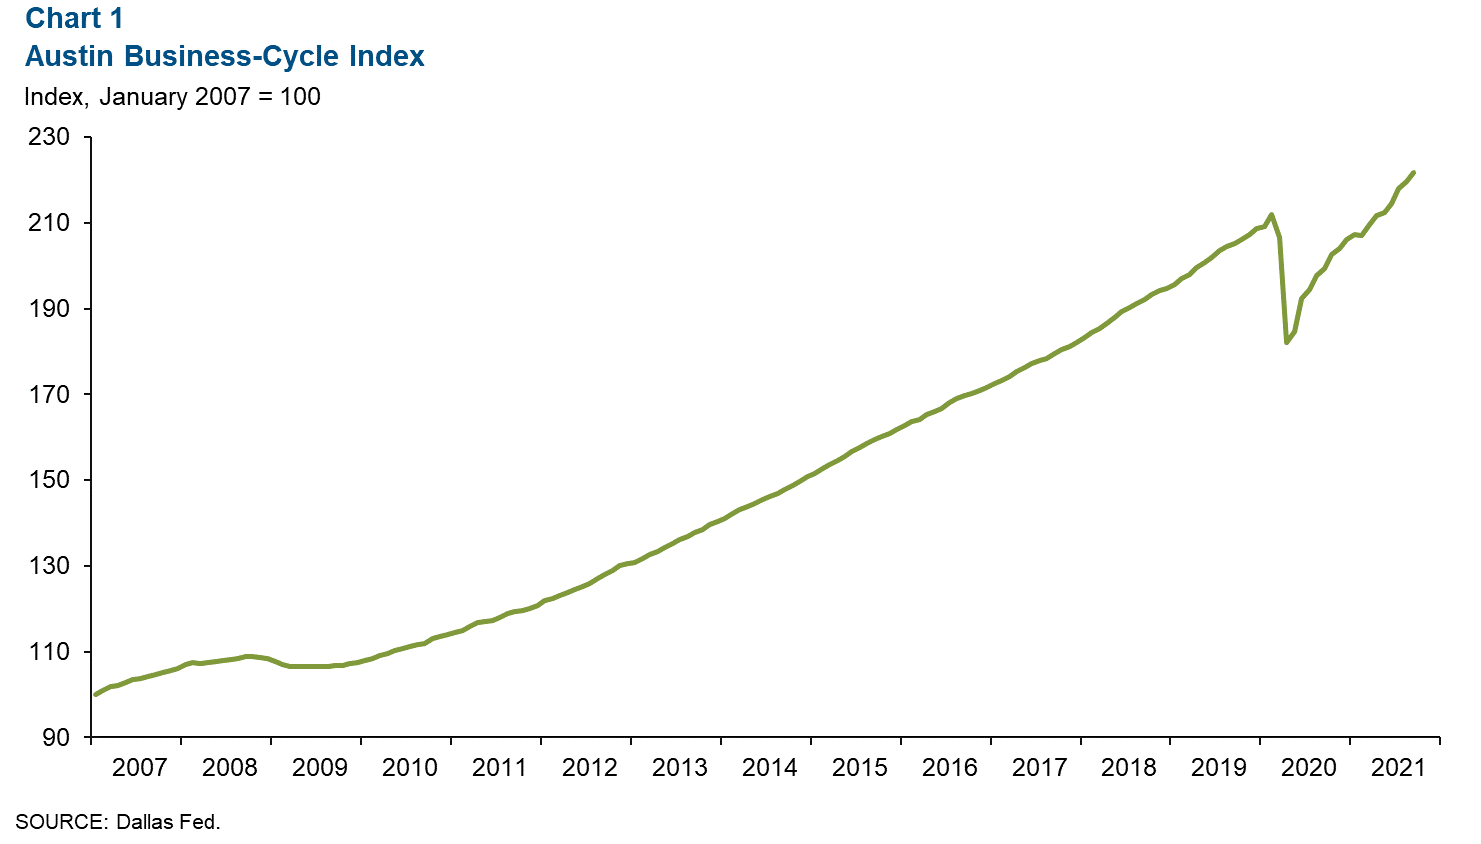
The Austin Business-Cycle Index—a broad measure of economic activity—increased a robust 13.1 percent on an annualized basis in October following an already-strong 10.8 percent growth in September (Chart 1). Job gains led the components.
Labor Market
Unemployment Rate Unchanged
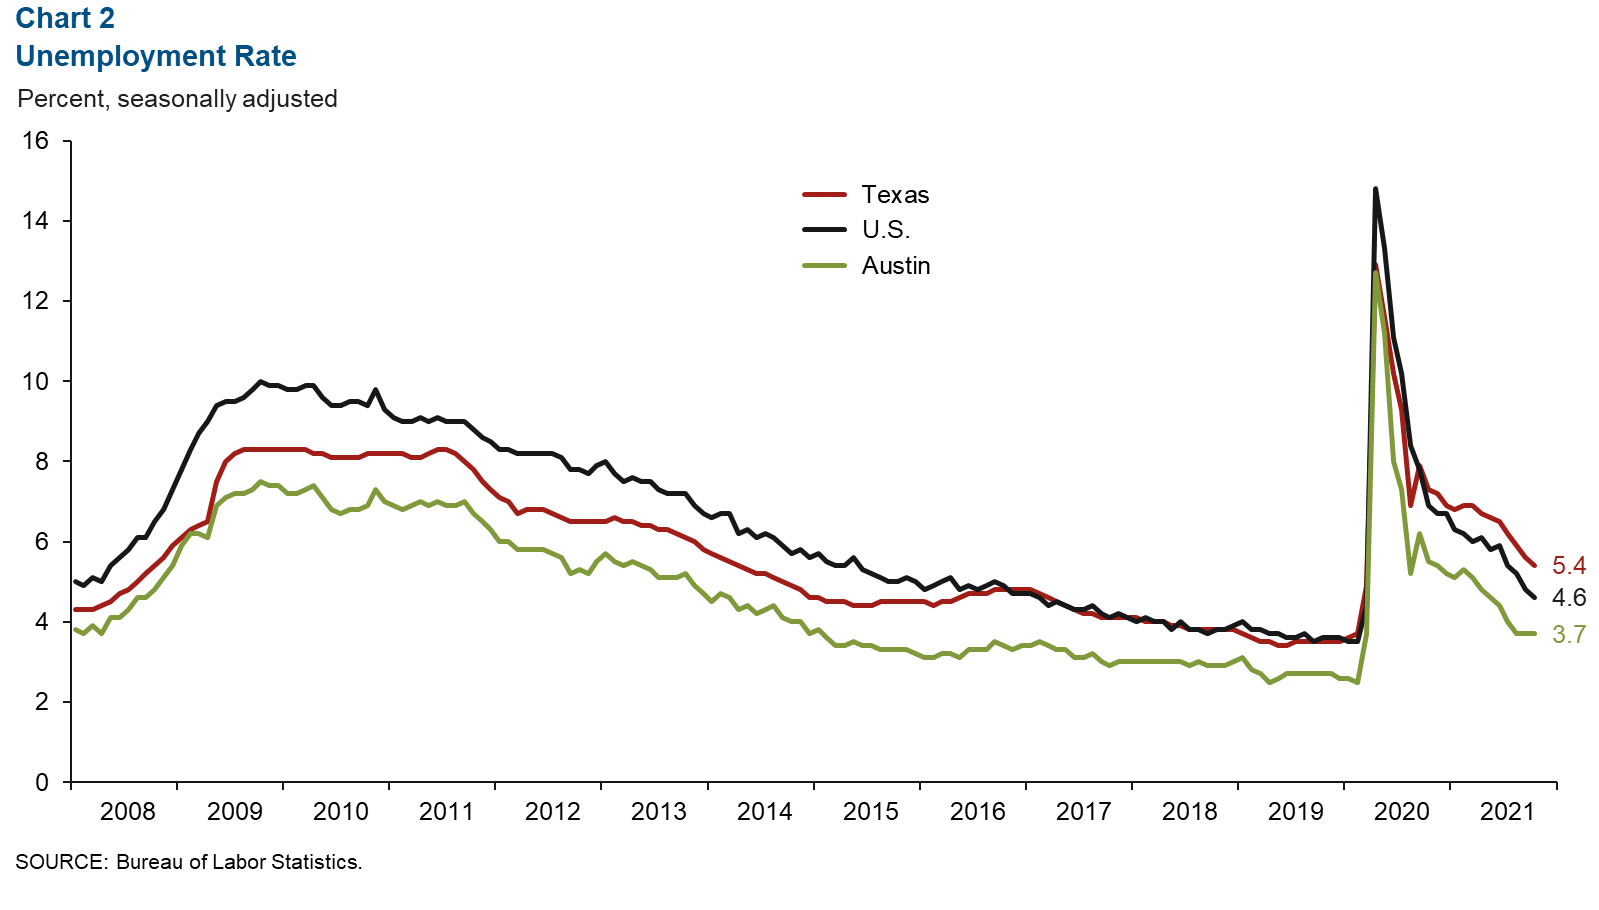
Austin’s unemployment rate remained at 3.7 percent in October (Chart 2). This is well below the state’s jobless rate of 5.4 percent and the nation’s rate of 4.6 percent. The metro labor force grew strongly at 7.8 percent in the three months ending in October—well above the state’s 2.8 percent increase and the nation’s 0.3 percent uptick.
Recent Payrolls Largely Positive Across Sectors
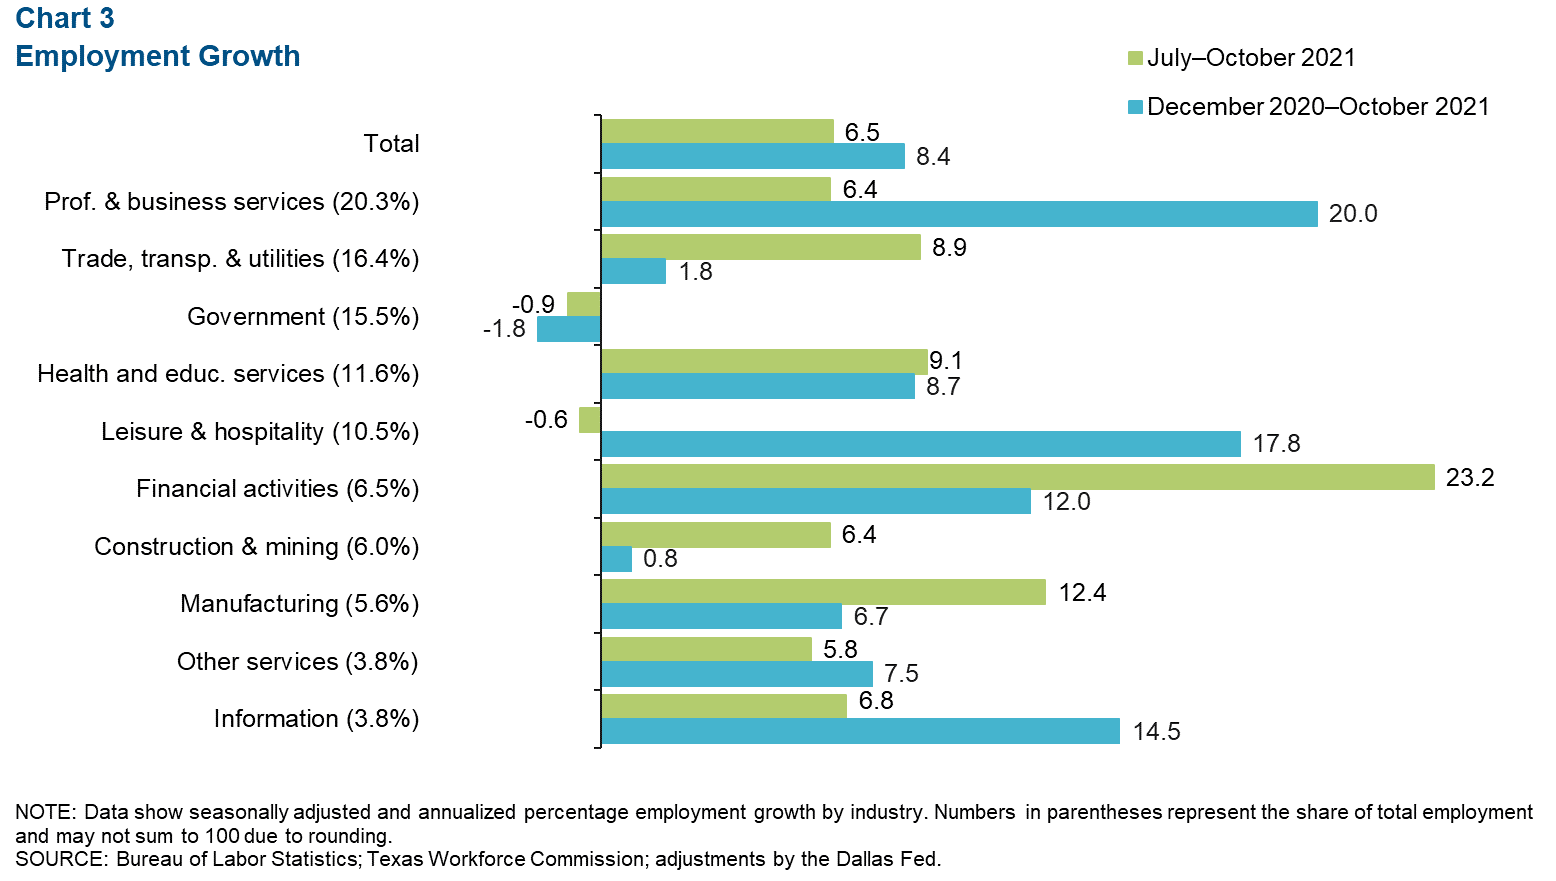
Austin payrolls strengthened an annualized 6.5 percent, or by 18,455 net jobs, in the three months ending in October (Chart 3). Financial activities led the sectors (up 23.2 percent, or 3,925 jobs) and was followed by manufacturing (up 12.4 percent, or 1,905 jobs), and health and education services (up 9.1 percent, or 2,970 jobs). As of October 2021, Austin payrolls are 3.9 percent above February 2020 levels; by May 2021, the region had recovered all 140,707 jobs lost at the onset of the pandemic.
Consumer Spending
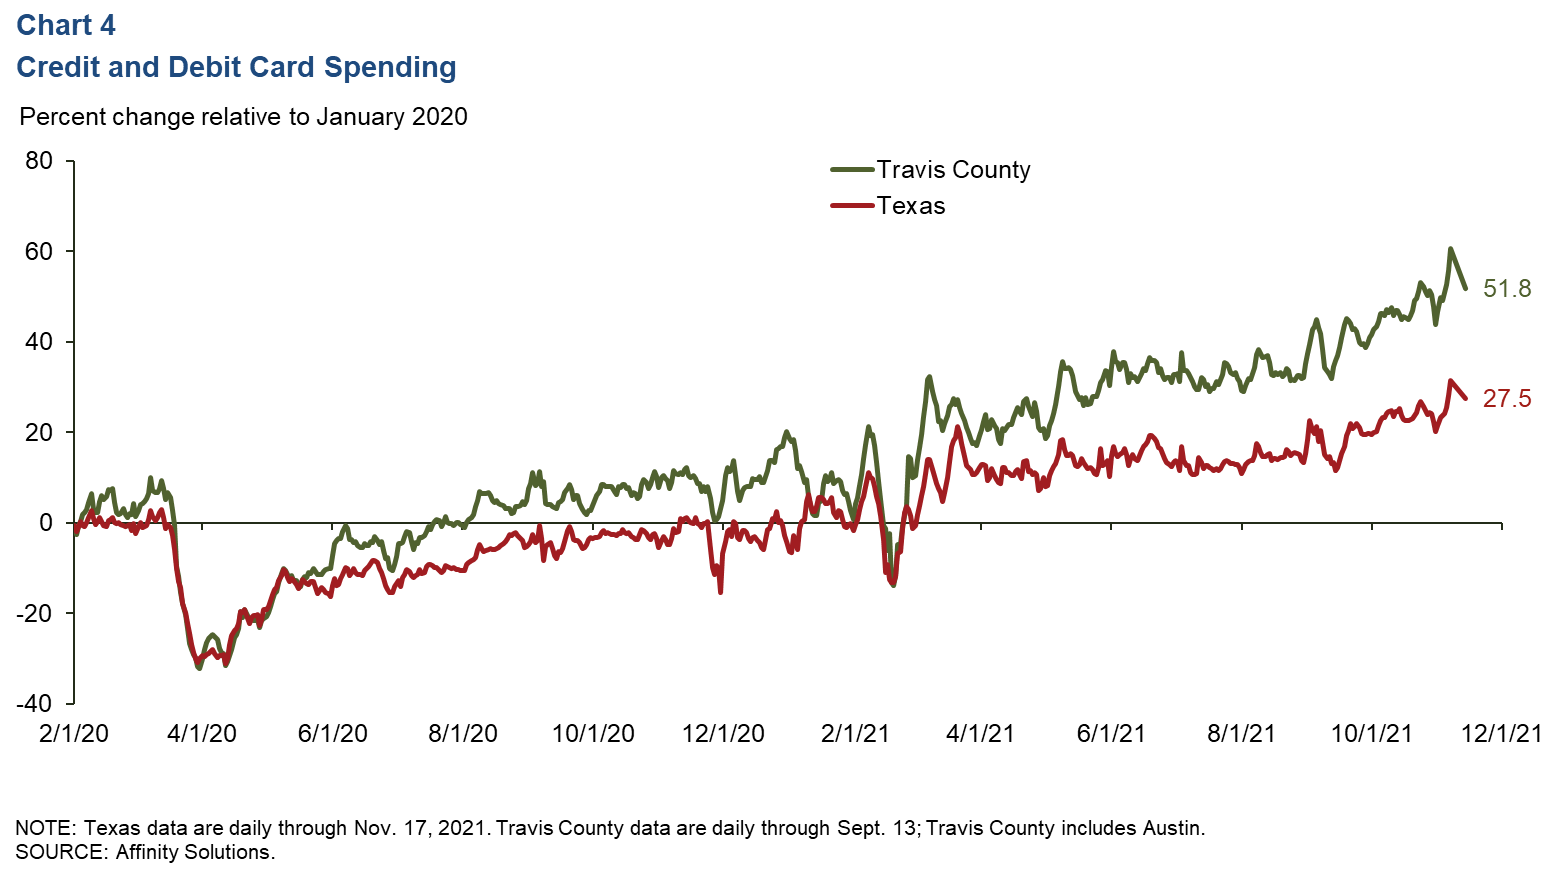
Consumer spending in Austin slipped in early November. In the metro’s most-populous county, Travis, credit and debit card spending has consistently surpassed January 2020 levels since last July, except for a dip in late November 2020 and during Winter Storm Uri in mid-February this year. As of Nov. 14, 2021, spending in the county was up a booming 51.8 percent relative to January 2020 (Chart 4). In the state, spending was 27.5 percent higher than January 2020 levels.
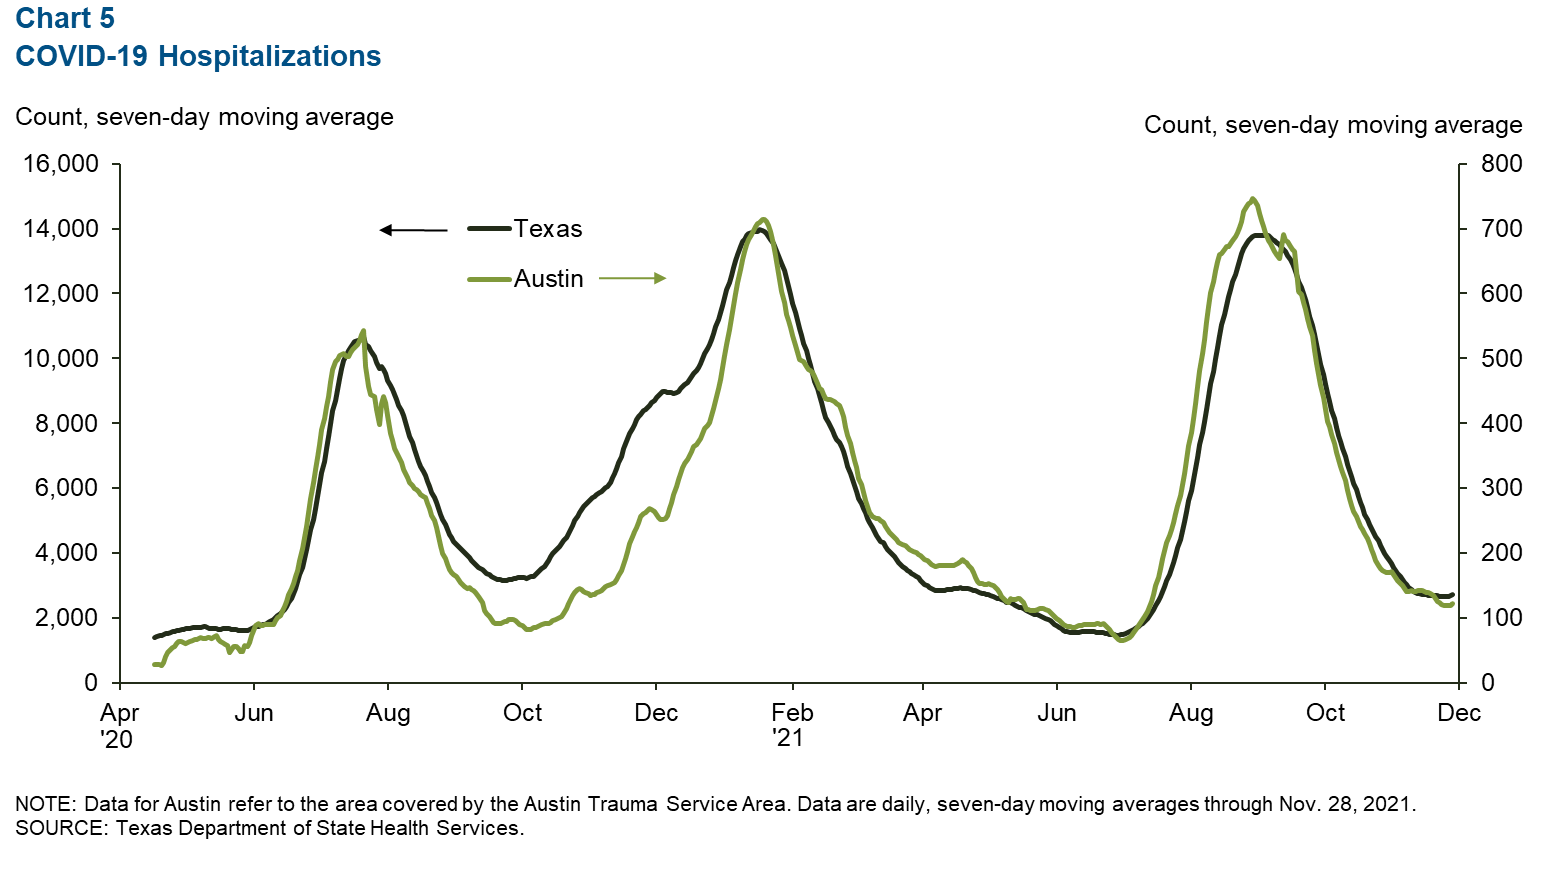
COVID-19 Statistics
After declining for the previous two months, the number of people currently hospitalized with COVID-19 in Austin and the state has steadied since mid-November (Chart 5). As of Nov. 28, 122 people were hospitalized with COVID-19 in Austin while 2,716 people were hospitalized in the state.
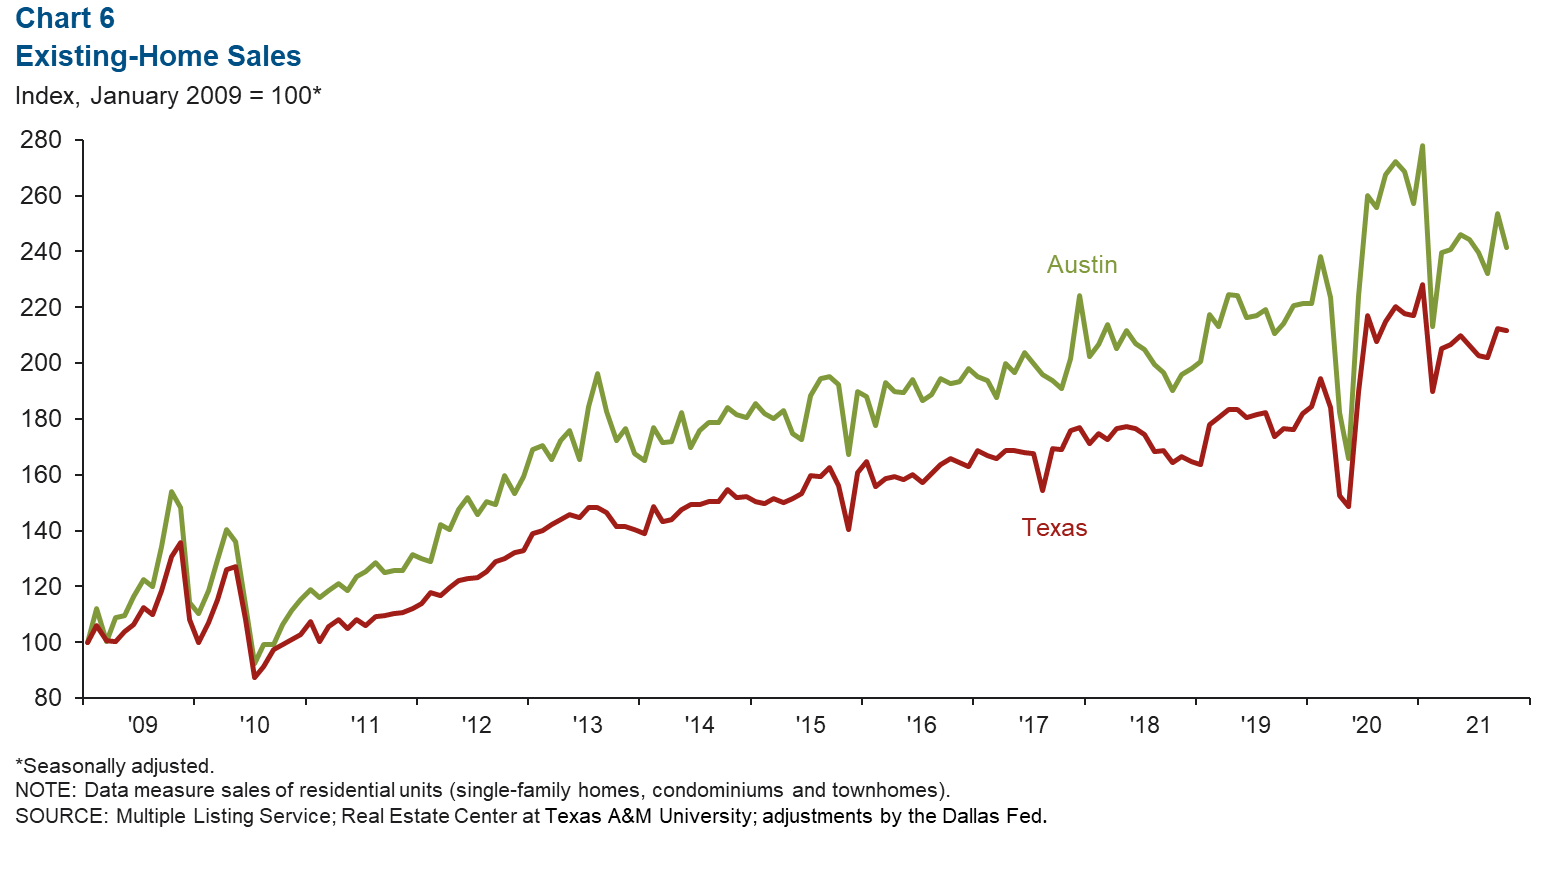
Real Estate
October existing-home sales in Austin contracted 4.8 percent after posting a 9.3 percent expansion in September (Chart 6). This compares with the state’s 0.3 percent decline in October and 5.1 percent gain in September. In the first 10 months of the year, home sales were up 5.1 percent in the metro and 8.4 percent in the state relative to the same period in 2020. In October, the median price of homes sold was $459,443 in the metro, a 17.8 percent rise year over year, compared with the state at $312,903—an 8.4 percent jump.
NOTE: Data may not match previously published numbers due to revisions.
About Austin Economic Indicators
Questions can be addressed to Judy Teng at judy.teng@dal.frb.org. Austin Economic Indicators is released on the first Thursday of every month.