Austin Economic Indicators

October 6, 2022
Austin’s economy slowed in August, as the Austin Business-Cycle Index grew slightly, unemployment declined, and COVID-19 hospitalizations fell. Existing-home sales were stable, while housing inventory recovered, and employment and wage growth declined.
Business-cycle index
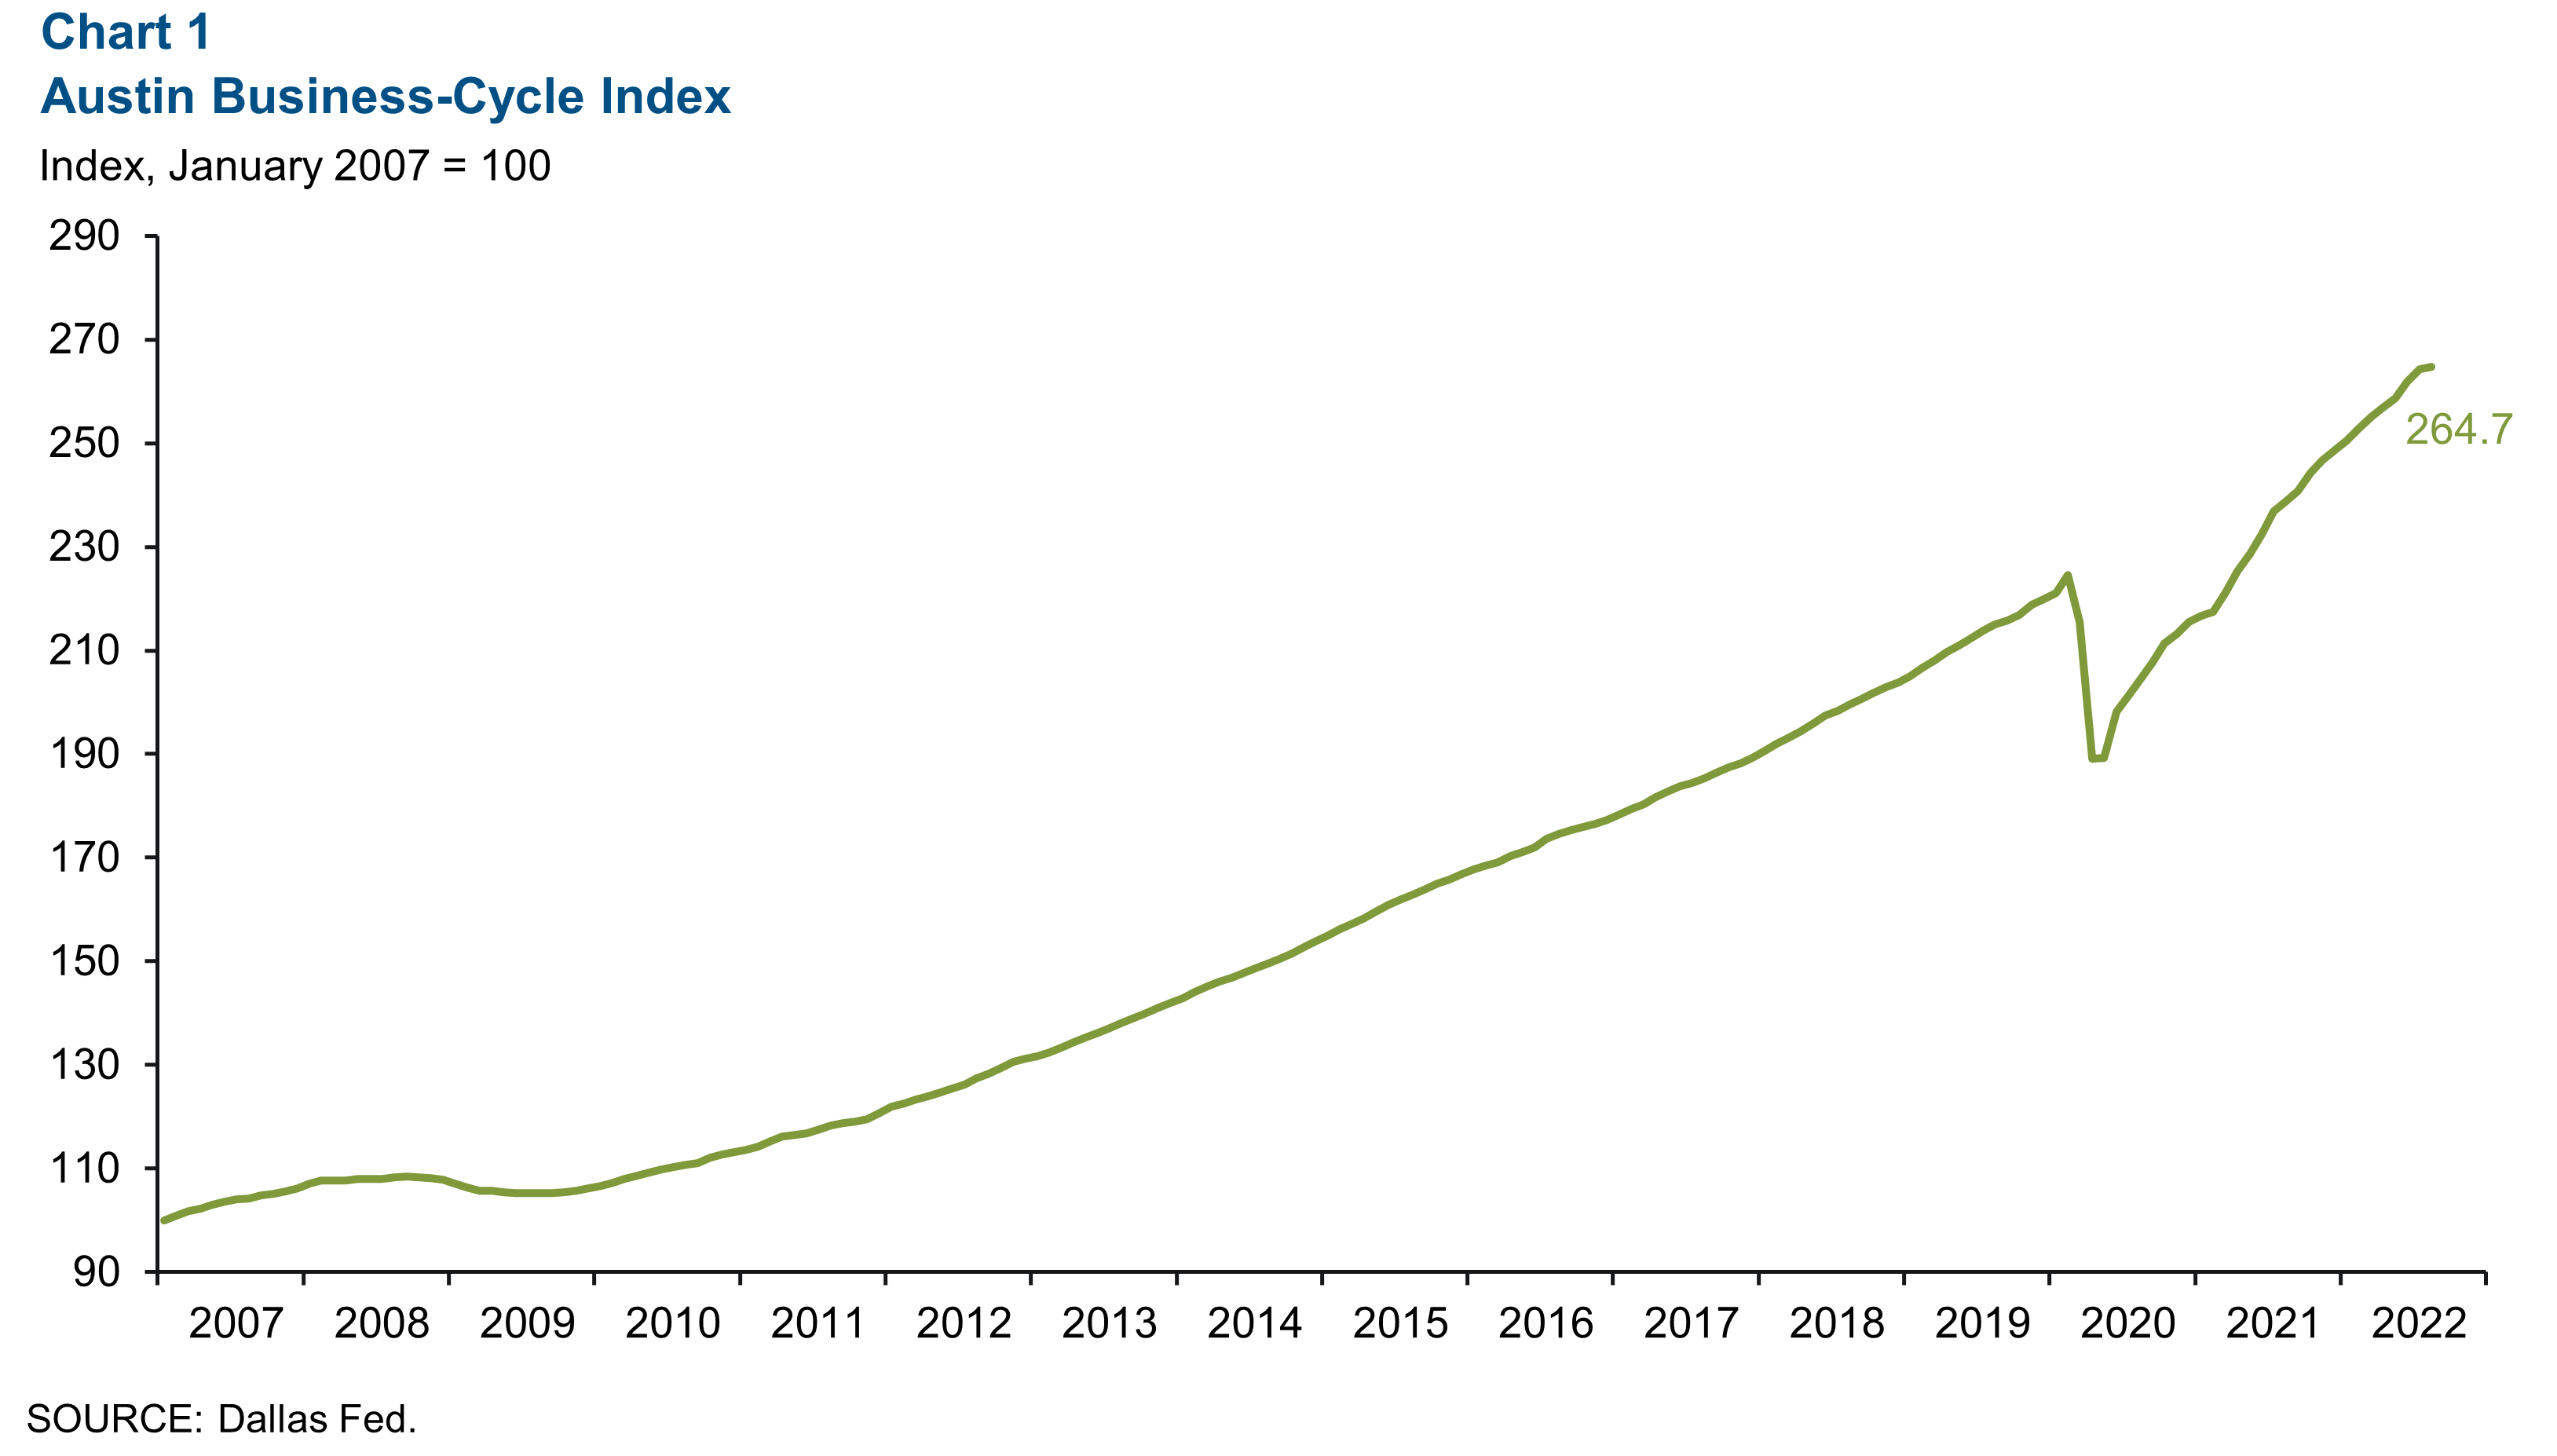
The Austin Business-Cycle Index—a broad measure of economic activity—grew at an annualized 2.1 percent in August, slowing from 11.7 percent growth in July (Chart 1).
Labor market
Unemployment rate ticks down
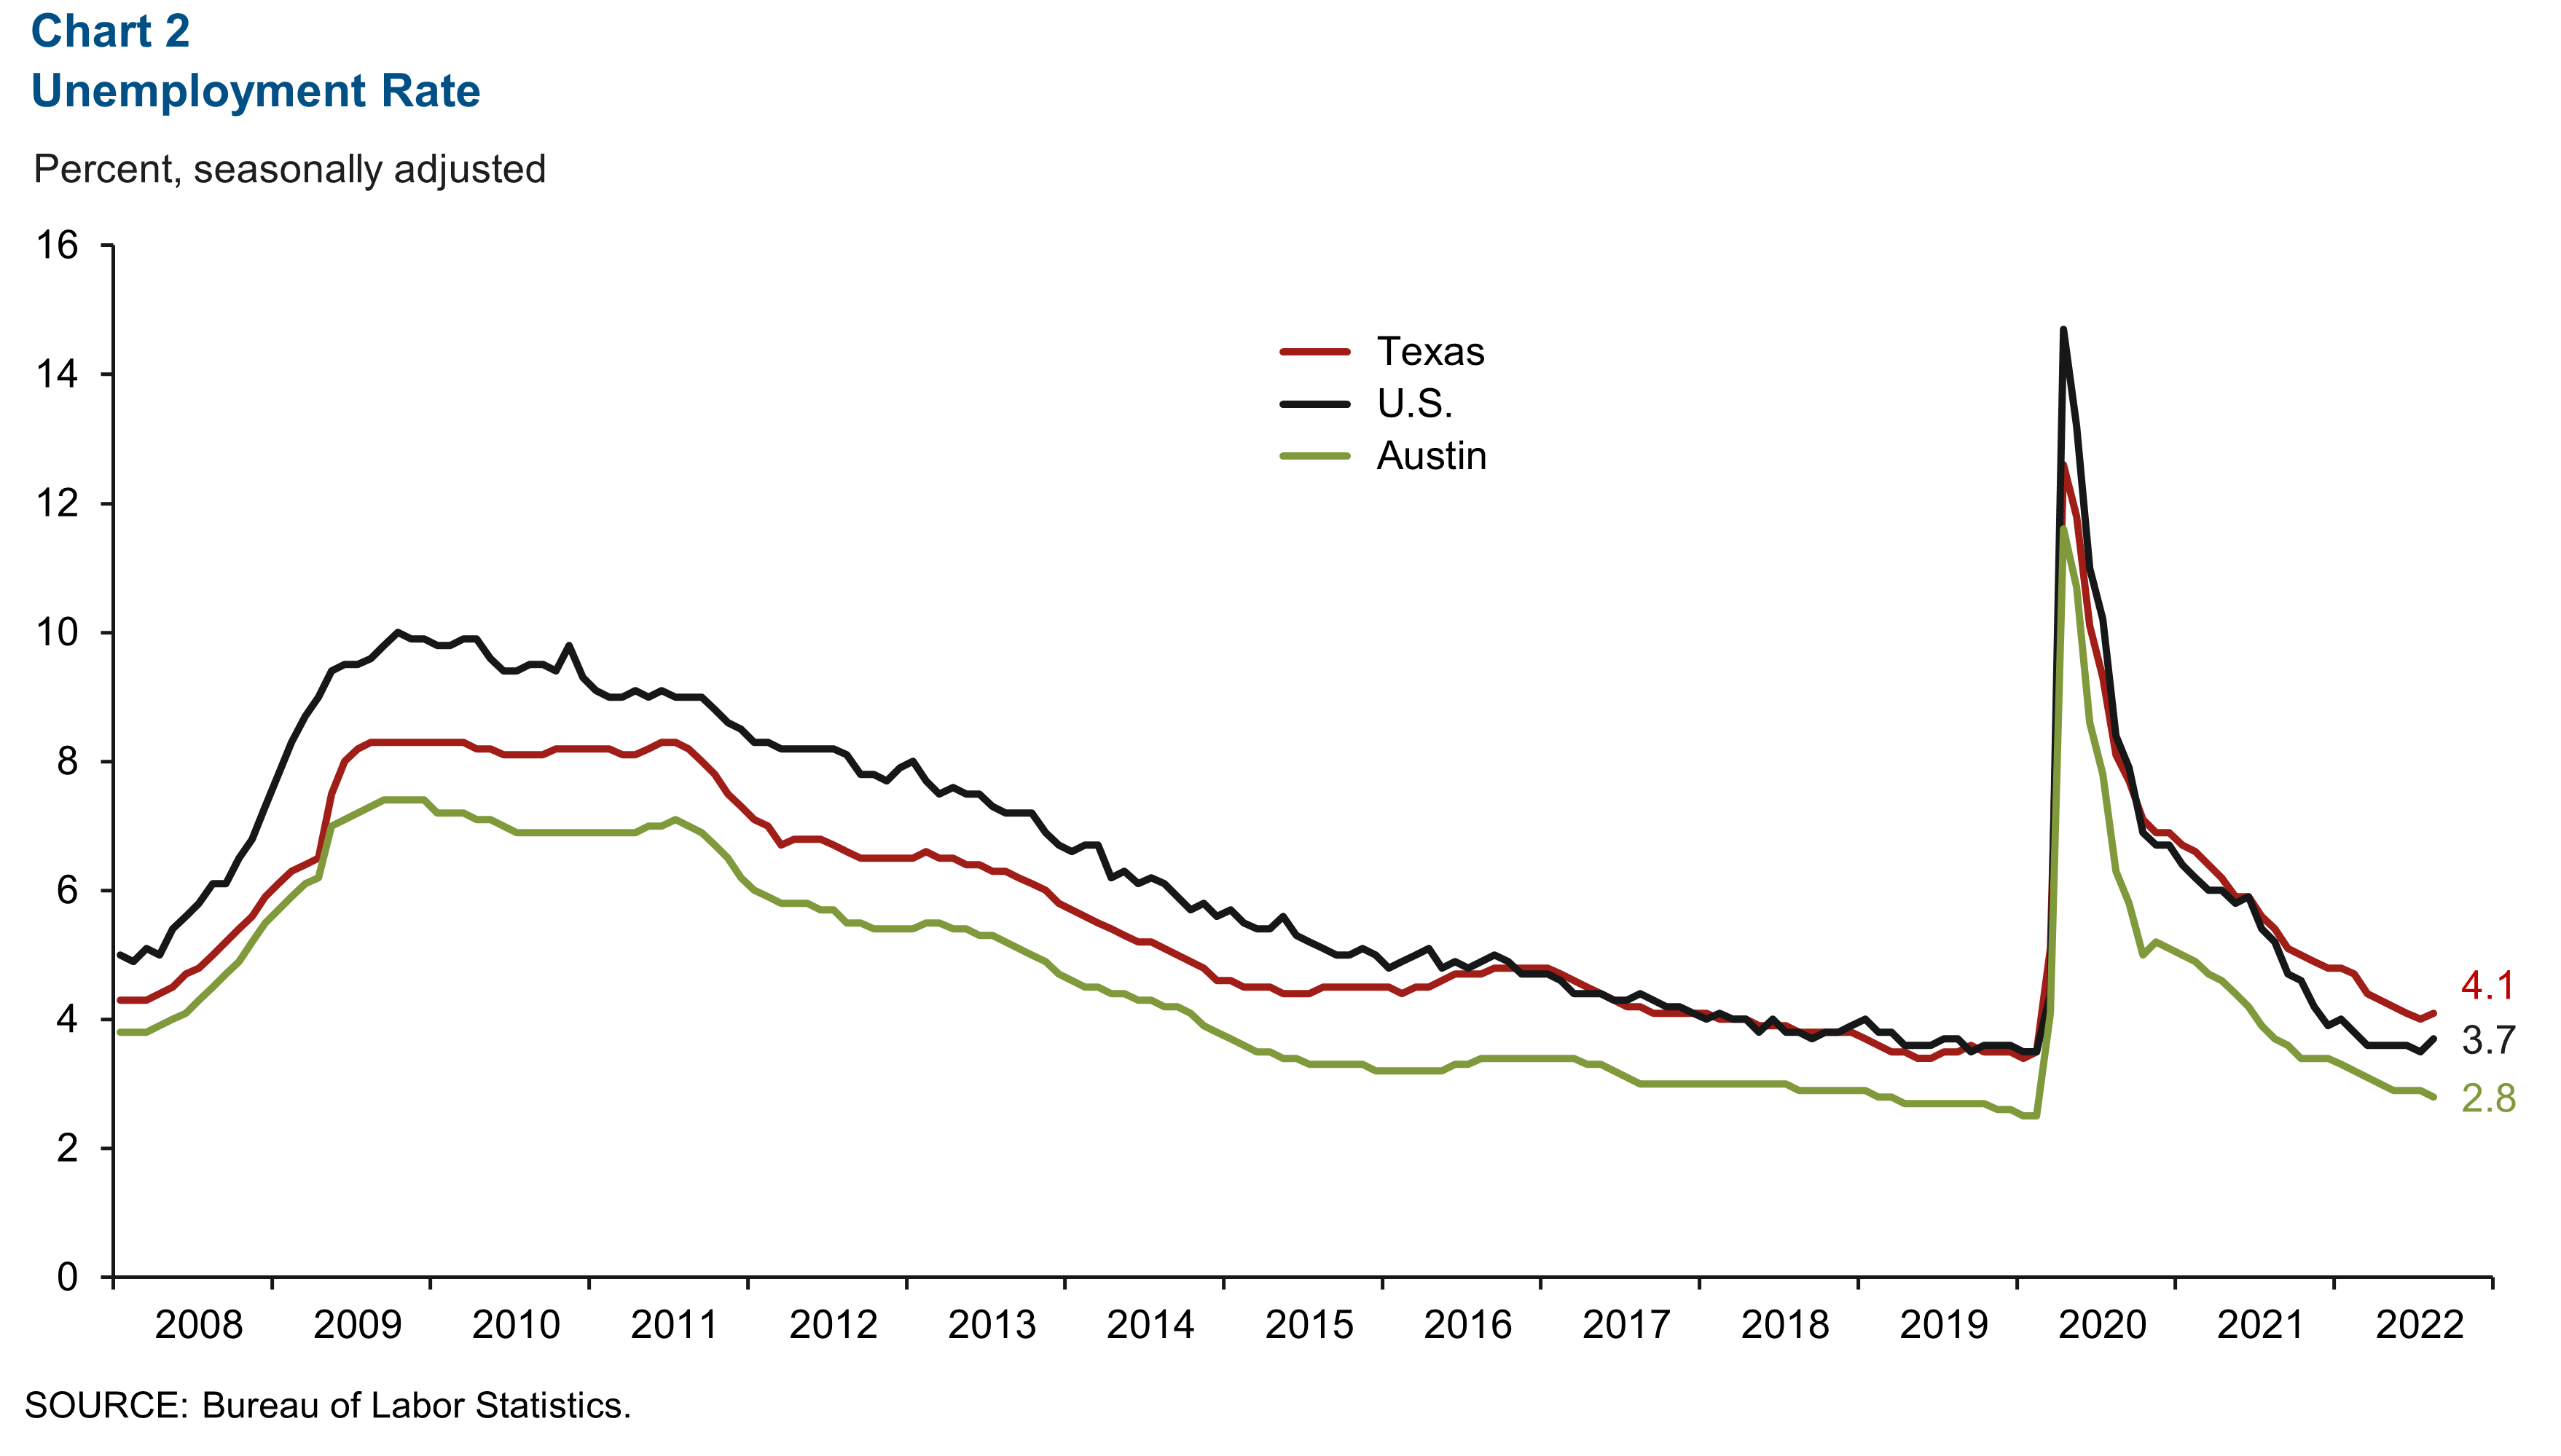
Austin’s unemployment rate fell to 2.8 percent in August, which compares to the state’s figure of 4.1 percent and the nation’s 3.7 percent (Chart 2). The metro area labor force increased an annualized 2.0 percent in July.
Most sectors post job declines
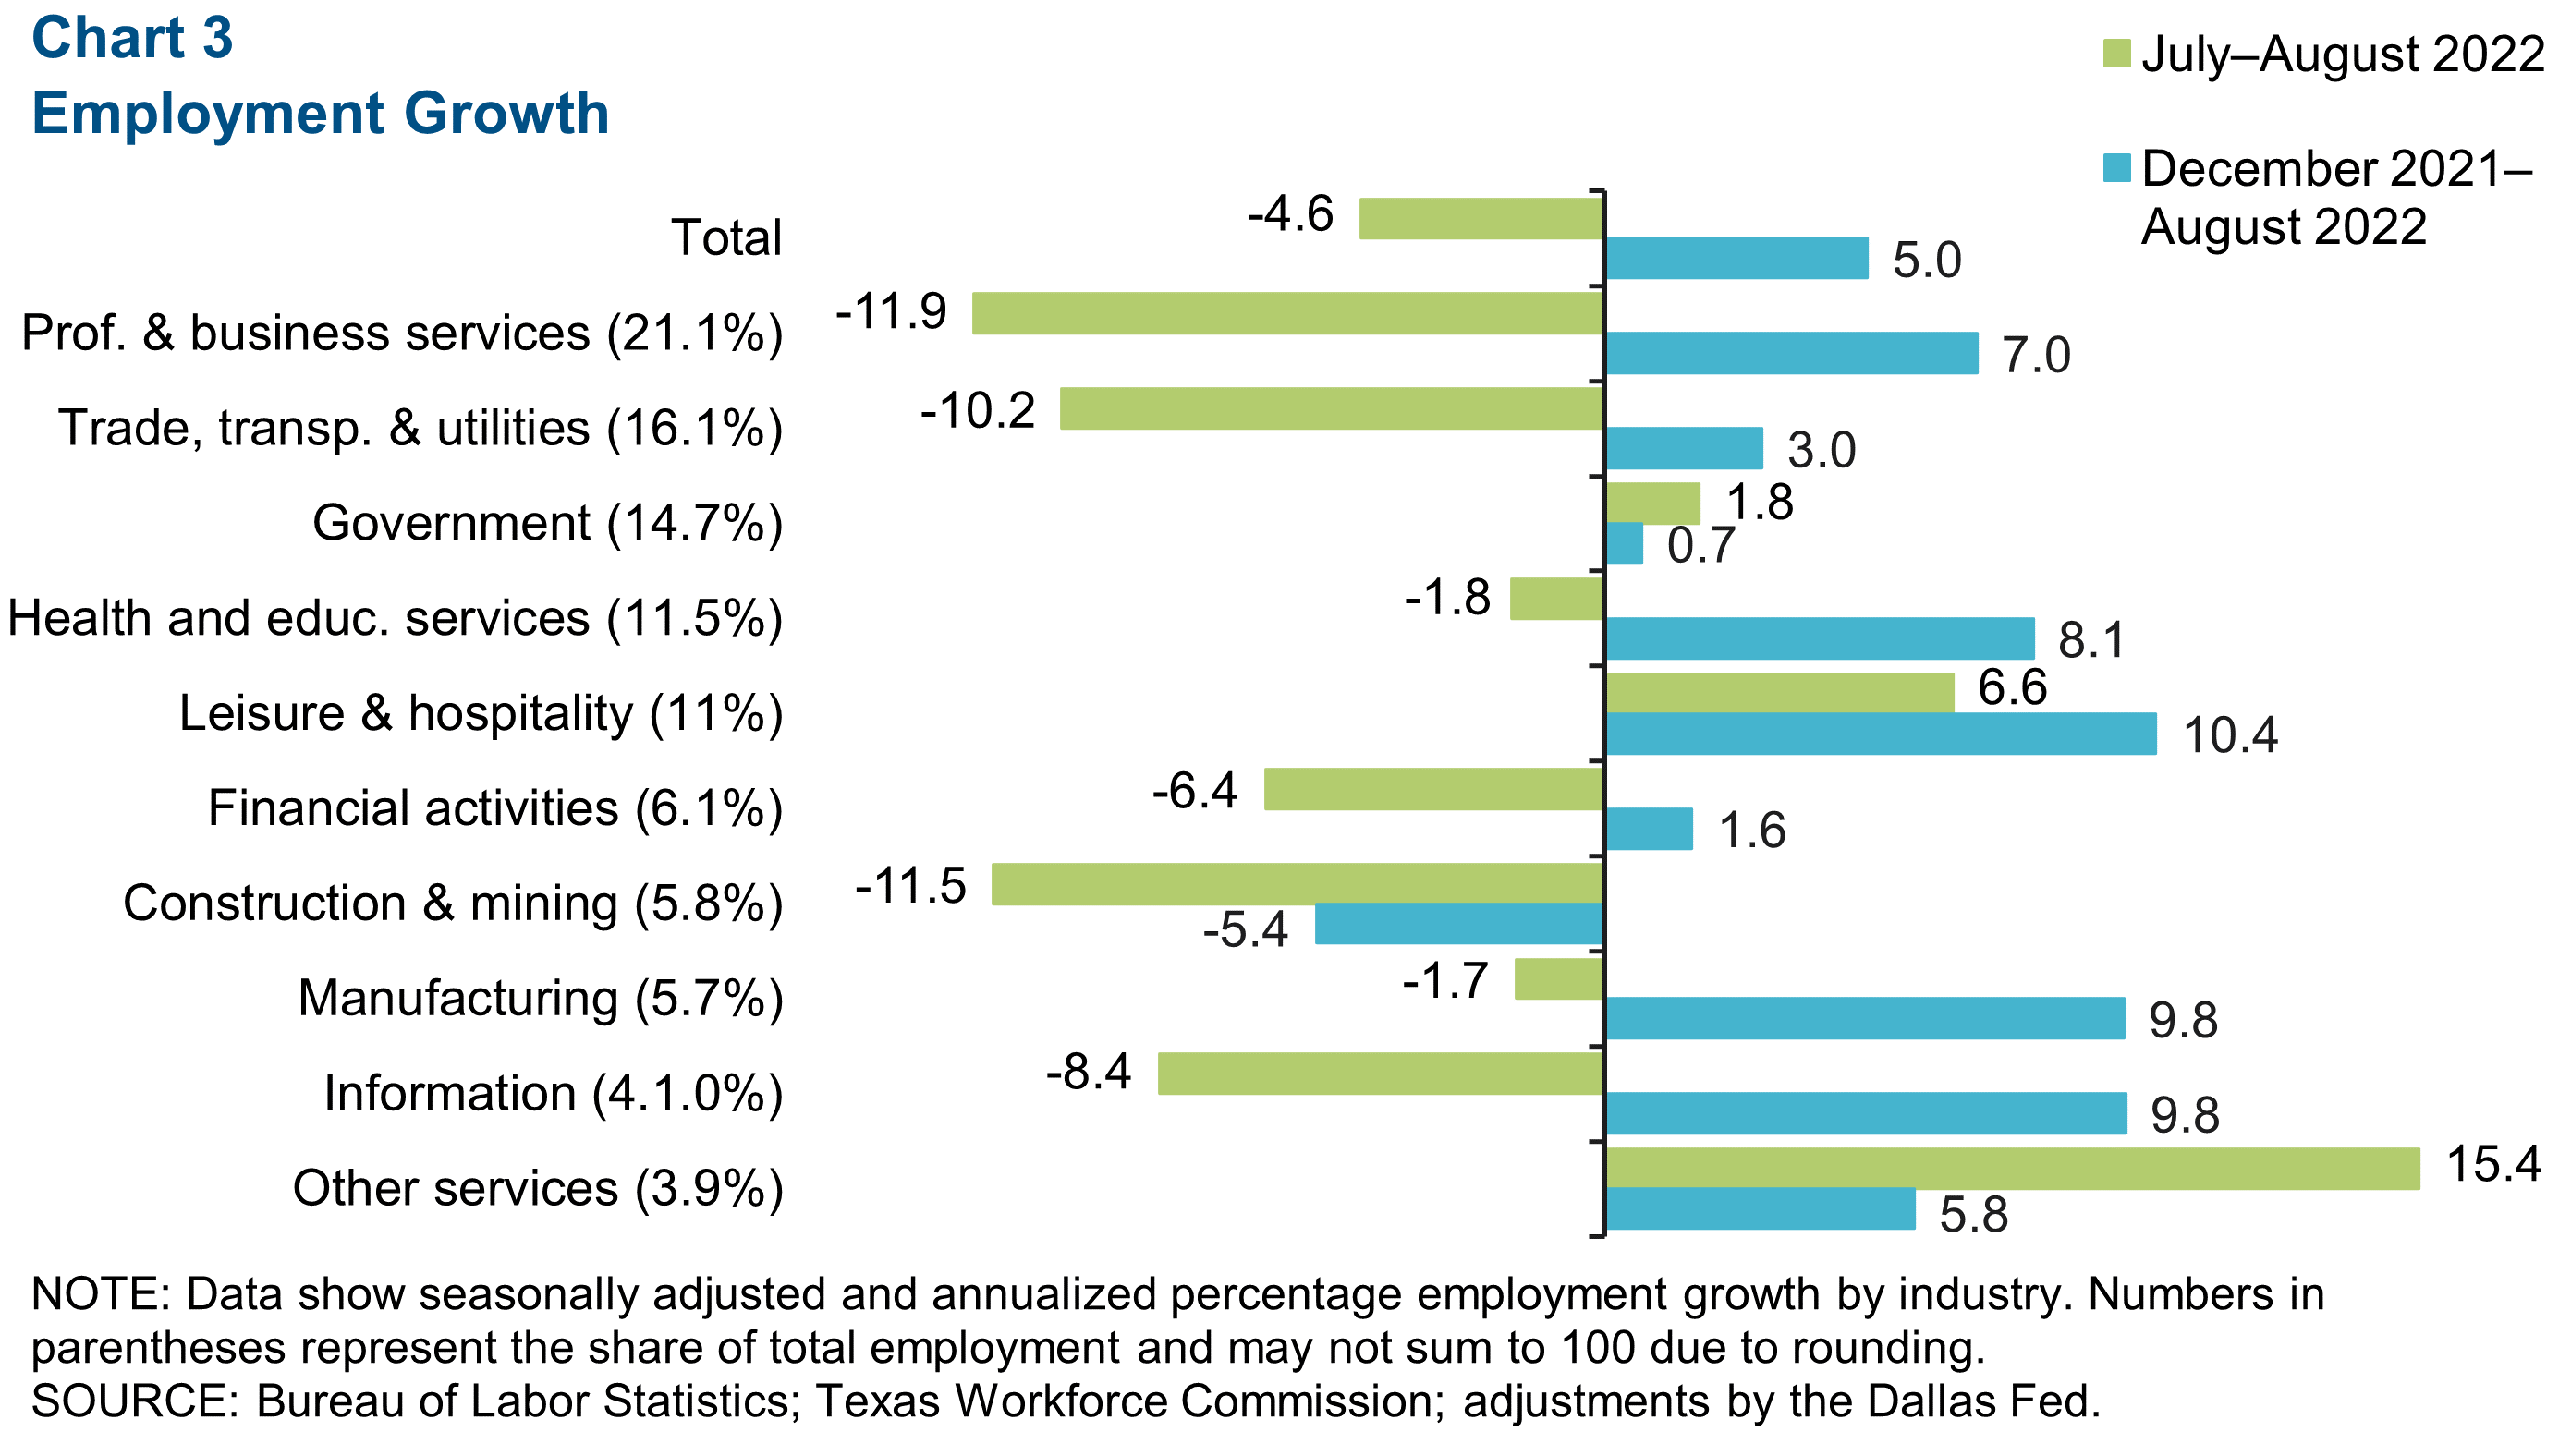
Austin employment fell an annualized 4.6 percent, or by 4,933 net jobs, in August (Chart 3). This was due to declines in professional and business services (11.9 percent, or 2,814 jobs), construction and mining (11.5 percent, or 749 jobs), and trade, transportation and utilities (10.2 percent, or 1,831 jobs). However, other services (15.4 percent, or 577 jobs), and leisure and hospitality (6.6 percent, or 728 jobs) saw increases. As of August, Austin payrolls have increased 6.1 percent year over year and 5.0 percent year to date.
Wages
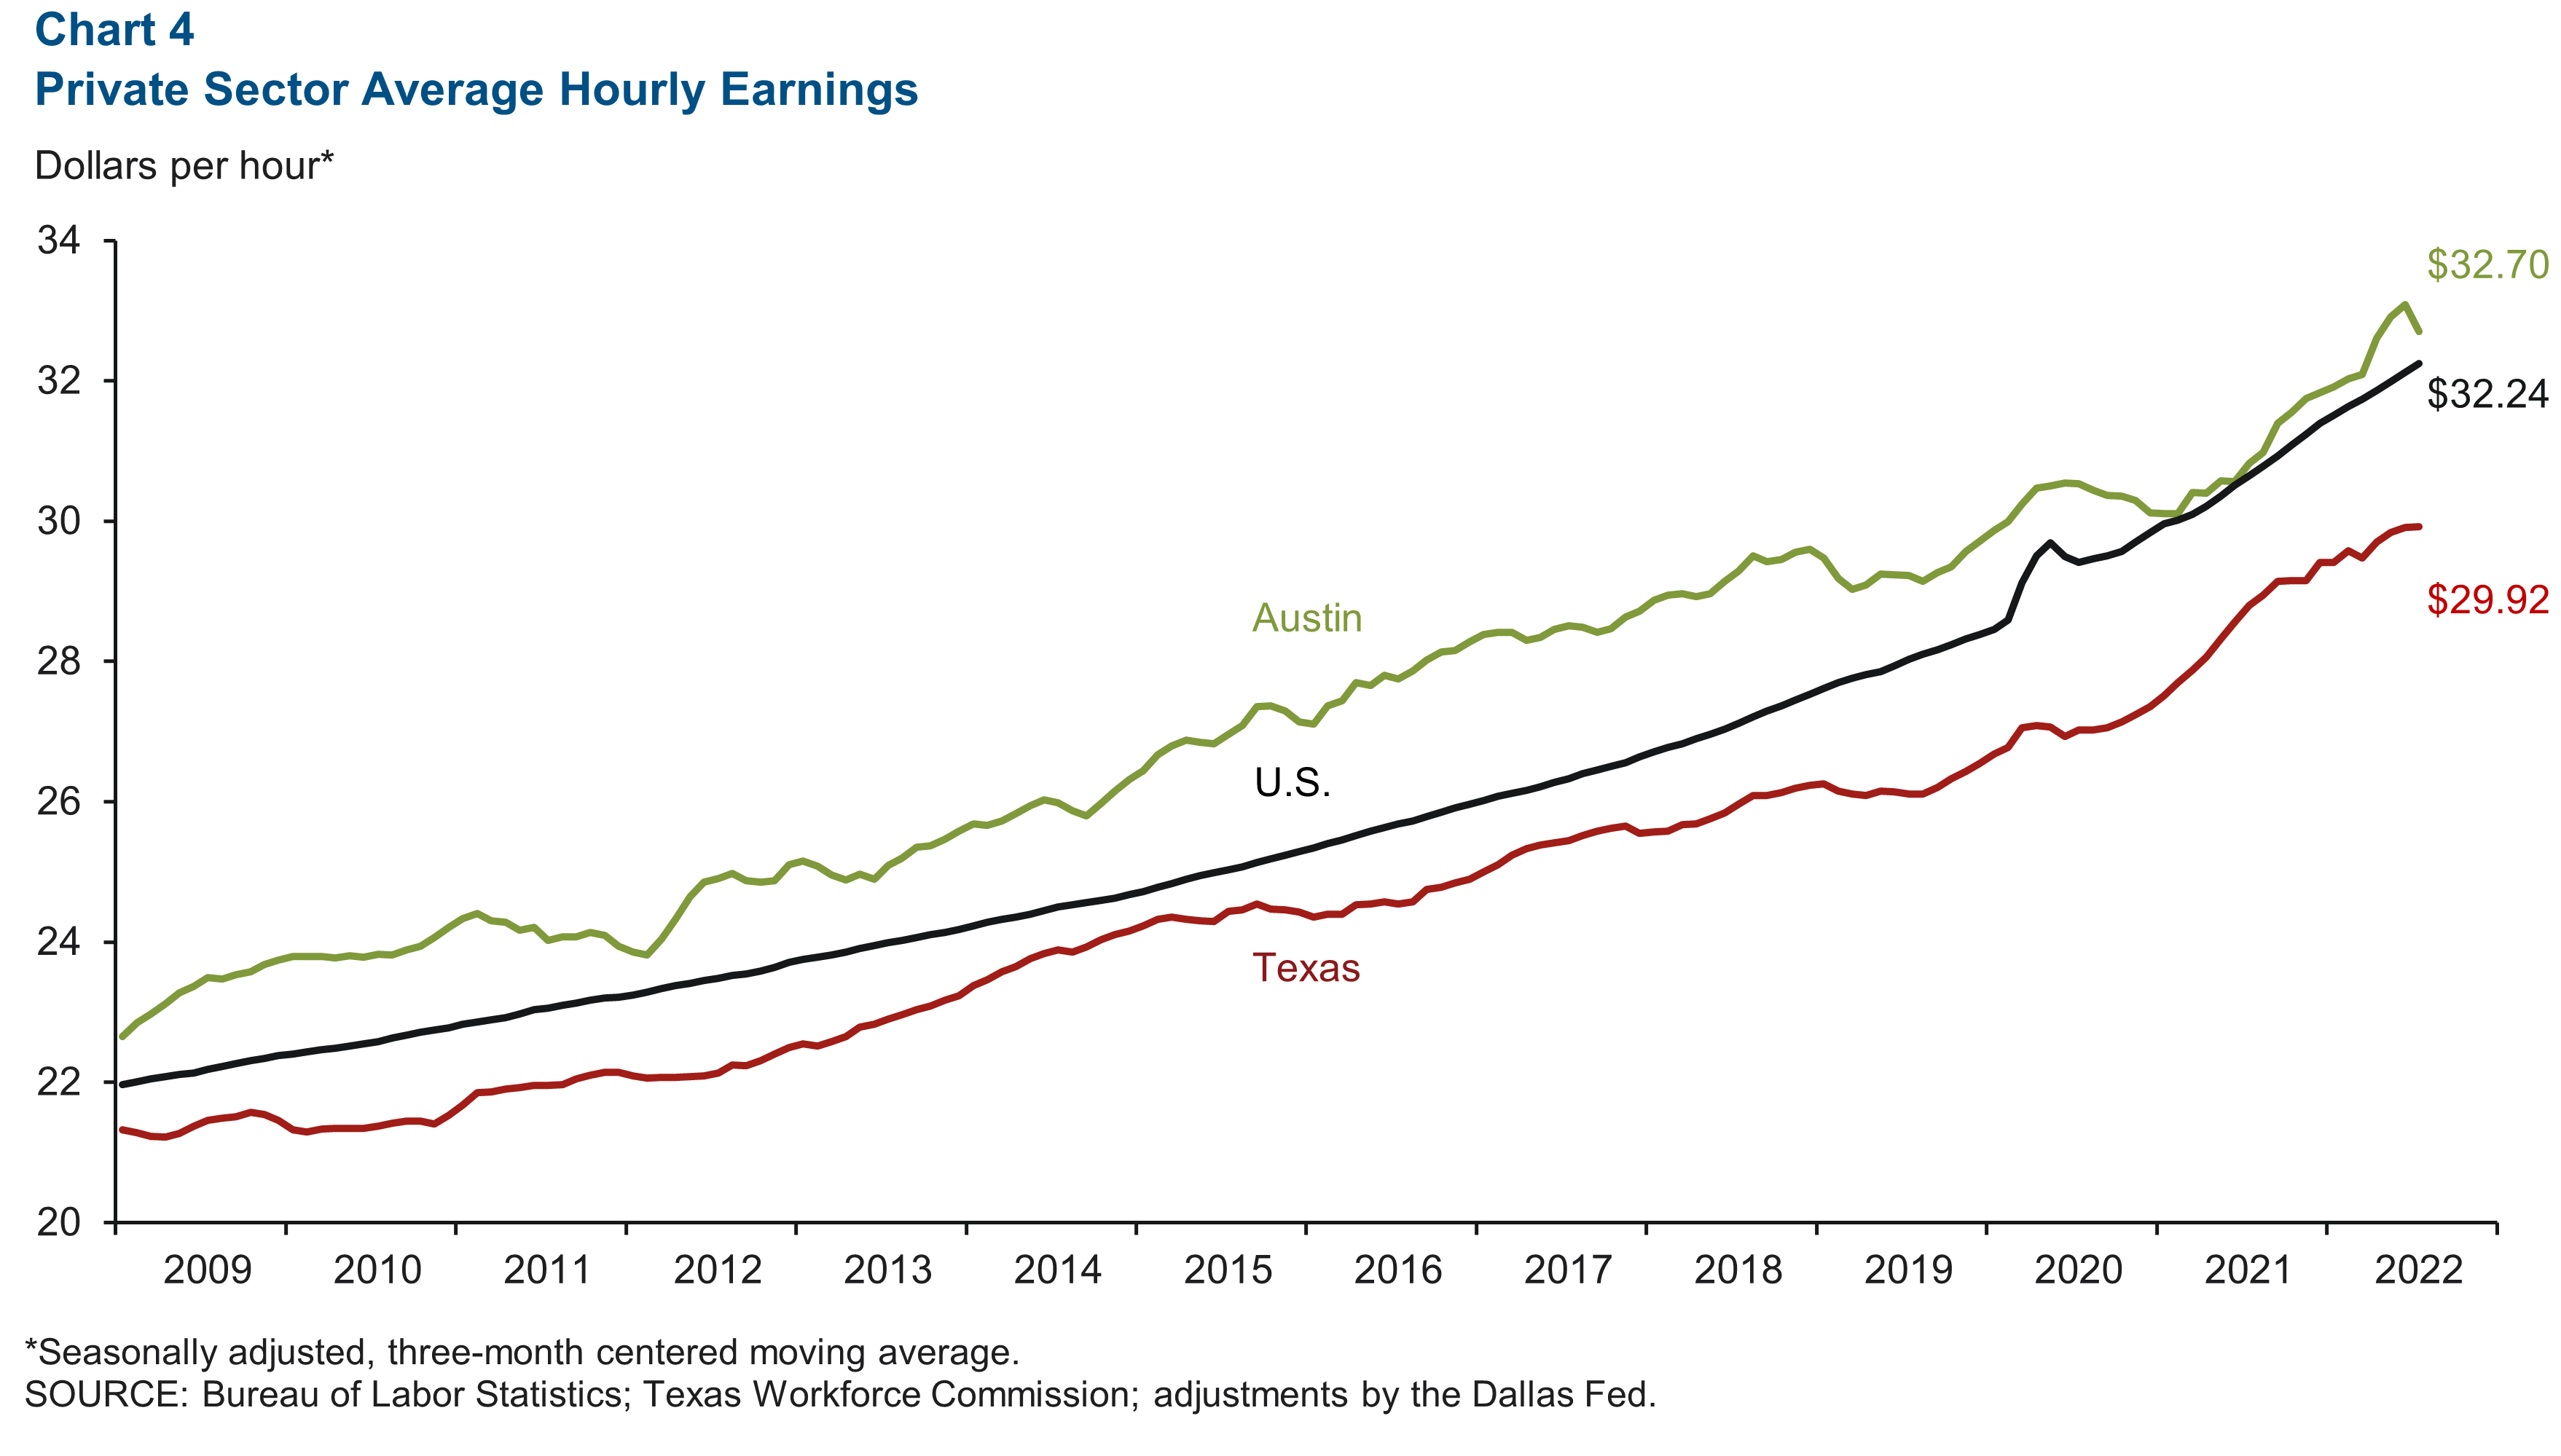
Austin’s three-month moving average for wages declined to $32.70 in August, remaining higher than both the U.S. average of $32.24 and the state average of $29.92 (Chart 4). Year-over-year wage growth for Austin declined to 3.5 percent, remaining above Texas’ 2.7 percent gains, but no longer outpacing the U.S. growth of 5.2 percent.
COVID-19
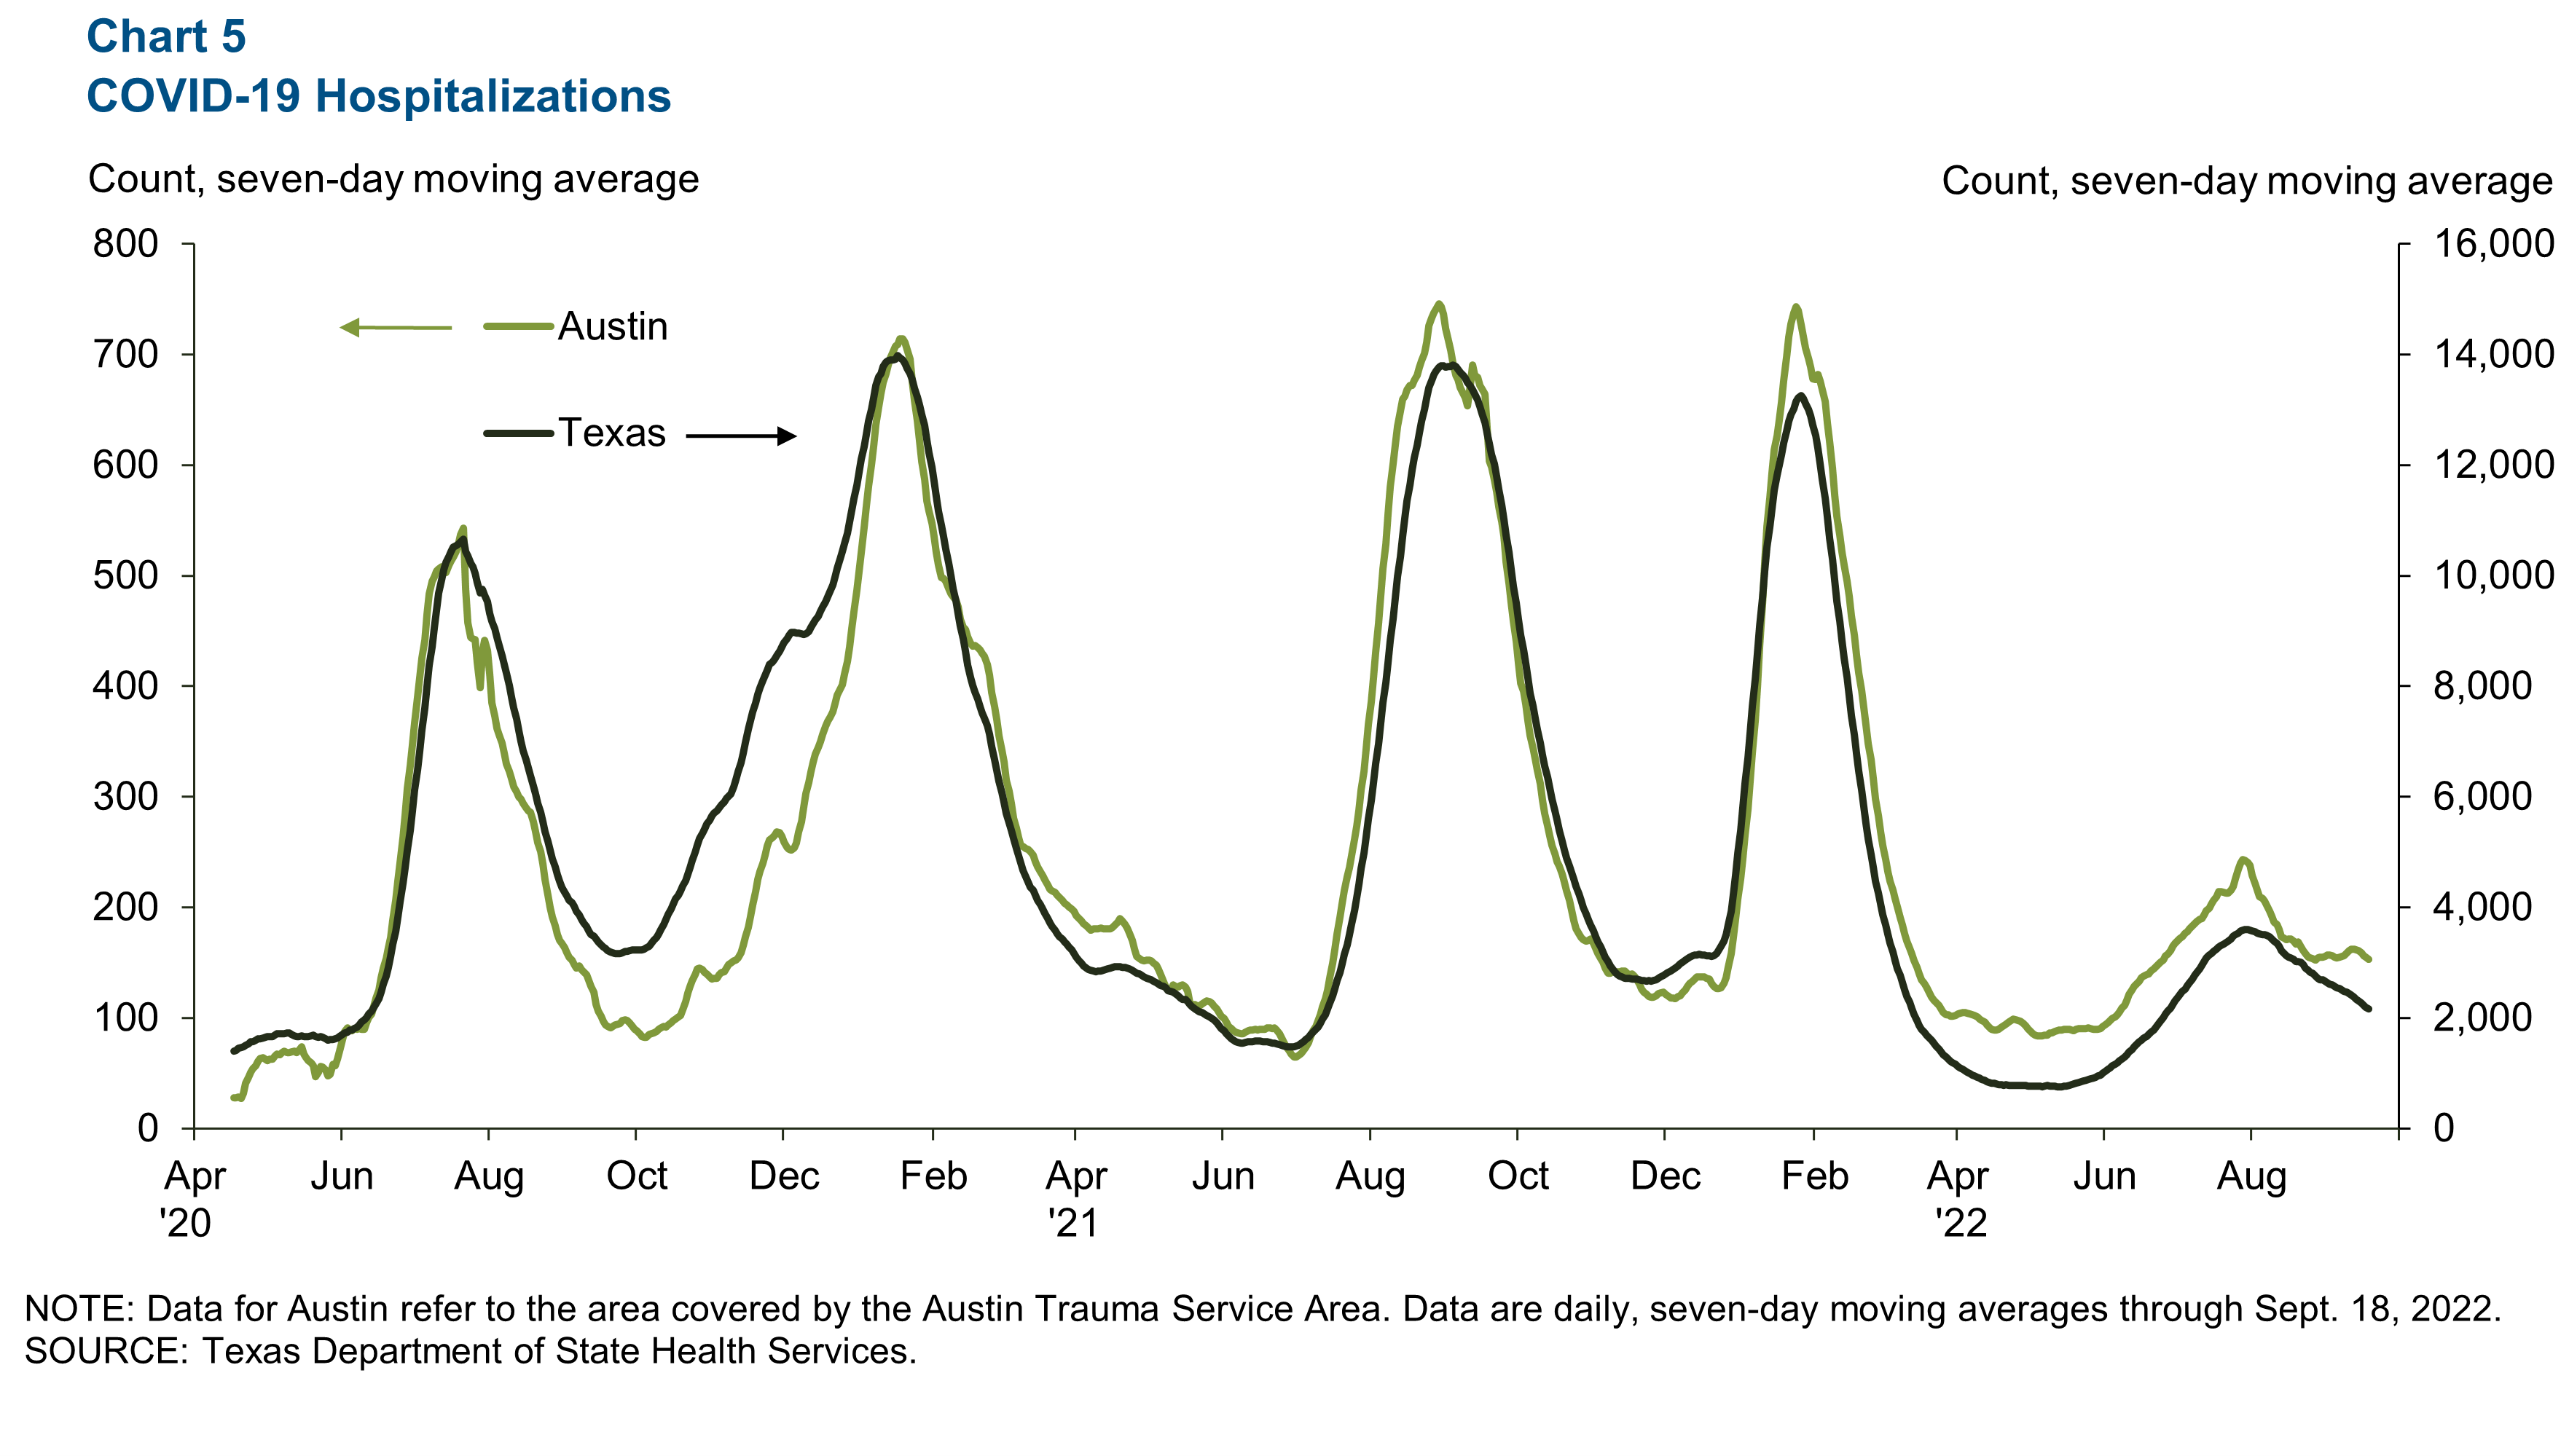
In August, the number of people hospitalized with COVID-19 both in Austin and Texas dropped (Chart 5). In the past two weeks, Austin’s hospitalization rate declined 5.2 percent, while Texas saw a decrease of 27.0 percent. As of Sept. 18, 140 people in Austin and 2,074 people in the state were hospitalized with COVID-19.
Home sales and inventory
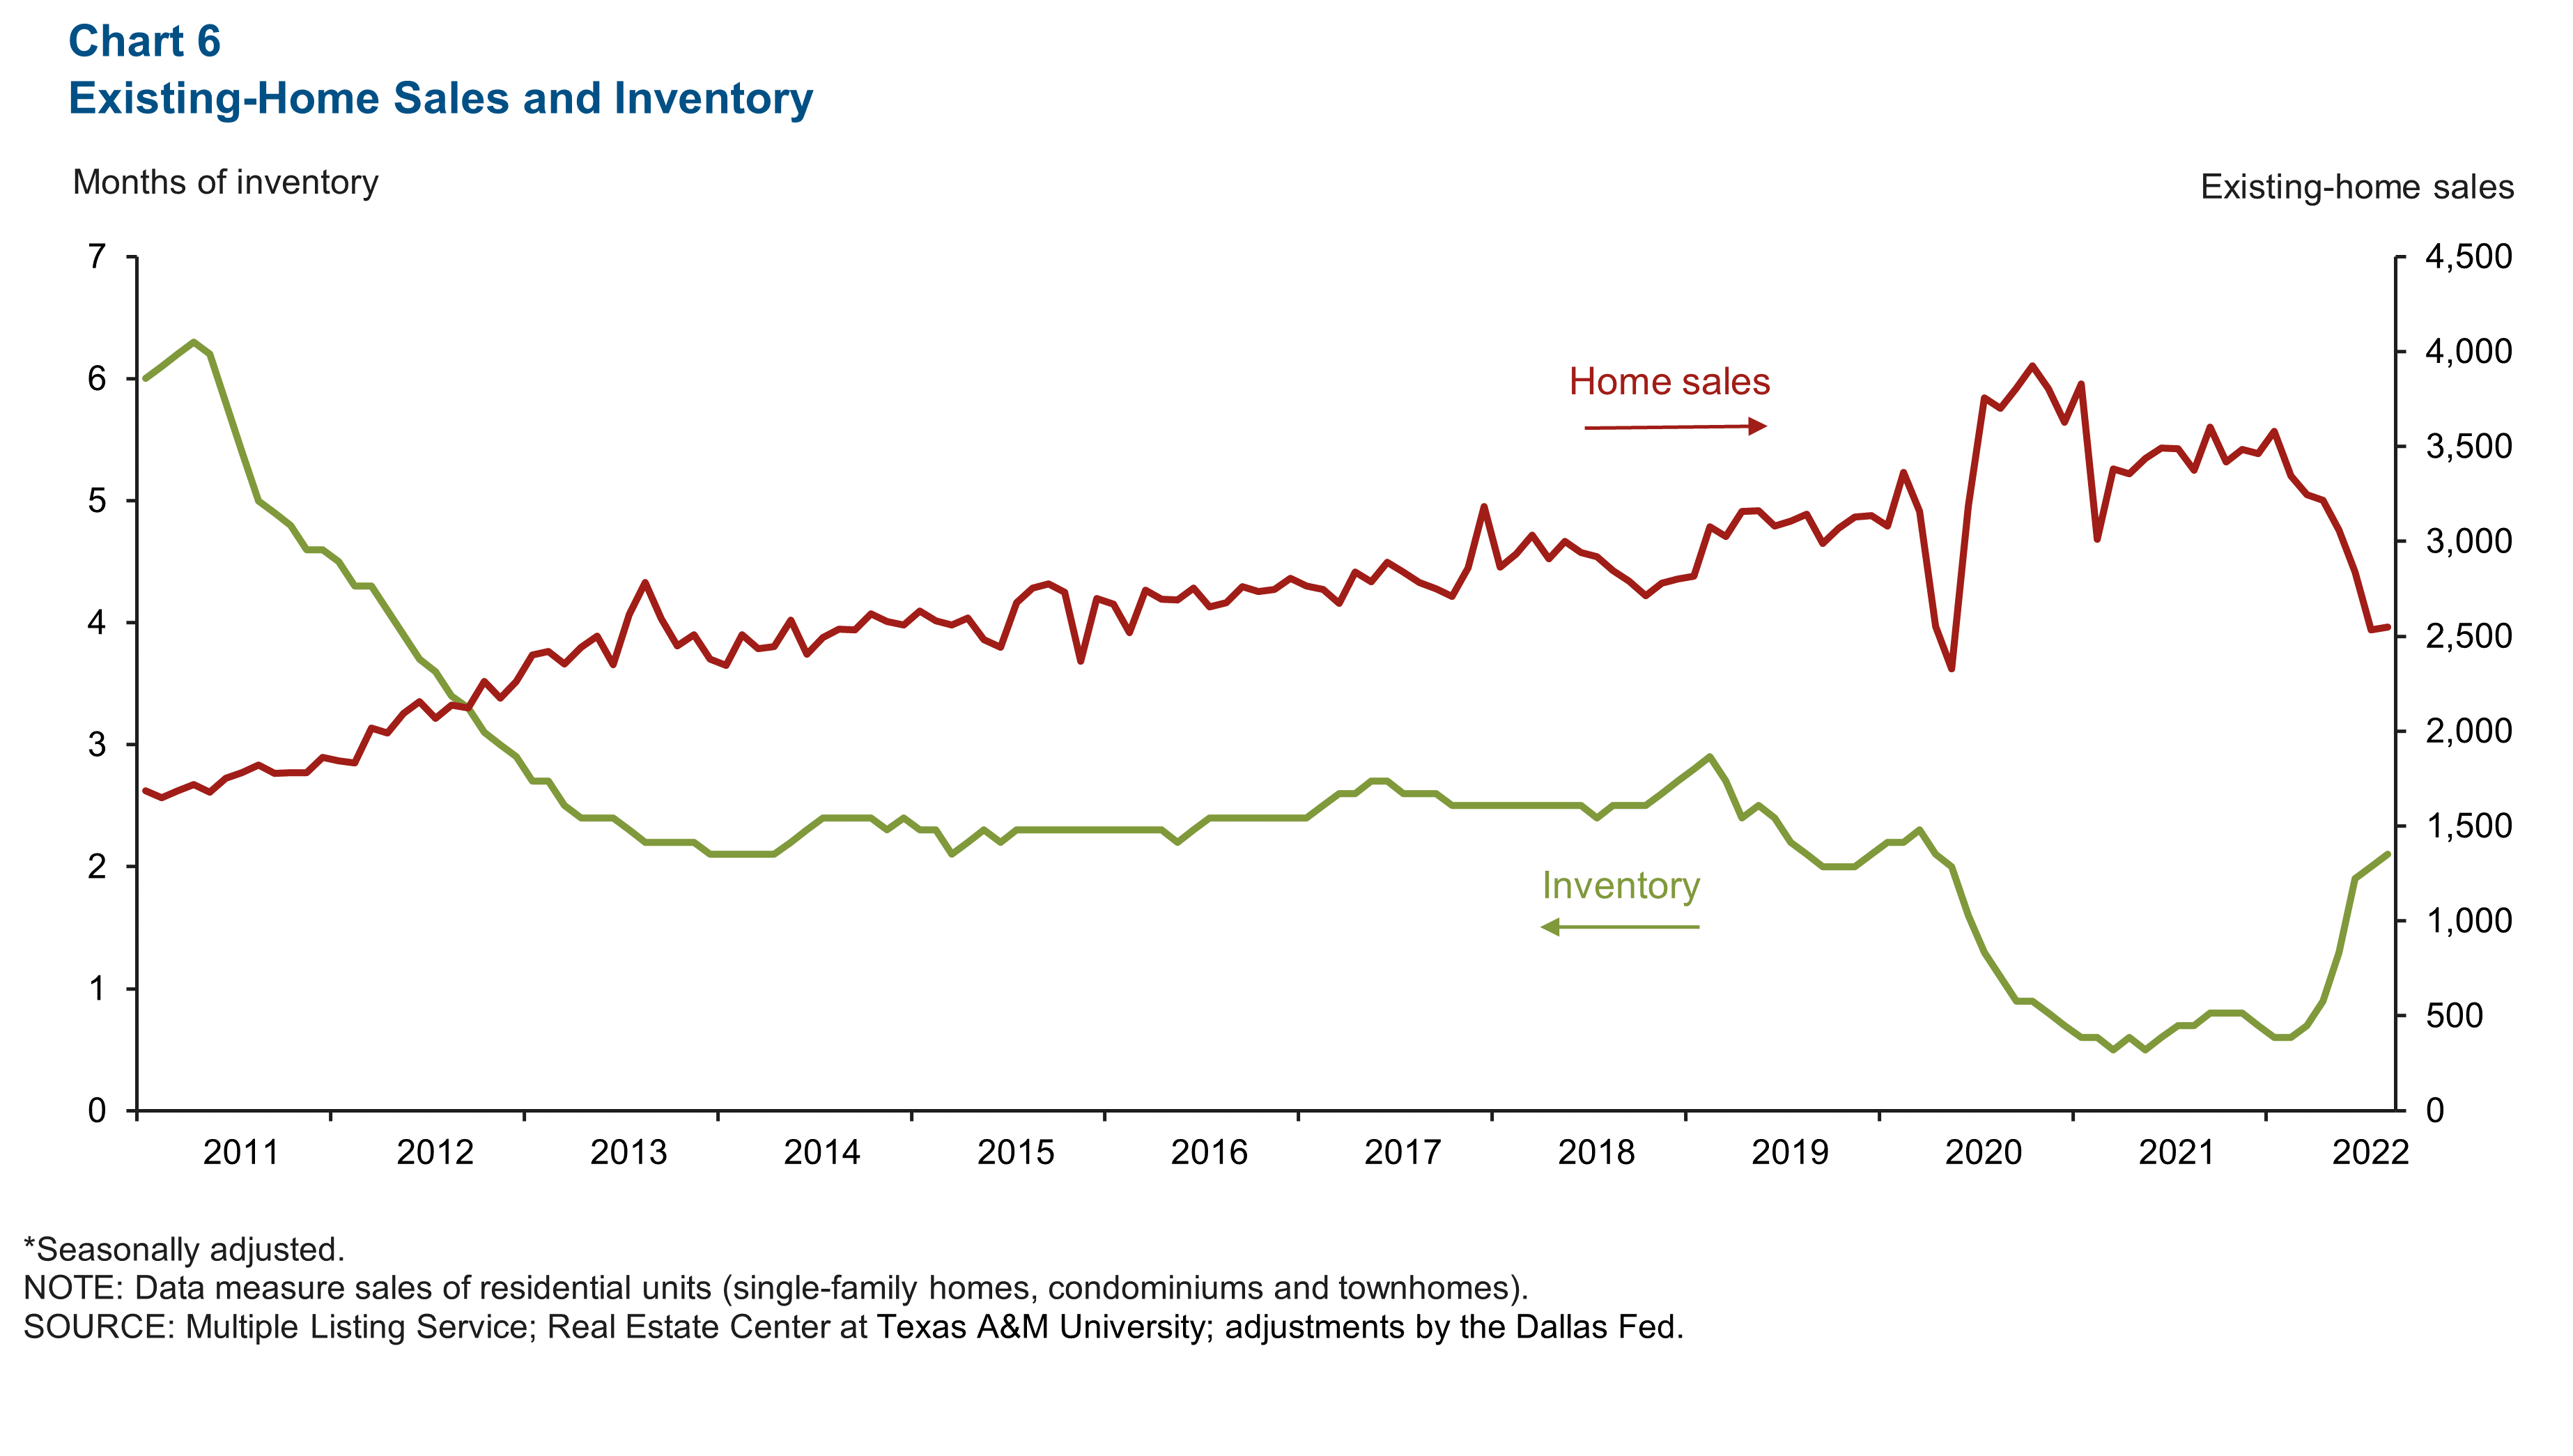
Austin home sales in August remained similar to July’s levels as inventory recovered from historic lows in 2021. Existing-home sales reached 2,547, while inventory increased to 2.1 months (Chart 6). In the past year, as the housing market cooled from 2021 due to rising mortgage rates, existing-home sales declined by 24.5 percent. Austin’s existing-home inventory has tripled since last August but still remains low.
NOTE: Data may not match previously published numbers due to revisions.
About Austin Economic Indicators
Questions or suggestions can be addressed to Vee Kalkunte at Prithvi.Kalkunte@dal.frb.org.
Austin Economic Indicators is released on the first Thursday of every month.