Austin Economic Indicators

March 23, 2023
| Austin economy dashboard (January 2023) | |||
| Job growth (annualized) Nov. '22–Jan. '23 |
Unemployment rate |
Avg. hourly earnings |
Avg. hourly earnings growth y/y |
| 0.2% | 3.0% | $33.44 | 6.1% |
In January, Austin’s employment grew, wages increased and the business-cycle index rose. In contrast, the unemployment rate ticked up, single-family housing permits declined and housing affordability fell.
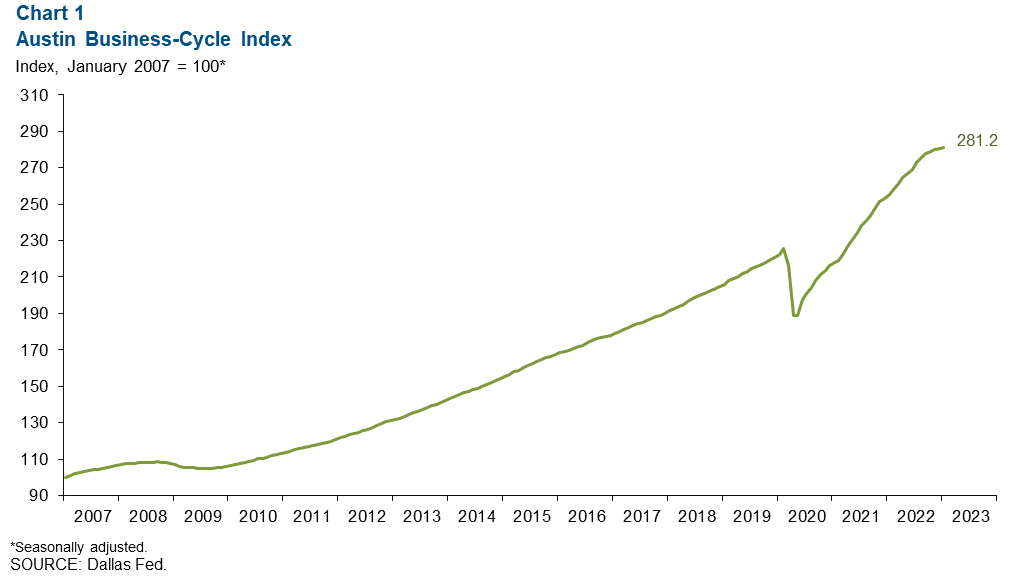
Business-cycle index
The Austin Business-Cycle Index—a broad measure of economic activity—grew an annualized 2.3 percent in January, slightly less than the 2.5 percent rate in December (Chart 1).
Labor market
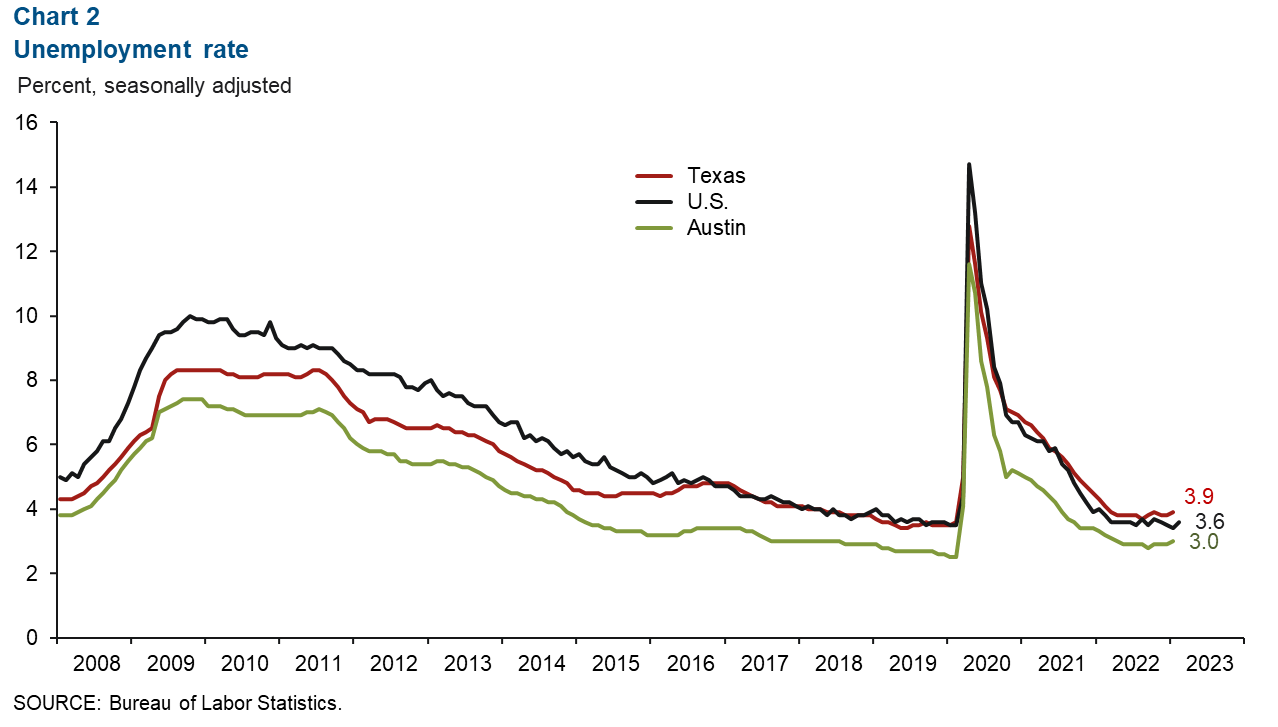
Unemployment rate increases
Austin’s unemployment rate rose to 3.0 percent in January (Chart 2). This is less than the state’s jobless rate of 3.9 percent and the nation’s rate of 3.6 percent. The metro-area labor force increased at an annualized rate of 5.3 percent in January.
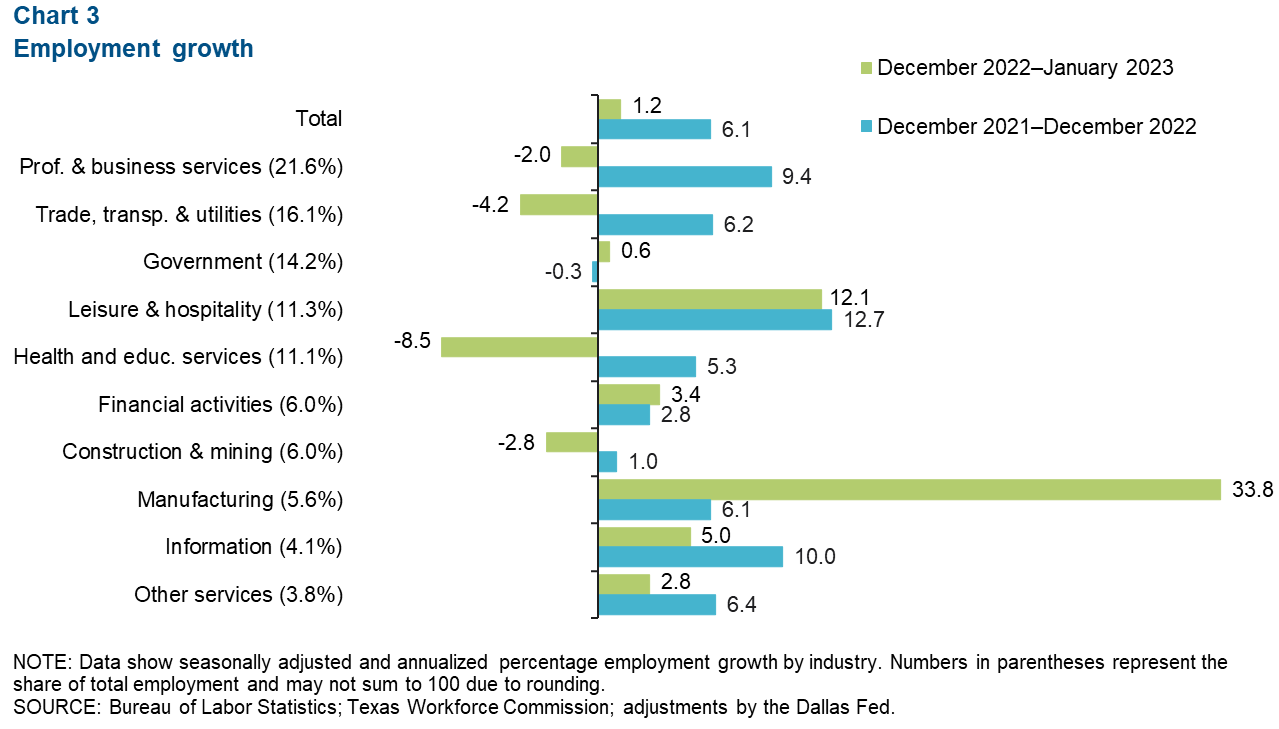
Employment grows in January
Austin employment grew 1.2 percent in January (Chart 3). Sectors with the largest gains were manufacturing (33.8 percent, or 1,762 jobs) and leisure and hospitality (12.1 percent, or 1,404 jobs). Sectors experiencing the biggest declines were health and education services (8.5 percent, or 1,075 jobs) and trade, transportation and utilities (4.2 percent, or 752 jobs).
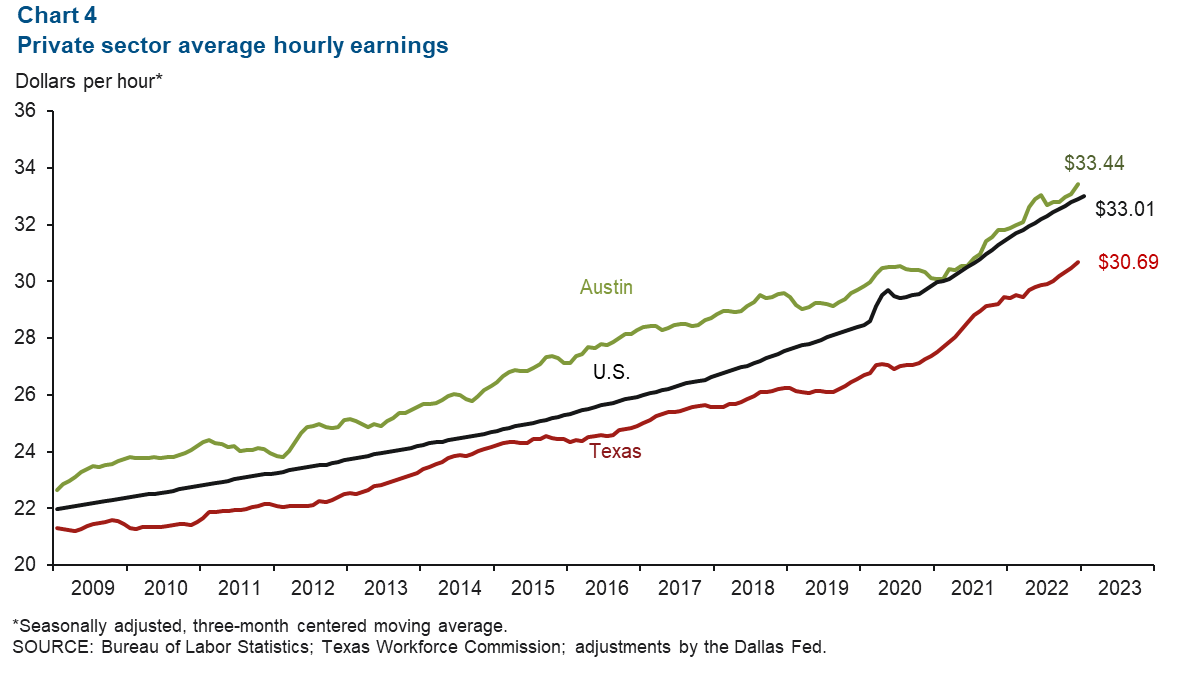
Wages rise in January
Austin wages increased an annualized 13.8 percent in January (Chart 4). The three-month moving average of wages in Austin was $33.44, remaining above the state average of $30.69 and the national average of $33.01. Year over year in January, Austin wages climbed 6.1 percent, more than the state’s 4.0 percent and nation’s 4.4 percent increases.
Housing market
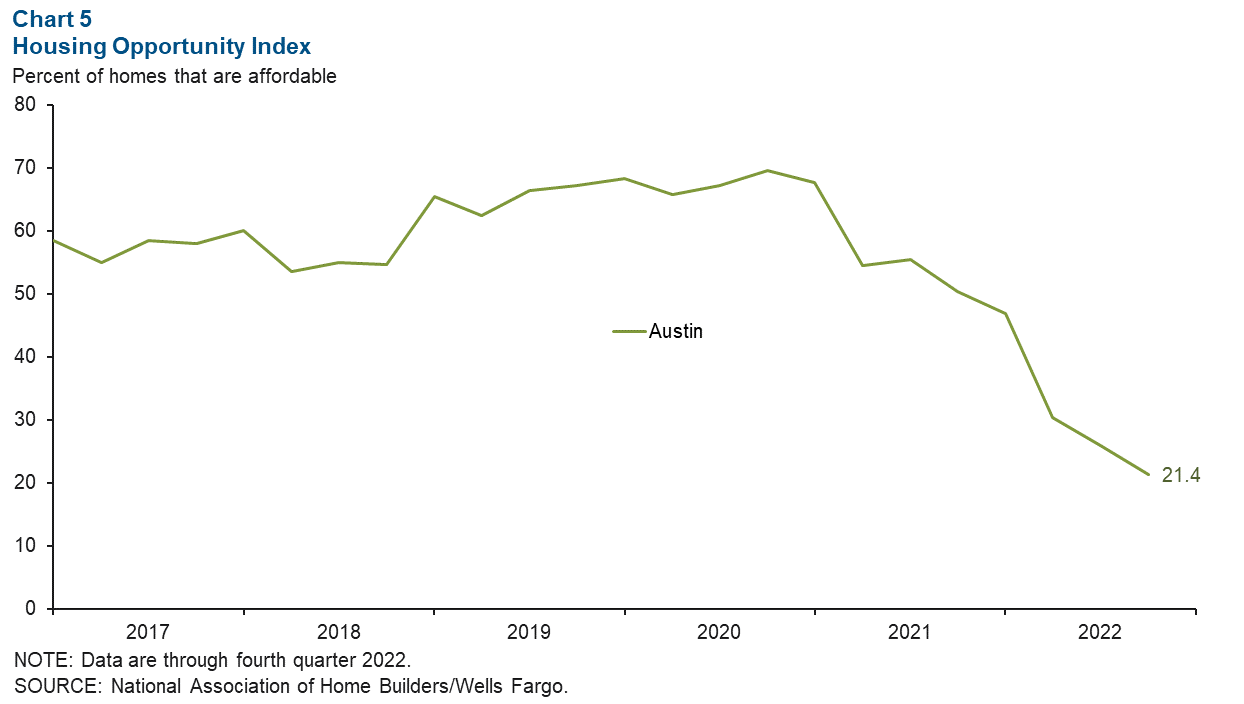
Housing affordability declines further
In fourth quarter 2022, the Austin metro’s Housing Opportunity Index dropped 4.6 percent to 21.4 percent (Chart 5). The index, which reflects the percentage of homes sold that are affordable to the median-income earner in Austin, sank 28.9 percent overall in 2022. This is indicative of higher home prices and higher mortgage rates.
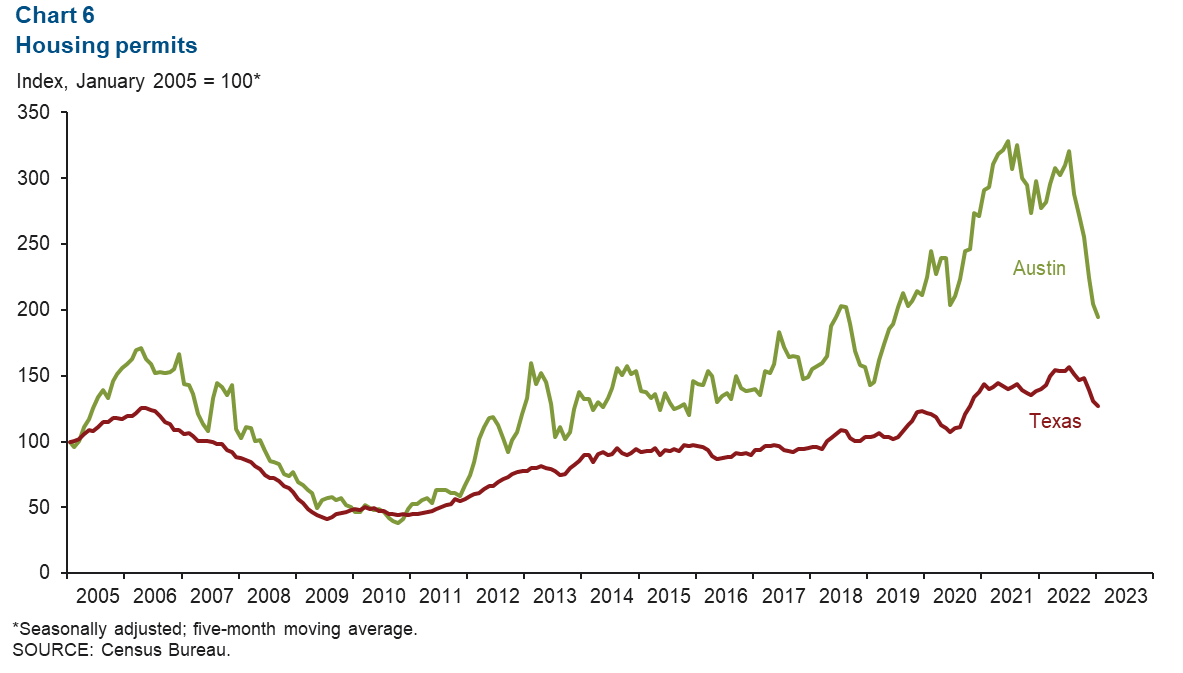
Housing permits fall below May 2020 levels
Austin’s single-family home permits plummeted an annualized 96.1 percent in January (Chart 6). That followed a decrease of 52.6 percent in 2022, most of it in the fourth quarter. Texas saw permits decline an annualized 41.8 percent in January.
NOTE: Data may not match previously published numbers due to revisions.
About Austin Economic Indicators
Questions or suggestions can be addressed to Vee Kalkunte at Prithvi.Kalkunte@dal.frb.org.
Austin Economic Indicators is released on the first Thursday of every month.