Austin Economic Indicators

June 2, 2023
| Austin economy dashboard (April 2023) | |||
| Job growth (annualized) Jan.–April '23 |
Unemployment rate |
Avg. hourly earnings |
Avg. hourly earnings growth y/y |
| 5.2% | 3.1% | $33.42 | 1.6% |
Austin’s payoll jobs registered strong growth in April as nearly every sector saw gains. Unemployment declined, but wages decreased. WARN notices, or layoffs, continue to rise. The data suggest some weakening in the labor market, particularly in the high-tech services sector.
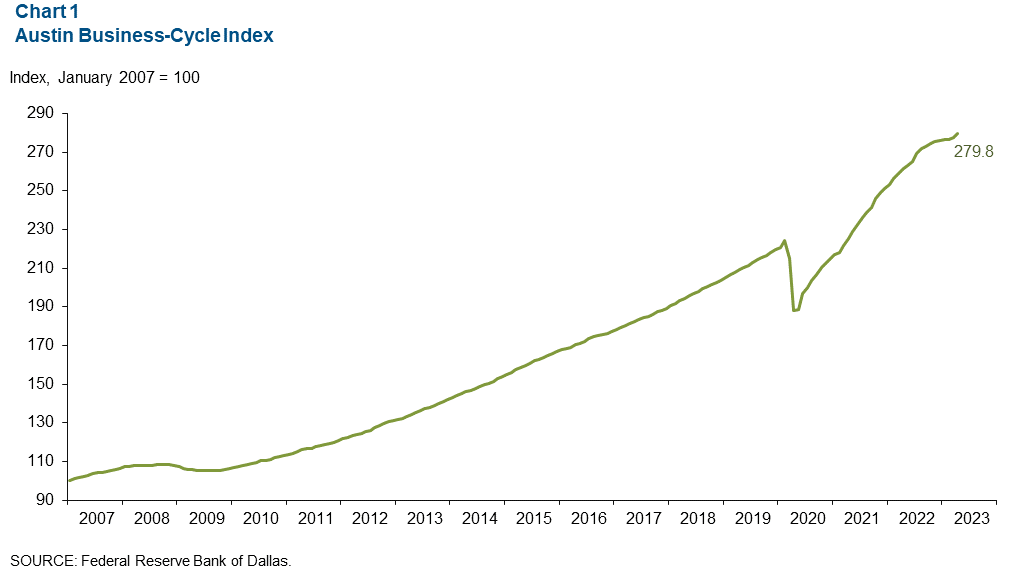
Business-cycle index
The Austin Business-Cycle Index—a broad measure of economic activity—grew at an annualized 10.4 percent rate in April, greater than the 4.2 percent rate in March (Chart 1).
Labor market
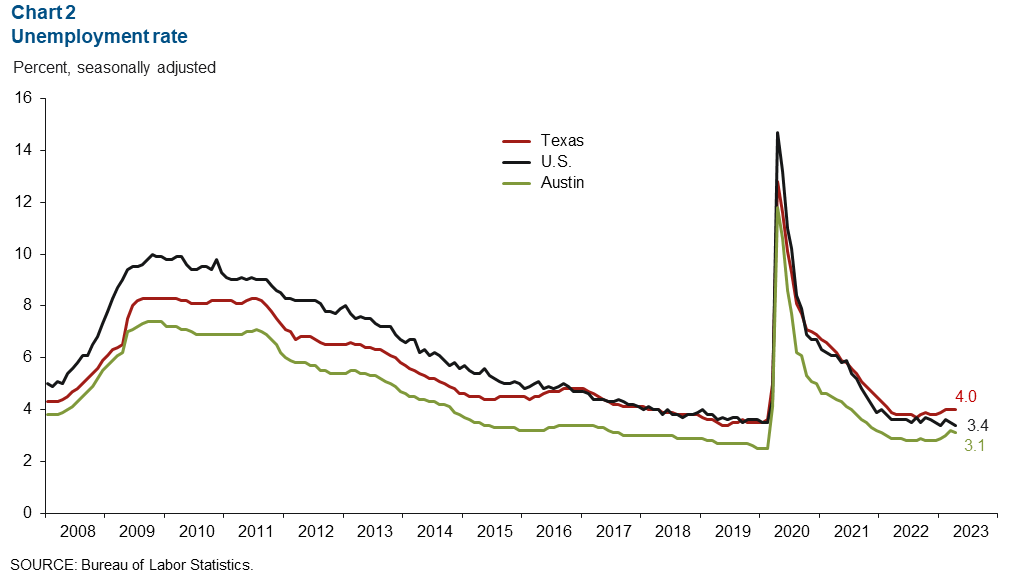
Unemployment rate declines
Austin’s unemployment rate decreased to 3.1 percent in April, below the state’s rate of 4.0 percent and the nation’s rate of 3.4 percent (Chart 2). In April, the local labor force grew an annualized 0.2 percent.
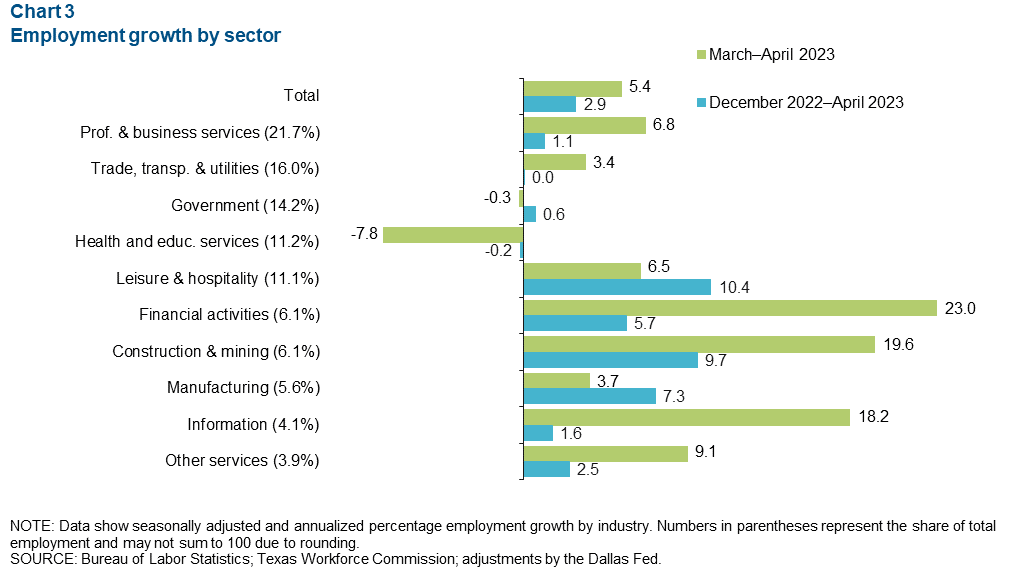
Austin employment expands
Austin employment increased 5.4 percent in April (Chart 3). The sectors with the greatest improvements were financial activities (23.0 percent, or 1,363 jobs), construction and mining (19.6 percent, or 1,194 jobs) and information (18.2 percent, or 774 jobs). Sectors with declines were health and education (7.8 percent, or 996 jobs) and government (0.3 percent, or 41 jobs). Year to date, Austin’s payroll employment has grown 2.9 percent, less than Texas’ 3.6 percent increase but more than the nation’s 2.2 percent rise.
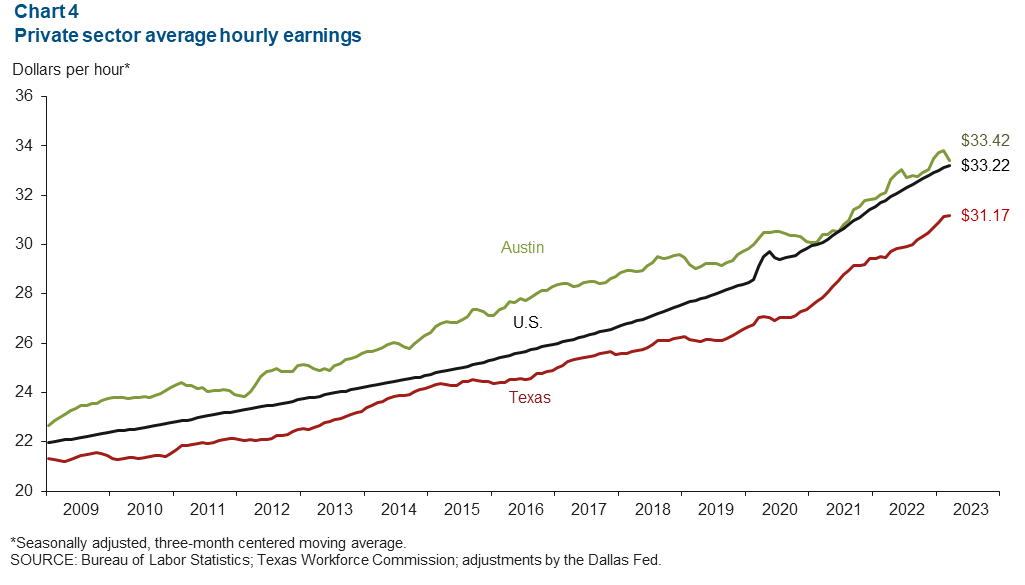
Wages slip in April
The three-month moving average of Austin wages declined an annualized 13.6 percent in April (Chart 4). Austin’s hourly earnings of $33.42 were still above the state average of $31.17 and the national average of $33.22. In the past year, Austin wages have risen 1.6 percent versus 5.0 percent for the state and 4.4 percent for the nation.
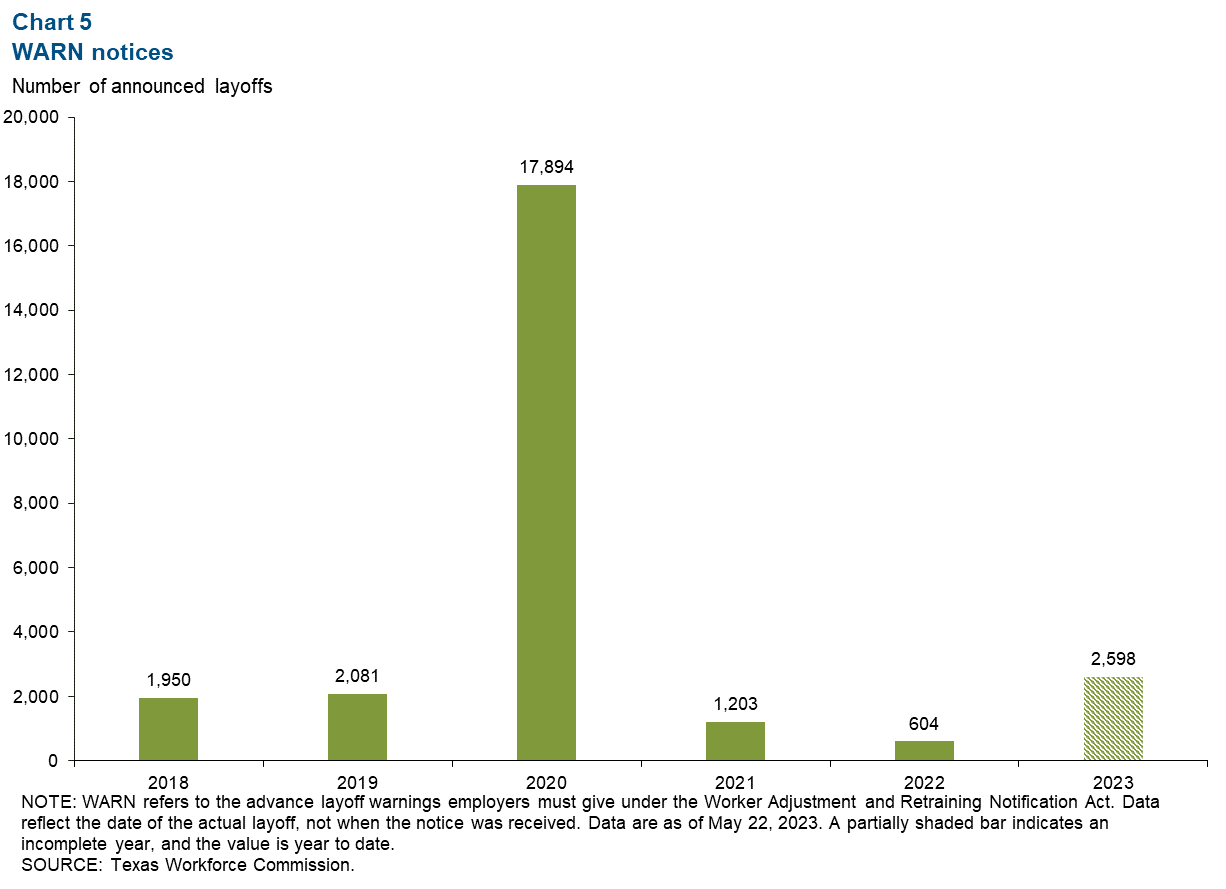
Layoffs in 2023 outpace 2012–19 average
As of May 22, 2,598 employees had received layoff notices in the Austin metropolitan statistical area this year (Chart 5). This is greater than the announced layoffs each of the prior two years and the average number from 2012 to 2019 of about 2,122 workers per year. Still, the amount remains well below the historic layoffs seen during 2020. The sector with the largest layoffs this year has been high-tech-related professional, scientific and technical services.
NOTE: Data may not match previously published numbers due to revisions.
About Austin Economic Indicators
Questions or suggestions can be addressed to Vee Kalkunte at Prithvi.Kalkunte@dal.frb.org.
Austin Economic Indicators is released on the first Thursday of every month.