Austin Economic Indicators

September 7, 2023
| Austin economy dashboard (July 2023) | |||
| Job growth (annualized) April–July '23 |
Unemployment rate |
Avg. hourly earnings |
Avg. hourly earnings growth y/y |
| 4.4% | 3.5% | $33.70 | 4.3% |
In July, the Austin economy experienced job growth as most sectors expanded. In addition, the business-cycle index ticked up. Similarly, consumer demand, as measured by retail sales tax revenue and credit card spending, remained stronger in the metro than at the state level.
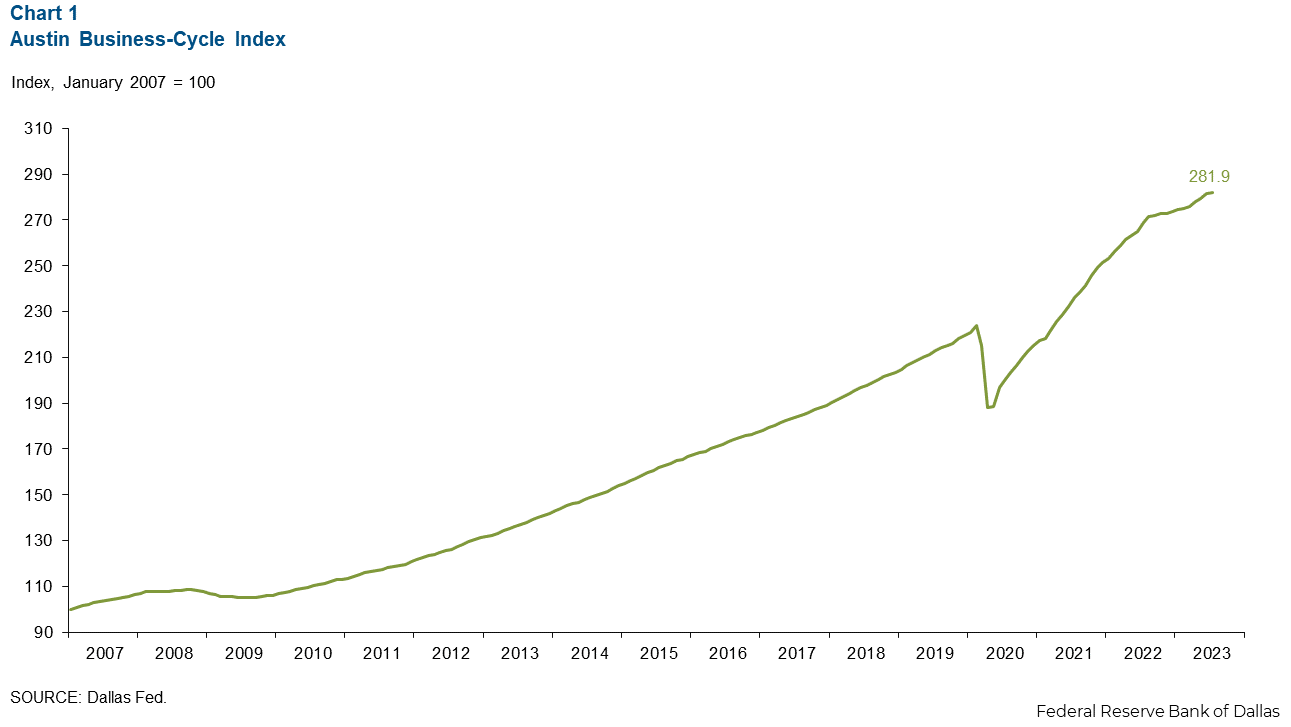
Business-cycle index
The Austin Business-Cycle Index, a broad measure of economic activity, grew an annualized 2.1 percent in July, greater than the 9.5 percent gain in June (Chart 1).
Labor market
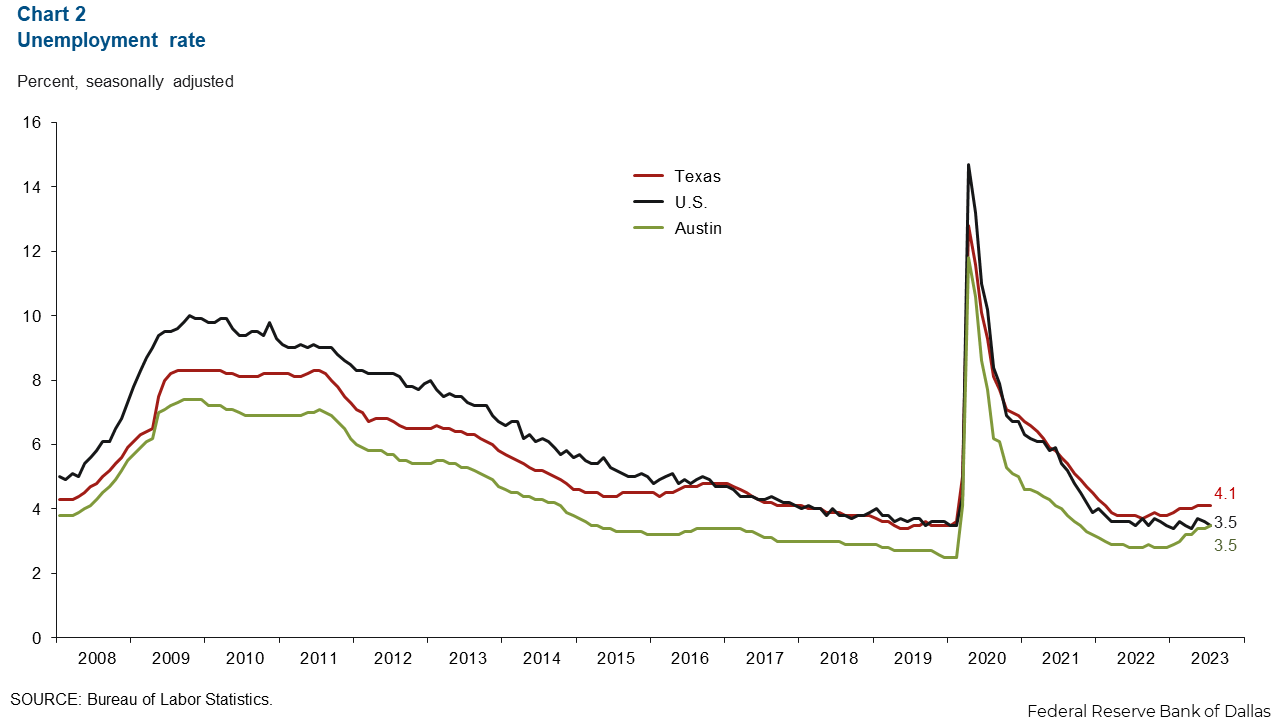
Unemployment increases to national level
Austin’s unemployment rate increased to 3.5 percent in July and remained below the state rate of 4.1 percent. However, Austin’s rate now matches the national rate of 3.5 percent (Chart 2). In July, the local labor force increased an annualized 4.1 percent.
Employment continues to expand
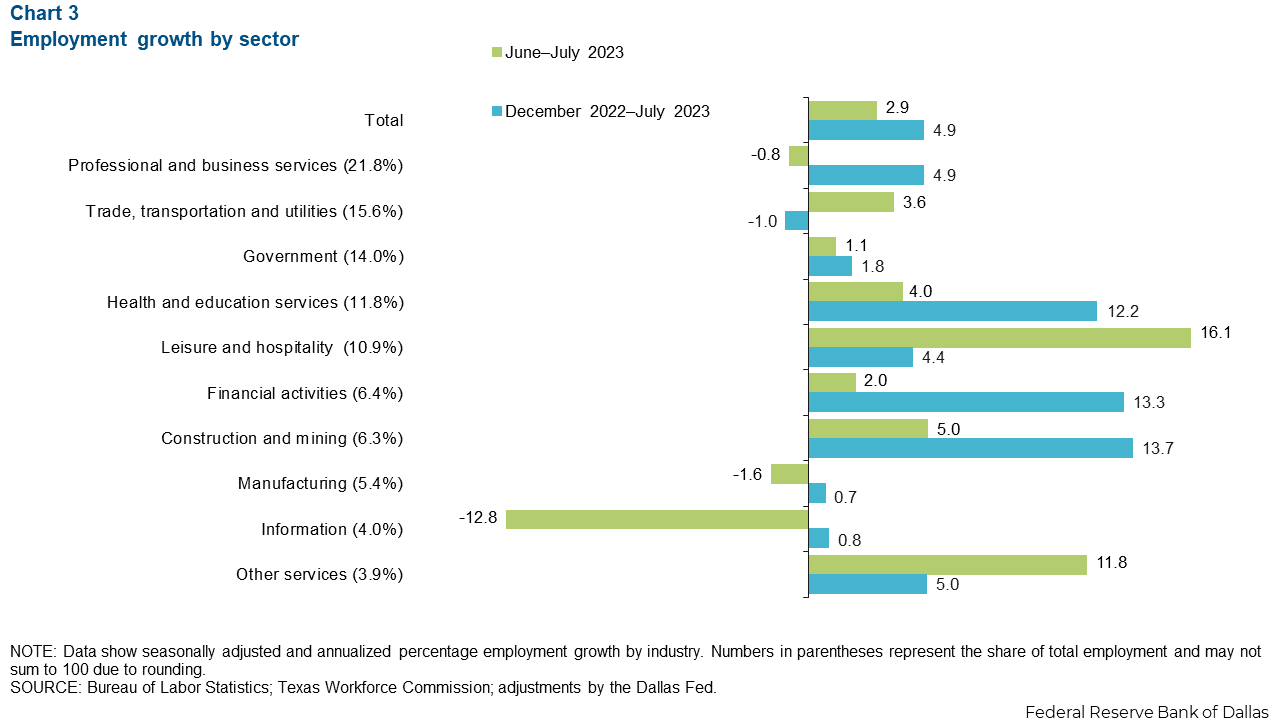
Austin employment increased 2.9 percent in July, slower than June’s 6.3 percent rise. Sectors with the greatest gains were leisure and hospitality (16.1 percent, or 1,796 jobs) and other services (11.8 percent, or 475 jobs). The sector that experienced the most decline in July was information (12.8 percent, or 613 jobs) (Chart 3). Year to date, Austin’s payroll employment has grown 2.9 percent.
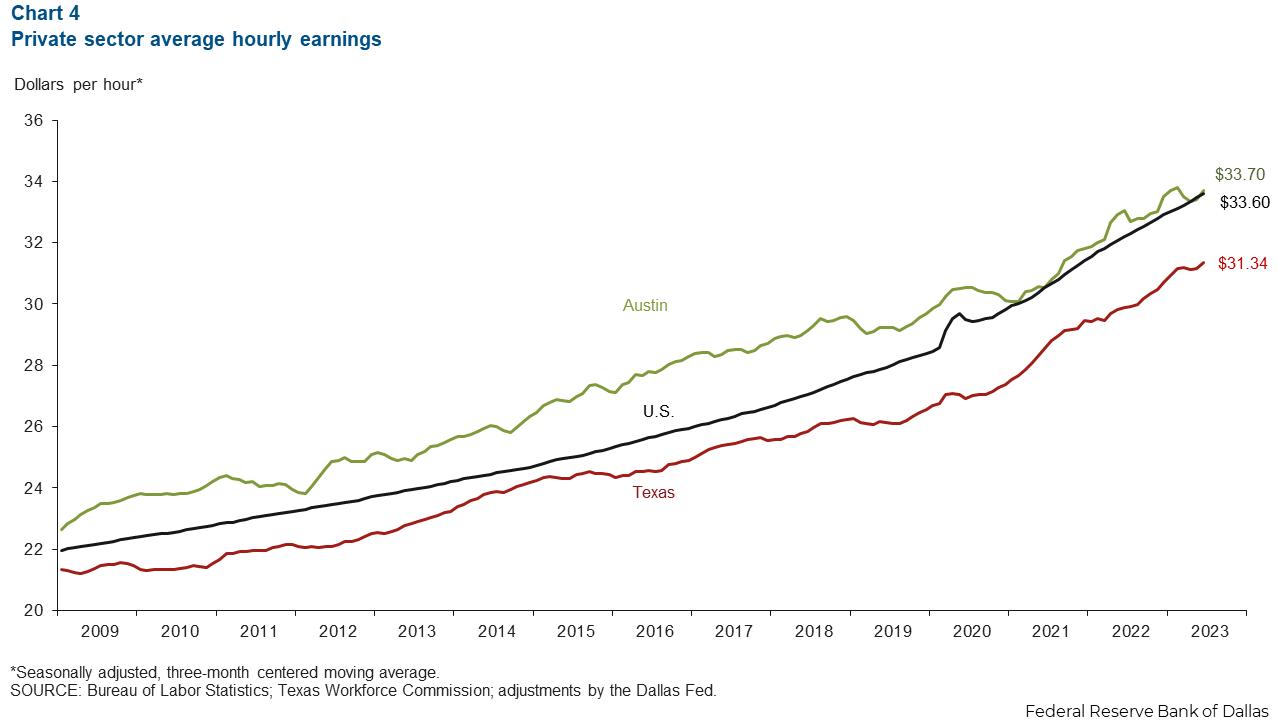
Austin wages rebound above national average
The three-month moving average of Austin wages increased 11.5 percent in July (Chart 4). The average hourly wage of $33.70 remains above the nation’s average ($33.60) and the state’s ($31.34). Year over year, Austin wage growth of 4.3 percent is slower than U.S. gains of 4.4 percent and Texas growth of 6.5 percent.
Spending patterns
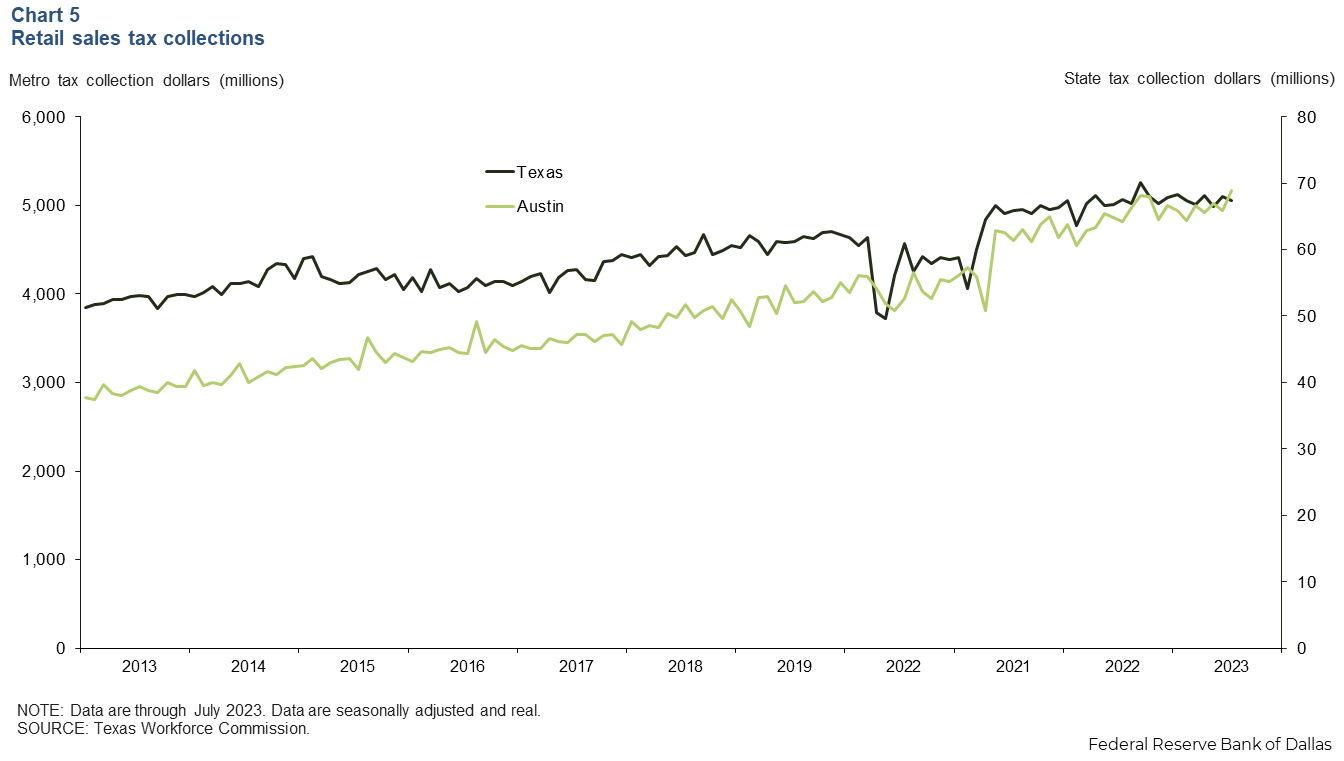
Metro retail sales tax collections remain above state collections
In July, Austin’s real inflation-adjusted retail sales tax collections increased 4.6 percent, outpacing the state’s collections, which declined 0.9 percent (Chart 5). Year over year, the metro retail sales tax collections rose 7.5 percent, contrasting Texas’ collections, which fell 0.2 percent. This implies retail spending demand in the Austin area remains at elevated levels.
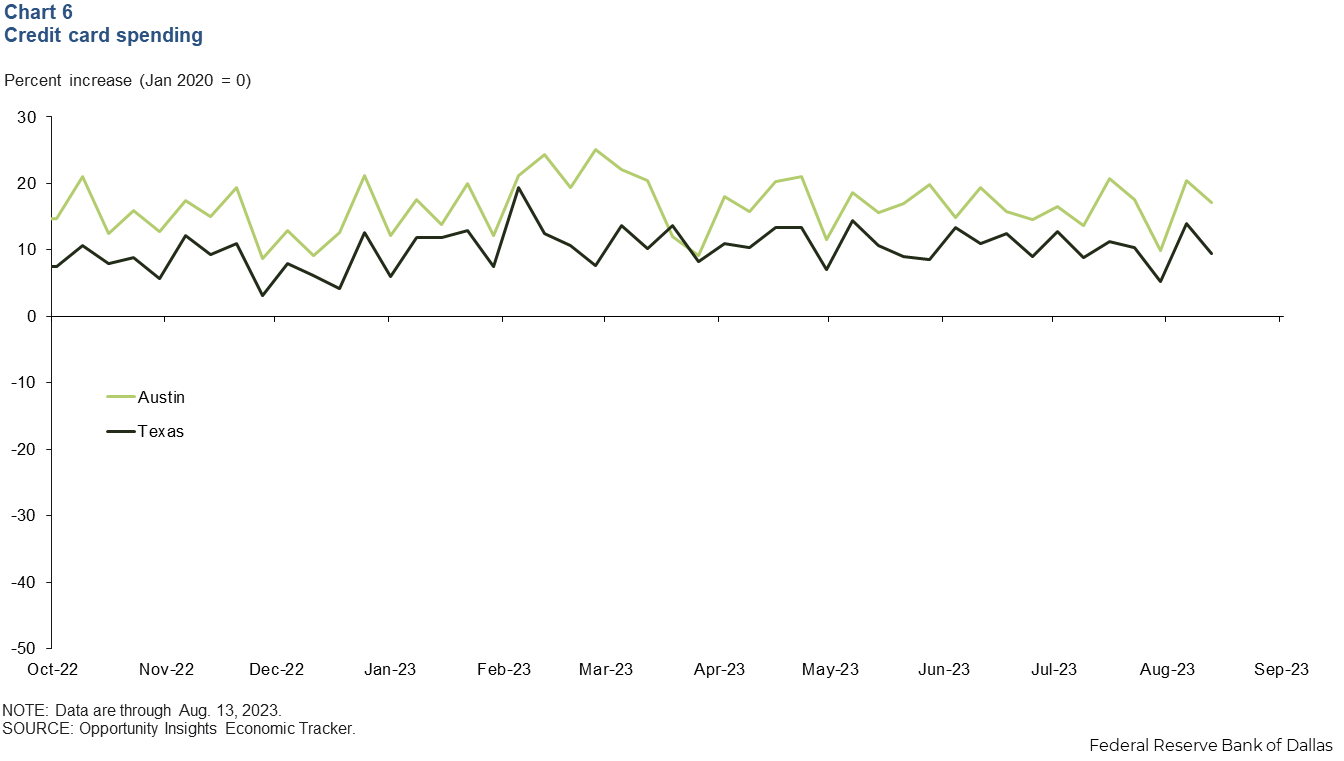
Credit card spending remains above prepandemic levels
Credit card spending, a proxy for overall consumer demand and spending power, remains elevated, up 17.1 percent in Austin since January 2020 (Chart 6). This is greater than the state’s performance, up 9.4 percent from prepandemic levels. However, the year-over-year increases are largely smaller, with less fluctuation. Austin’s spending has only increased 0.8 percent compared with last year, with Texas similarly experiencing a 1.1 percent increase.
NOTE: Data may not match previously published numbers due to revisions.
About Austin Economic Indicators
Questions or suggestions can be addressed to Vee Kalkunte at Prithvi.Kalkunte@dal.frb.org.
Austin Economic Indicators is released on the first Thursday of every month.