Austin Economic Indicators

| Austin economy dashboard (December 2023) | |||
| Job growth (annualized) Oct.–Dec. '23 |
Unemployment rate |
Avg. hourly earnings |
Avg. hourly earnings growth y/y |
| -0.1% | 3.6% | $34.47 | 3.5% |
Austin lost jobs in December as layoffs in the high-tech sector continued, and the unemployment rate increased. Rent prices stabilized, and home inventories increased.
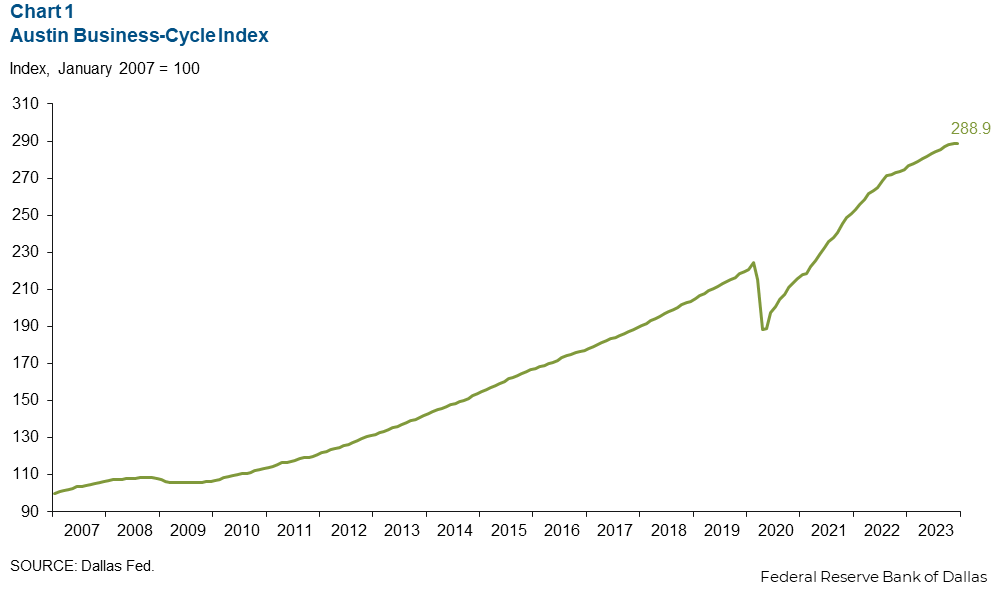
Business-cycle index
The Austin Business-Cycle Index, a broad measure of economic activity, grew an annualized 0.7 percent in December, slower than the 3.4 percent gain in November (Chart 1).
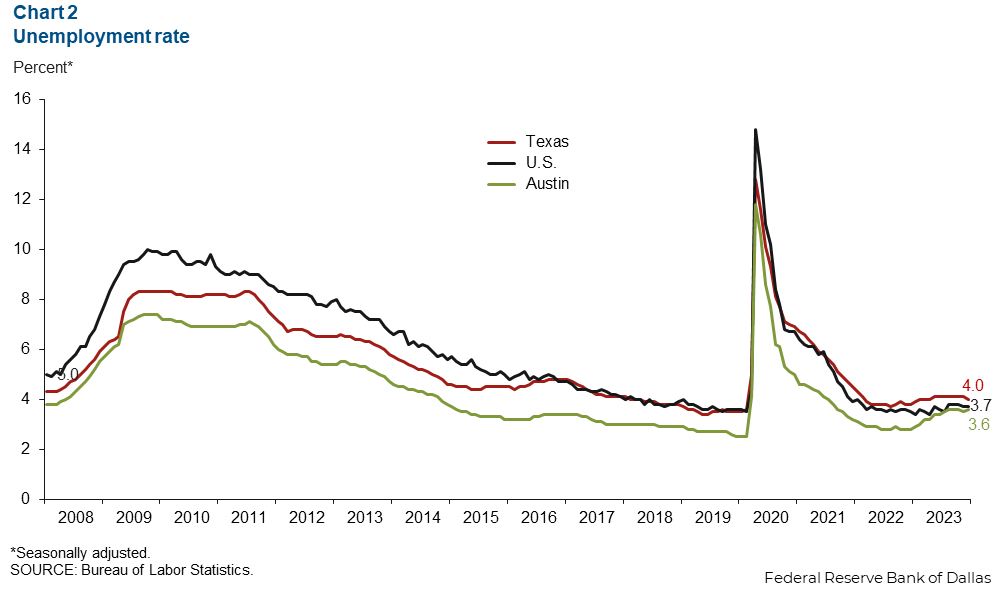
Labor market
Unemployment rate increases
Austin’s unemployment rate rose to 3.6 percent, remaining below the state’s rate of 4.0 percent and the nation’s rate of 3.7 percent (Chart 2). In December, the local labor force decreased an annualized 4.1 percent, while the state’s increased 0.9 percent and the nation’s fell 4.7 percent.
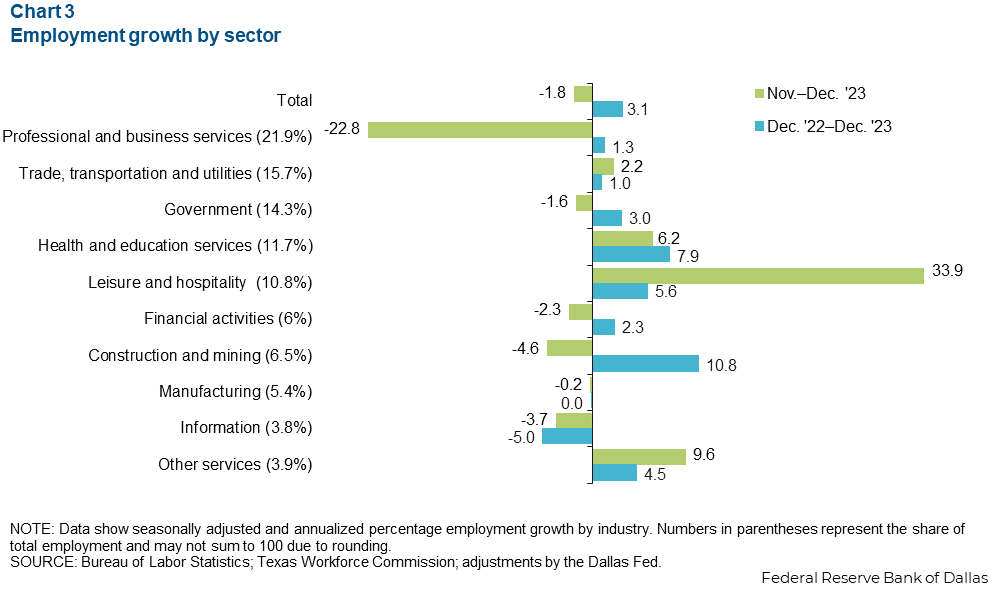
Employment falls
Austin employment decreased 1.8 percent in December after increasing 1.0 percent in November (Chart 3). Sectors with the most growth were leisure and hospitality (3,561 jobs), education and health services (789 jobs), and other services (396 jobs). Sectors that saw a decline included professional and business services (-6,235 jobs) and construction and mining (-336 jobs). In 2023, Austin’s payrolls expanded 3.1 percent, falling behind the state’s 3.4 percent growth but surpassing the nation’s 1.7 percent.
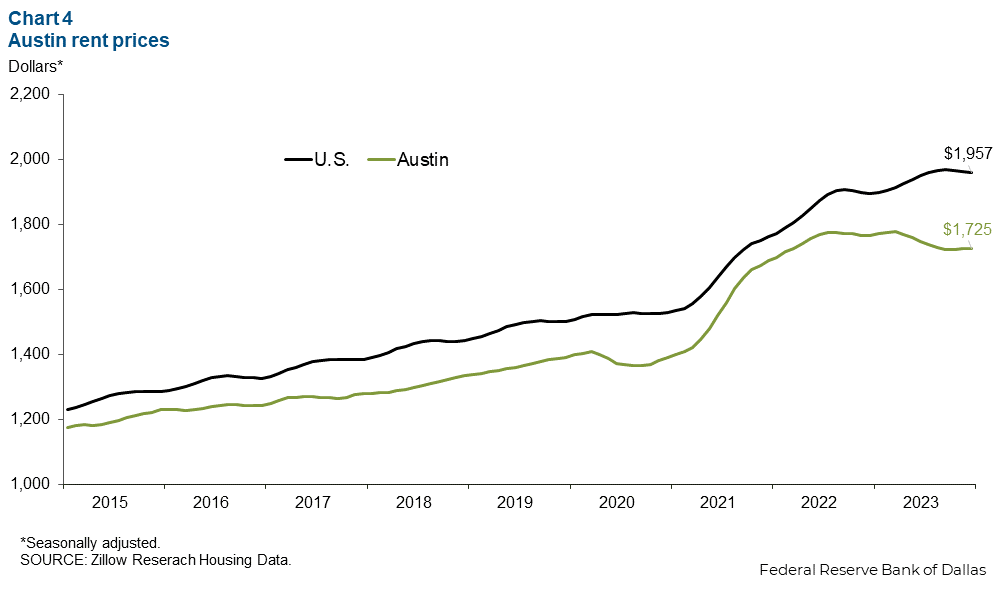
Housing
Rent prices stay flat
Austin asking rent prices didn’t change in December, reaching a mean price of $1,725 (Chart 4). In 2023, Austin saw an overall decline of 2.2 percent in mean rent prices, less than the nation’s gain of 3.3 percent.
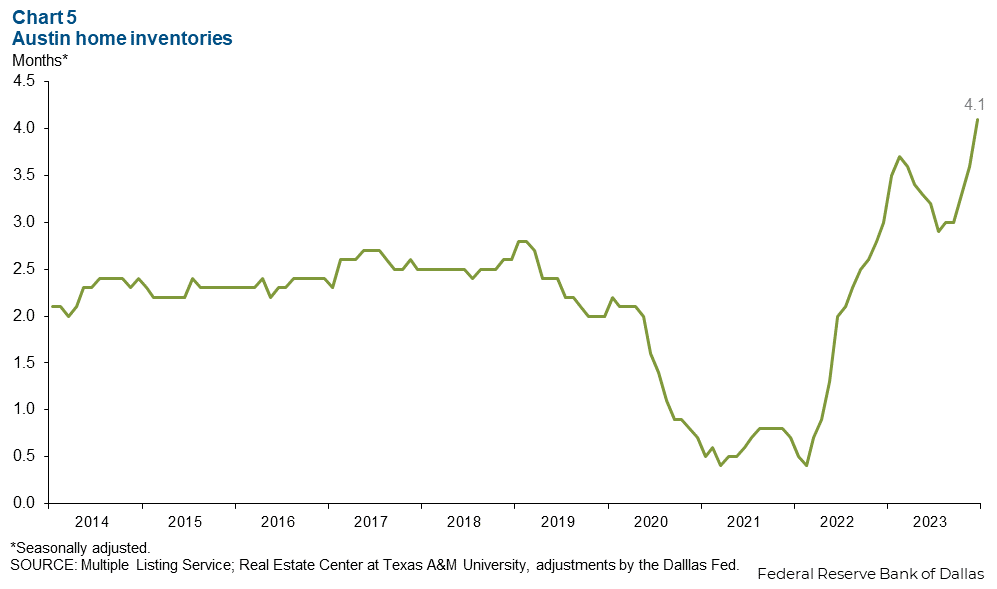
Home inventories rise
Austin home inventories continued to rise in December, increasing to 4.1 months, which is higher than 3.6 months for both the state and the nation (Chart 5). However, months of inventory remained below six months, which is considered a balanced housing market. A year ago, home inventory levels in Austin were 3.0 months, while they were 2.7 months in Texas and 3.3 months in the U.S.
NOTE: Data may not match previously published numbers due to revisions.
About Austin Economic Indicators
Questions or suggestions can be addressed to Isabel Dhillon at Isabel.Dhillon@dal.frb.org.
Austin Economic Indicators is released on the first Thursday of every month.