Austin Economic Indicators

| Austin economy dashboard (May 2024) | |||
| Job growth (annualized) Feb.–May '24 |
Unemployment rate |
Avg. hourly earnings |
Avg. hourly earnings growth y/y |
| 1.3% | 3.4% | $34.53 | 3.8% |
Austin employment growth slowed in May, the unemployment rate remained the same, and wages increased. The median house price was unchanged, and home inventories fell.
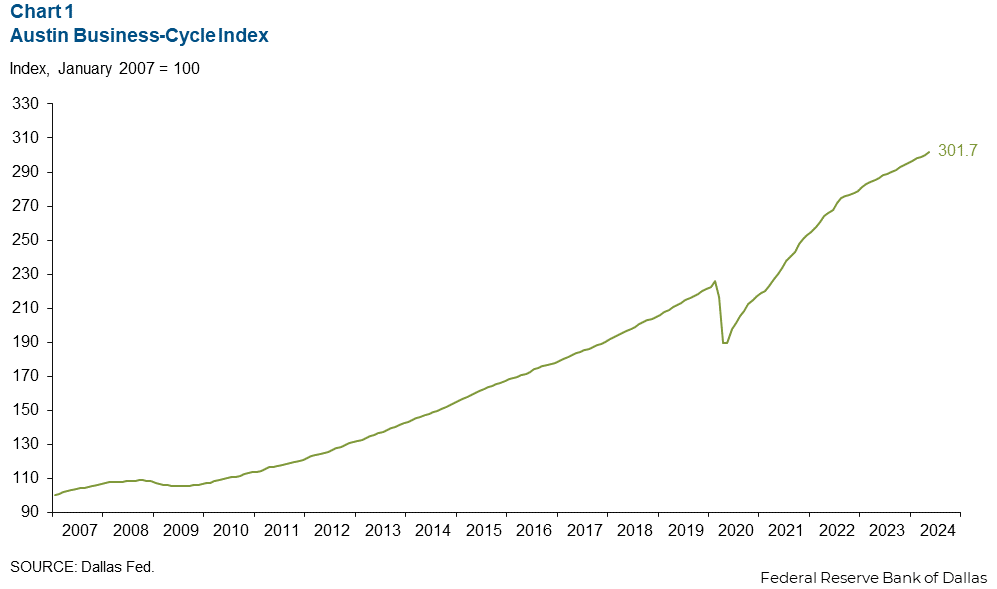
Business-cycle index
The Austin Business-Cycle Index, a broad measure of economic activity, grew an annualized 8.0 percent in May, faster than the 4.3 percent gain in April (Chart 1).
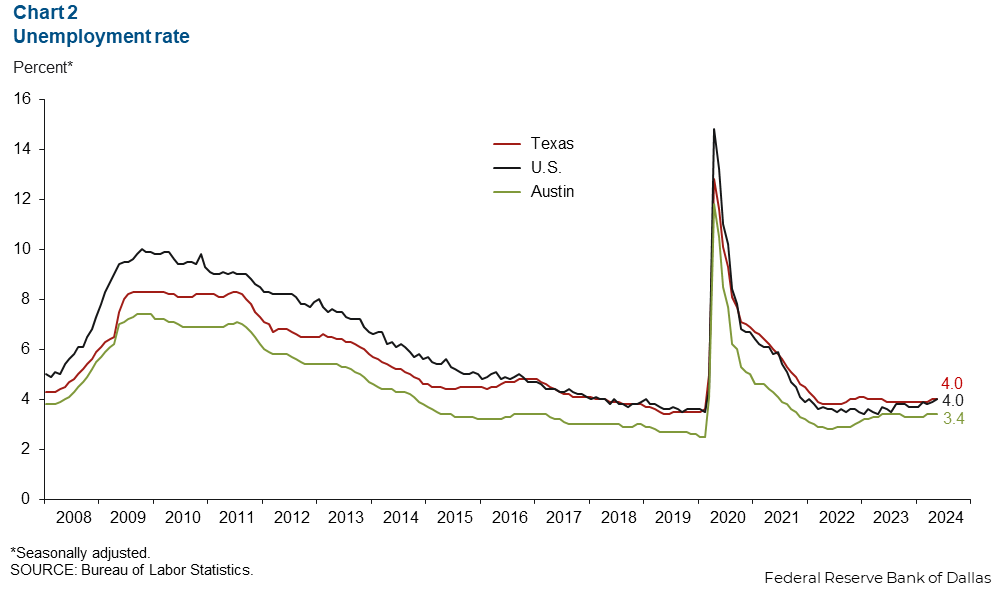
Labor market
Unemployment rate stabilizes
Austin’s unemployment rate stayed at 3.4 percent in May, remaining below the state’s and nation’s rates of 4.0 percent (Chart 2). In May, the local labor force increased an annualized 2.3 percent, while the state’s increased 2.9 percent, and the nation’s fell 1.8 percent.
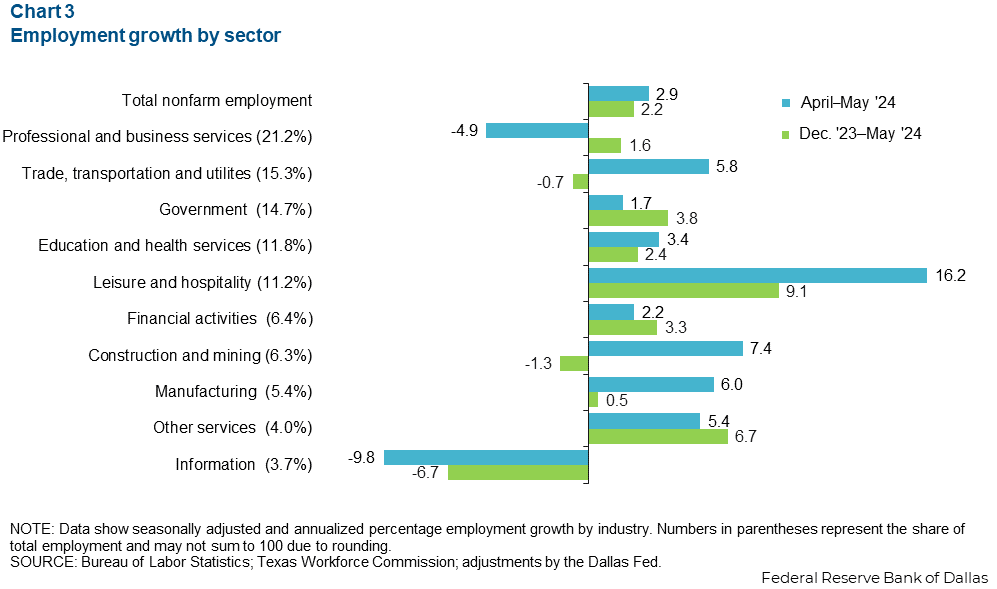
Employment growth slows
Austin employment grew 2.9 percent in May after increasing 3.4 percent in April (Chart 3). Sectors with the most growth were leisure and hospitality (1,916 jobs) and trade, transportation and utilities (974 jobs). Sectors that saw a decline included professional and business services (-1,198 jobs) and information (-429 jobs). Year to date, Austin employment growth was 2.2 percent, below the state’s 2.8 percent gains and above the nation’s 1.9 percent increase.
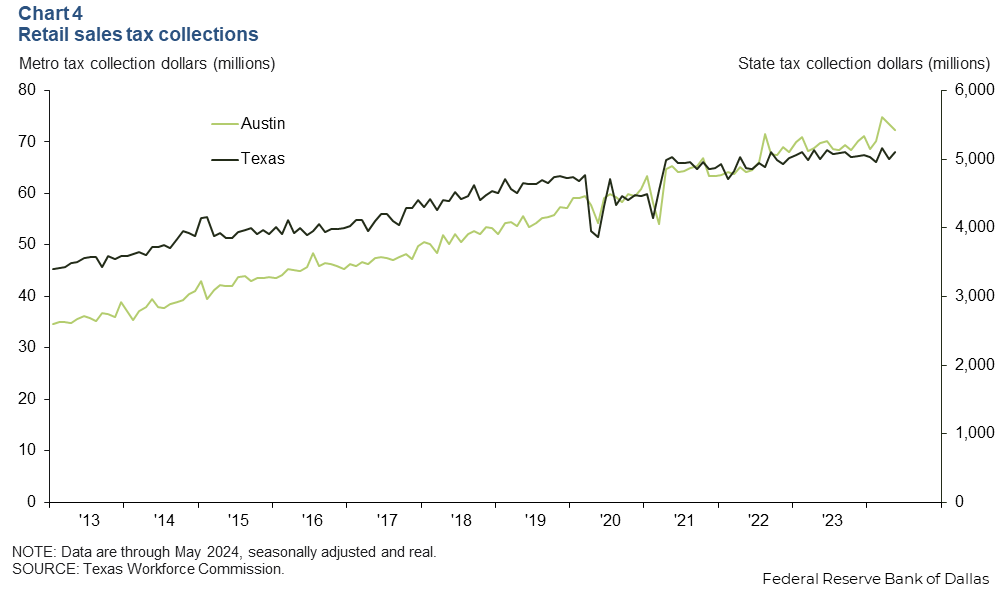
Metro retail sales tax collections
In May, Austin’s real inflation-adjusted retail sales tax collections decreased 1.6 percent, while the state’s collections grew 1.8 percent (Chart 4). Year over year, the metro retail sales tax collections rose 3.6 percent, contrasting Texas’ collections, which grew 2.1 percent. Prior solid monthly gains and the annual increases in May imply retail spending demand in the Austin area remains at elevated levels.
Housing
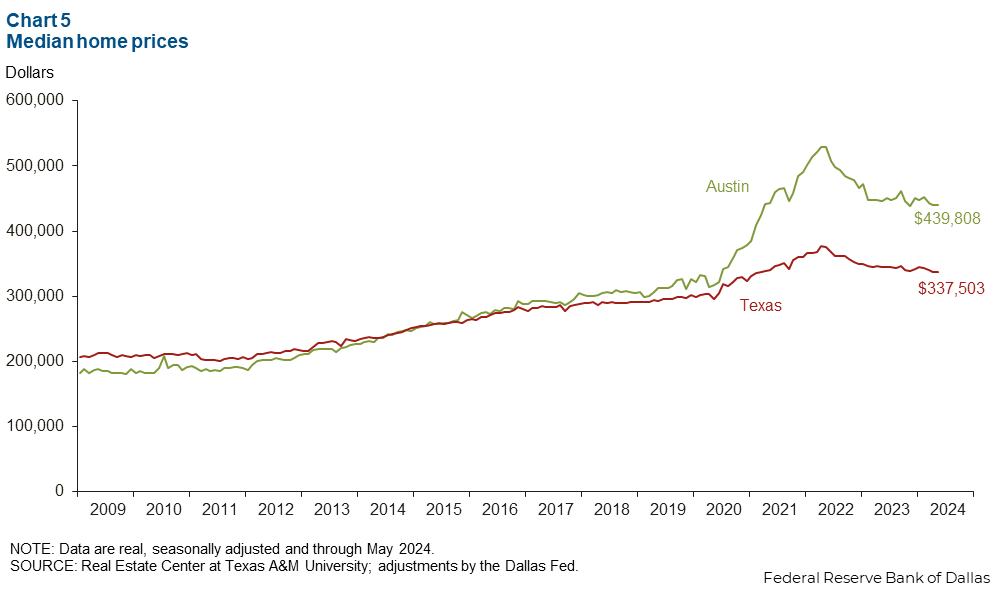
Austin’s median home price was flat in May (Chart 5). Texas home prices were also unchanged. Median home prices in May were $439,808 in Austin and $337,503 in Texas. Year over year, home prices trended down—falling 1.5 percent in the metro and 2.3 percent in the state.
NOTE: Data may not match previously published numbers due to revisions.
About Austin Economic Indicators
Questions or suggestions can be addressed to Isabel Dhillon at Isabel.Dhillon@dal.frb.org.
Austin Economic Indicators is released on the first Thursday of every month.