Austin Economic Indicators

| Austin economy dashboard (August 2024) | |||
| Job growth (annualized) May–Aug. '24 |
Unemployment rate |
Avg. hourly earnings |
Avg. hourly earnings growth y/y |
| 0.4% | 3.4% | $34.65 | 2.8% |
Austin experienced strong employment growth in August, accompanied by a stable unemployment rate. Home prices and the months’ supply of inventory ticked down. Both downtown and suburban office vacancies increased, with downtown vacancies rising above the Texas metro average.
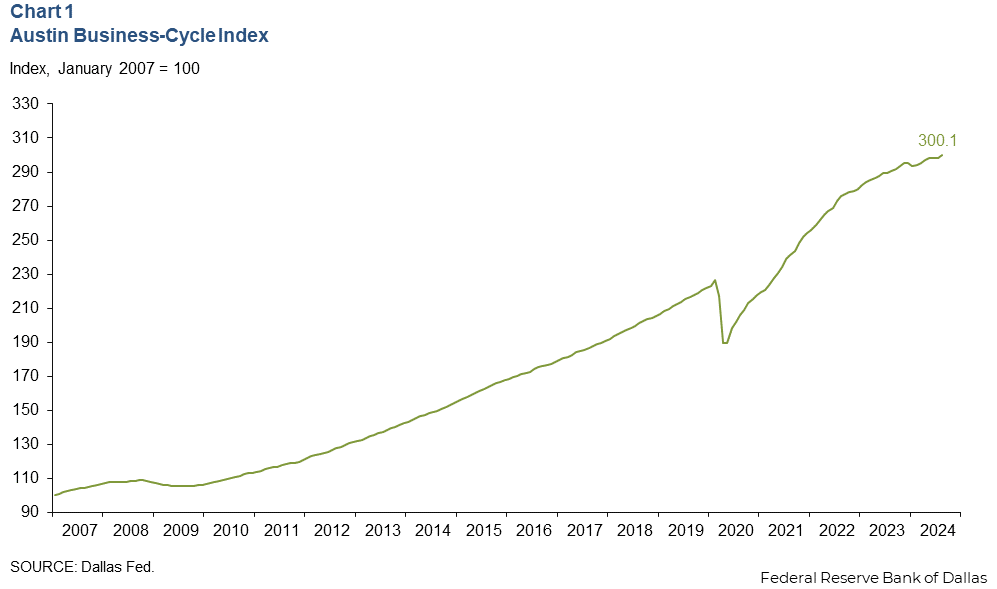
Business-cycle index
The Austin Business-Cycle Index, a broad measure of economic activity, grew an annualized 6.6 percent in August, faster than the 0.8 percent gain in July (Chart 1).
Labor market
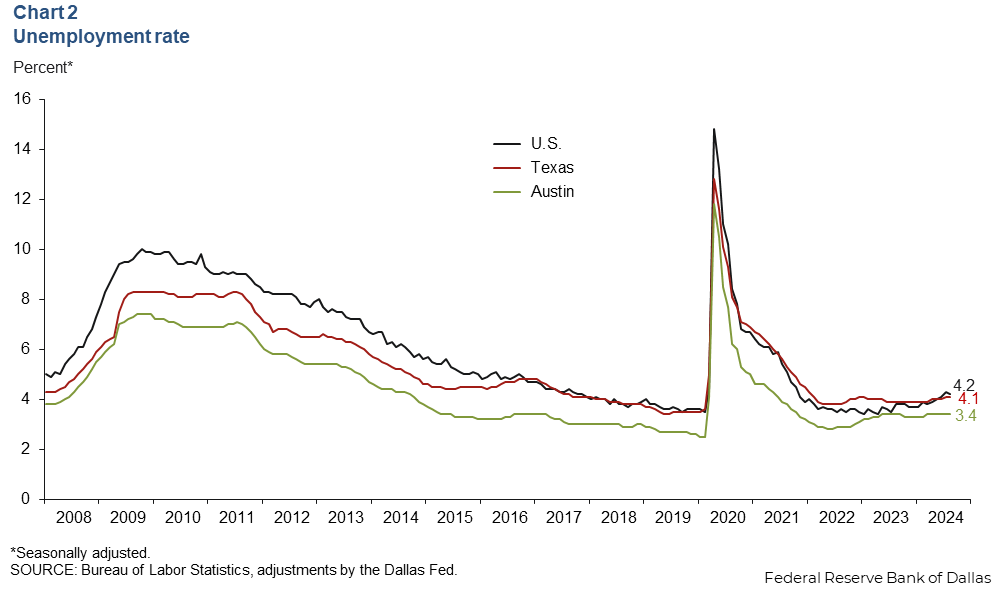
Unemployment rate stabilizes
Austin’s unemployment rate remained at 3.4 percent in August—below the state’s and nation’s rates of 4.1 and 4.2 percent, respectively (Chart 2). In August, the local labor force grew 2.0 percent, while the state’s increased 3.6 percent, and the nation’s grew 0.9 percent.
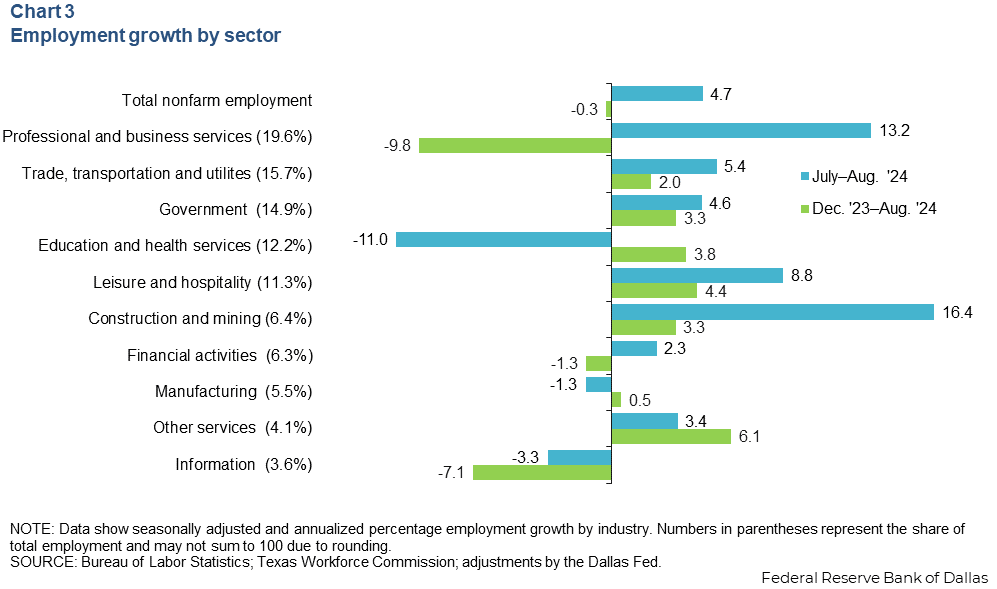
Employment picks up
Austin employment grew 4.7 percent in August after dropping 2.3 percent in July (Chart 3). Sectors that saw a decline included education and health services (-1,585 jobs) and information services (-134 jobs). Sectors with the most growth were professional and business services (2,741 jobs) and construction and mining (1,106 jobs). Year to date in August, Austin employment fell 0.3 percent, below the state’s and nation’s growth of 2.2 percent and 1.4 percent, respectively.
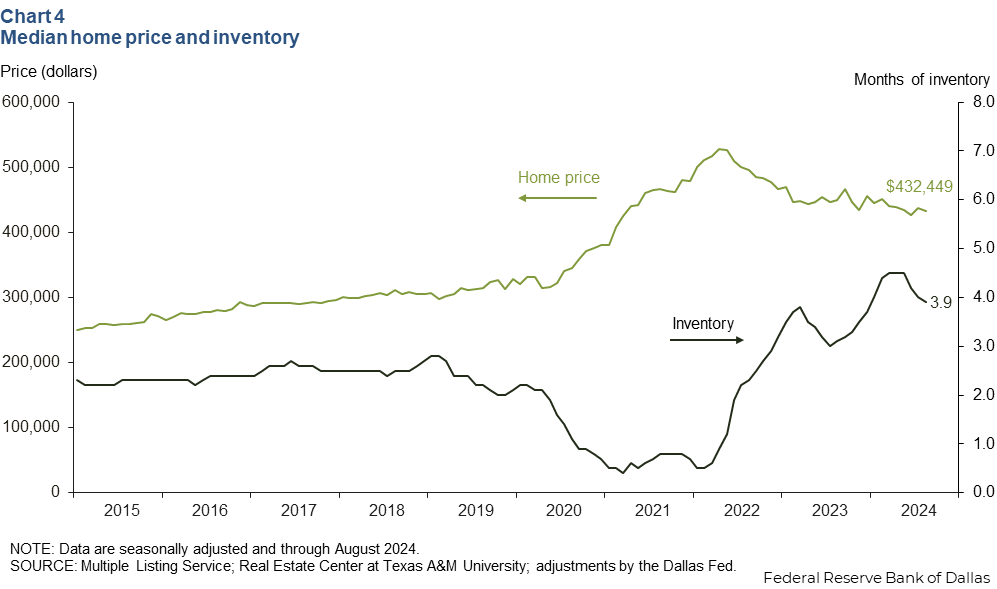
Housing
Austin’s median home price declined 1.1 percent in August to $432,449 (Chart 4). Year over year, home prices trended down—falling 3.9 percent in the metro and 2.8 percent in the state. Austin home inventories declined to 3.9 months in August, remaining below the six months that is generally considered a balanced housing market. A year ago, home inventory levels in Austin were 3.1 months, while they were 3.1 months in Texas and 3.0 months in the U.S.
Office vacancies
In the second quarter, Austin suburban office vacancies rose 1.4 percent, while downtown vacancies increased 7.9 percent (Chart 5). Suburban office vacancies have been steadily increasing since the beginning of 2021, but downtown vacancies have increased sharply in 2024.
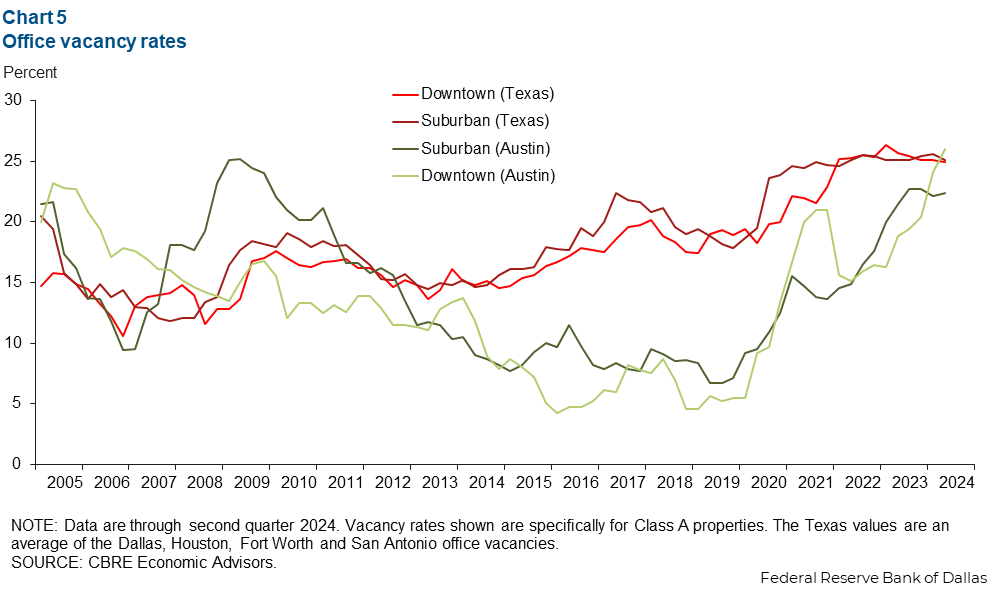
The Austin office suburban market registered lower vacancy than the average of the other Texas metros, but the downtown office vacancy was above average. The average vacancy rates of the other Texas metros (specifically Dallas, Houston, Fort Worth and San Antonio) were 25.1 percent for suburban offices and 24.9 percent for downtown locations. The other Texas metros have had stable vacancy rates in the second quarter compared with the first.
NOTE: Data may not match previously published numbers due to revisions.
About Austin Economic Indicators
Questions or suggestions can be addressed to Isabel Dhillon at Isabel.Dhillon@dal.frb.org.
Austin Economic Indicators is released on the first Thursday of every month.