Austin Economic Indicators

| Austin economy dashboard (October 2024) | |||
| Job growth (annualized) July–Oct. '24 |
Unemployment rate |
Avg. hourly earnings |
Avg. hourly earnings growth y/y |
| 4.0% | 3.6% | $34.56 | 1.8% |
Austin experienced modest employment growth in October accompanied by an increase in the unemployment rate. Rent and housing prices were down year over year while months of housing supply inventory was up.
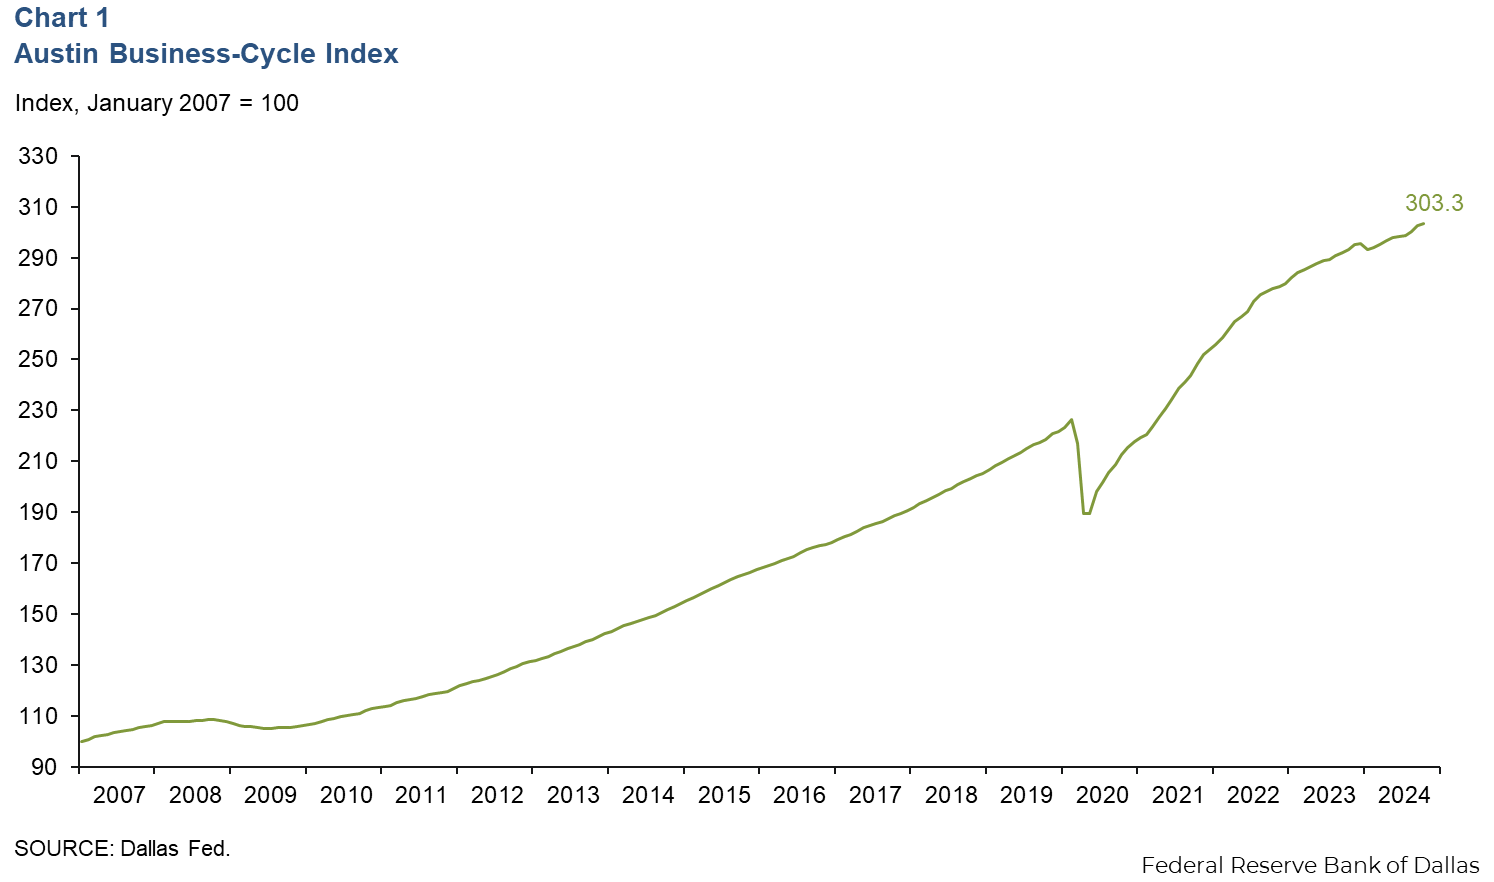
Business-cycle index
The Austin Business-Cycle Index, a broad measure of economic activity, grew an annualized 3.4 percent in October, slower than the 8.4 percent gain in September (Chart 1). Year over year, the index was up 3.4 percent.
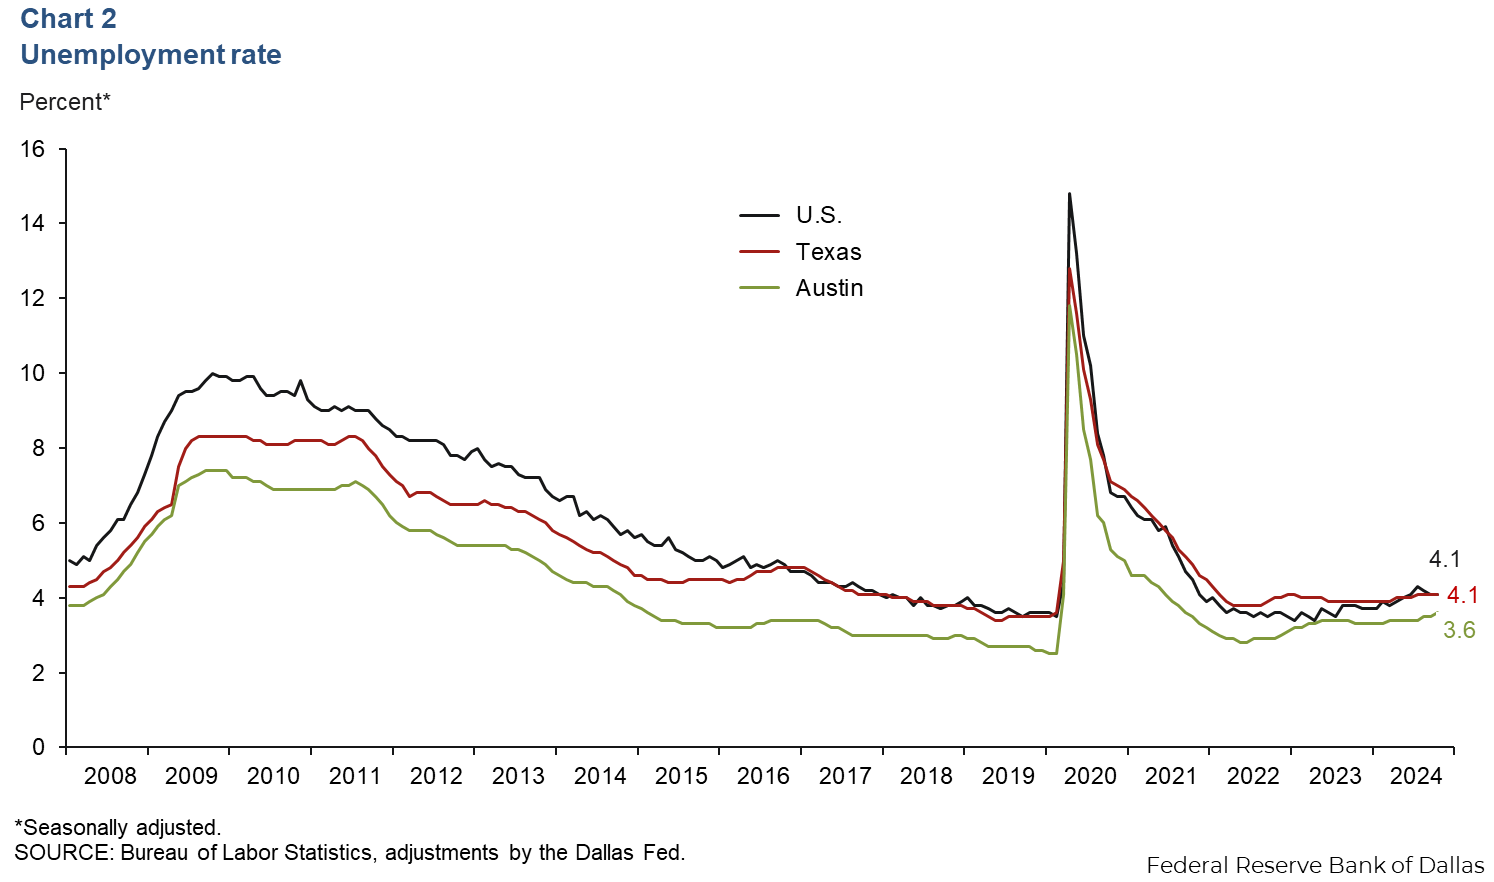
Labor market
Unemployment edges up
Austin’s unemployment rate ticked up to 3.6 percent in October but remained below the state and national rates of 4.1 percent (Chart 2). In October, the local labor force grew an annualized 2.3 percent, while the state’s increased 3.7 percent, and the nation’s contracted 1.5 percent.
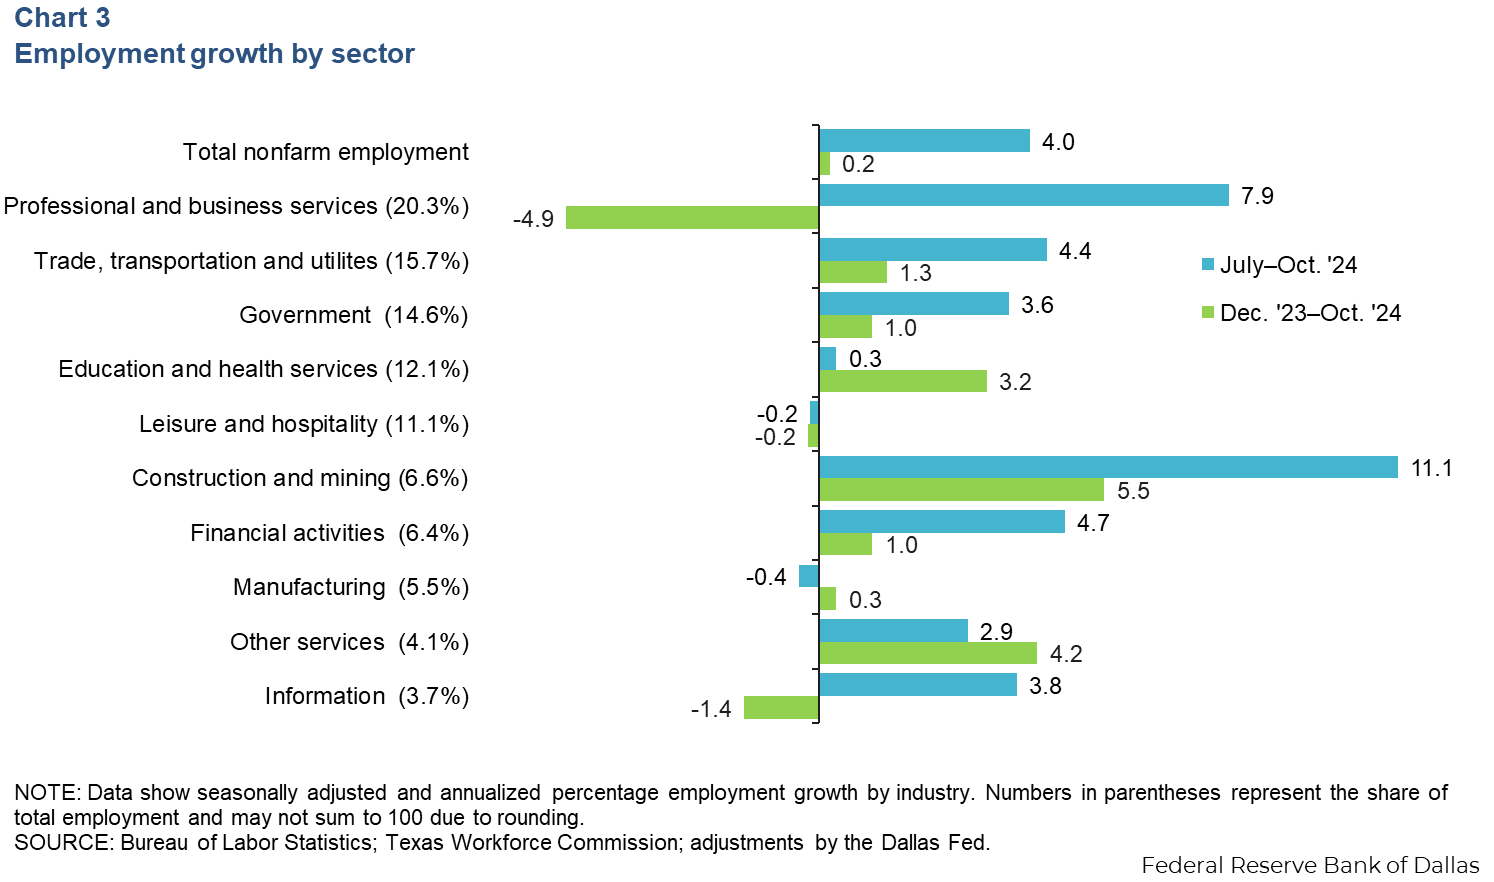
Employment growth continues
Austin employment grew an annualized 1.4 percent in October, slower than the 4.6 percent growth in September. Job growth was 4.0 percent over the three months ending in October (Chart 3). Growth was broad based, with the greatest gains seen in professional and business services (5,120 jobs) and construction and mining (2,330 jobs). Sectors that saw declines included leisure and hospitality (70 jobs) and manufacturing (70 jobs). Year to date in October, Austin’s employment growth was sluggish at an annualized 0.2 percent, slower than the state’s 1.6 percent and nation’s 1.3 percent growth.
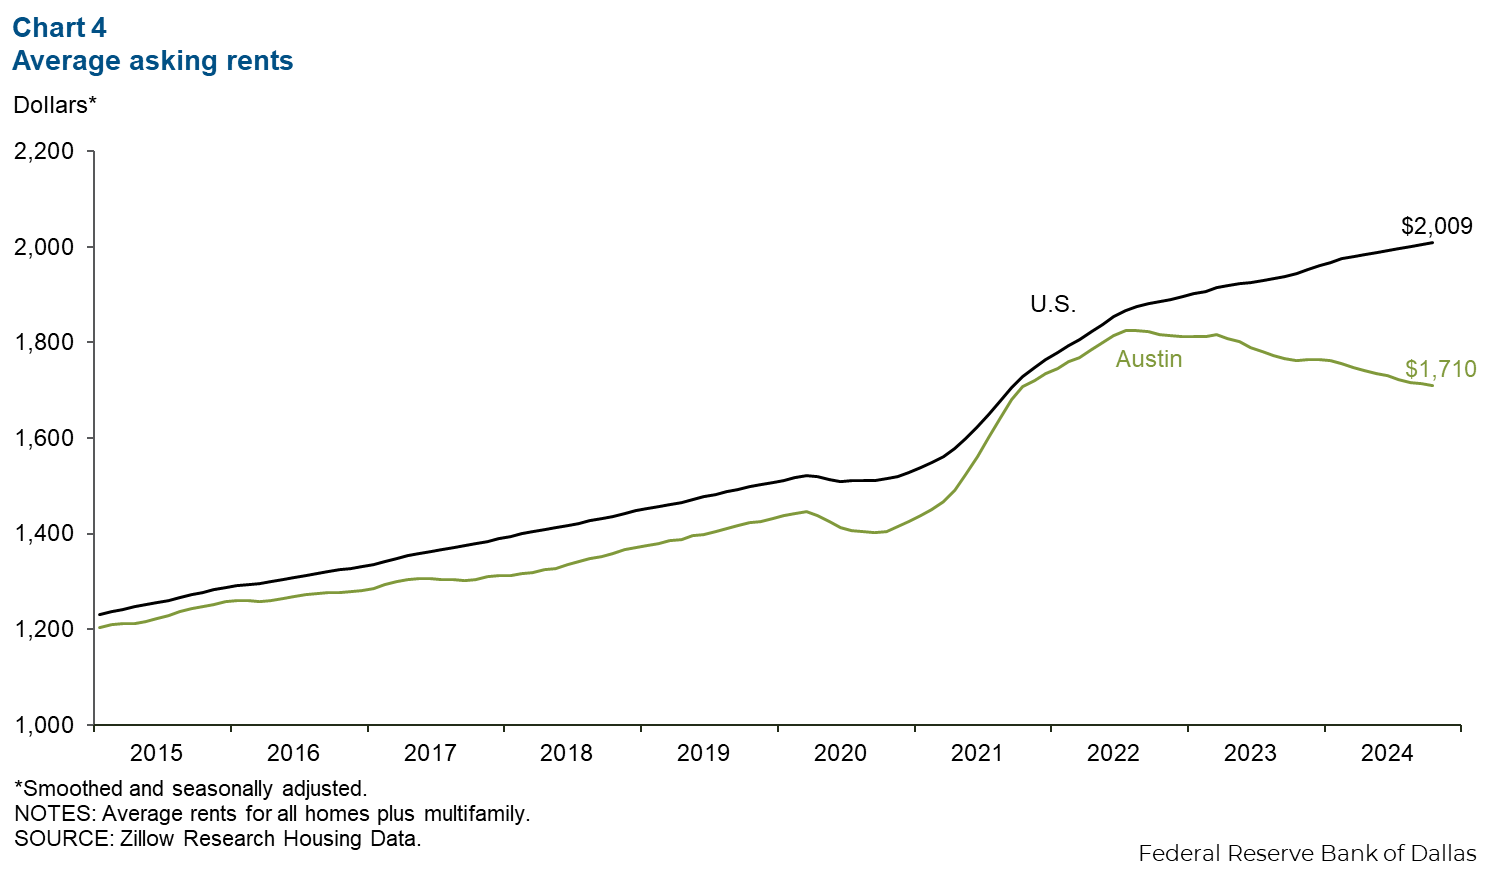
Housing
Rents dip
Rents in Austin fell 0.2 percent in October and were down 3.0 percent year over year. October marked the 11th consecutive month that asking rents fell (Chart 4). Austin rent prices peaked in August 2022 and have fallen 6.3 percent since. Rents in the U.S. were up 0.2 percent in October and 3.3 percent year over year and were 7.2 percent higher than August 2022.
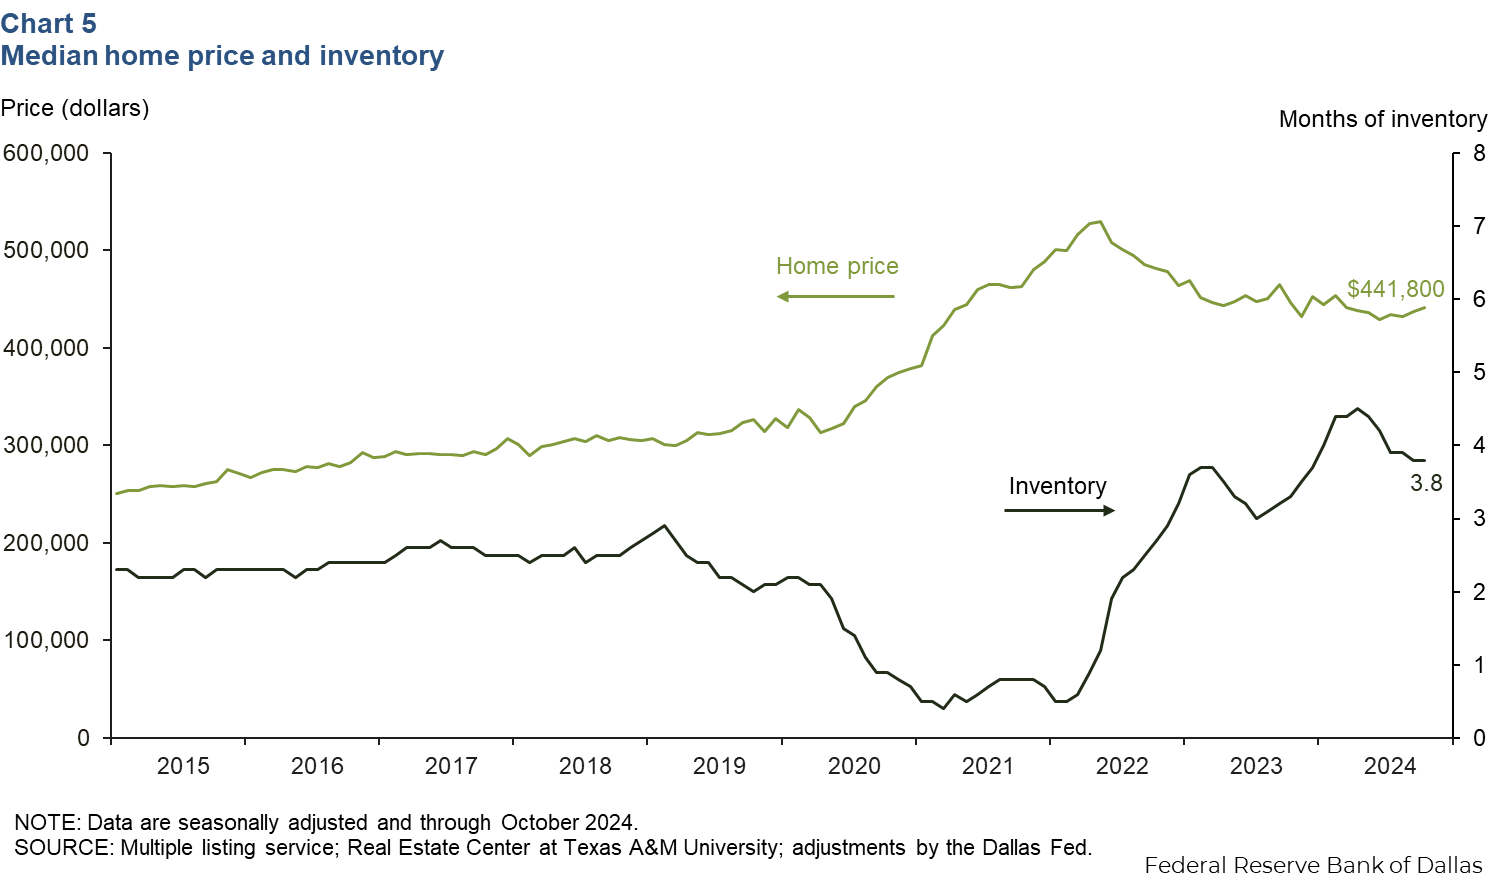
Housing prices
Austin’s median home price increased 1.0 percent in October (Chart 5). Year over year, home prices fell 1.1 percent in the metro area but were up 1.5 percent in Texas. Austin home inventories were stable at 3.8 months in October, remaining below six months, which is generally considered a balanced housing market. A year ago home inventory levels in Austin were 3.3 months.
NOTE: Data may not match previously published numbers due to revisions.
About Austin Economic Indicators
Questions or suggestions can be addressed to Isabel Dhillon at Isabel.Dhillon@dal.frb.org.
Austin Economic Indicators is released on the first Thursday of every month.