Austin Economic Indicators

| Austin economy dashboard (April 2025) | |||
| Job growth (annualized) Jan.–April '25 |
Unemployment rate |
Avg. hourly earnings |
Avg. hourly earnings growth y/y |
| 1.5% | 3.5% | $35.82 | 4.2% |
Austin employment rose in April, while the unemployment rate increased, and retail sales fell. Housing prices ticked down; however, inventories rose, and housing permits grew.
Labor market
Unemployment flat
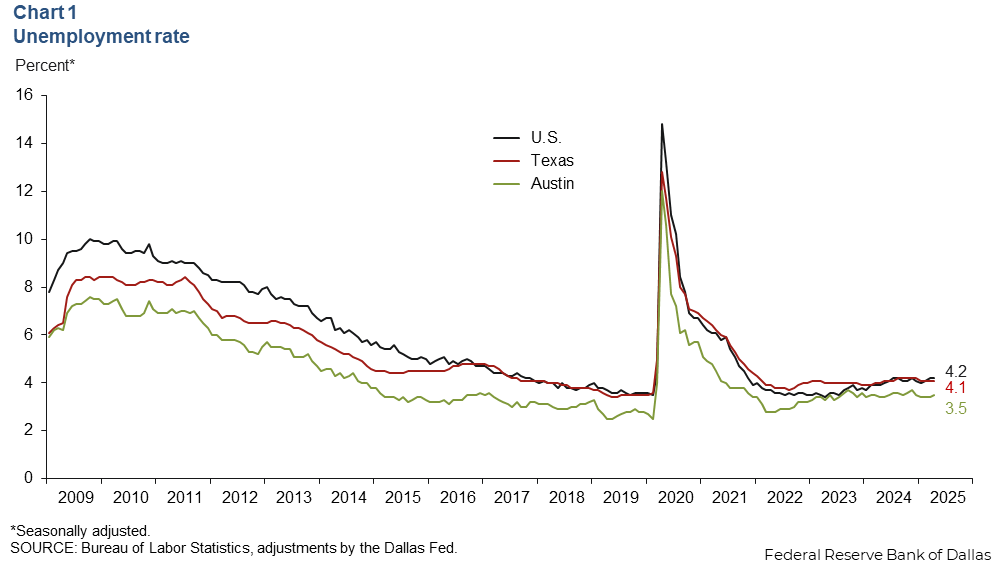
Austin’s unemployment rate ticked up to 3.5 percent in April, below the state and national rates of 4.1 and 4.2 percent, respectively (Chart 1). In April, the local labor force increased an annualized 9.6 percent, while the state’s increased 2.8 percent, and the nation’s grew 3.9 percent.
Employment growth picks up
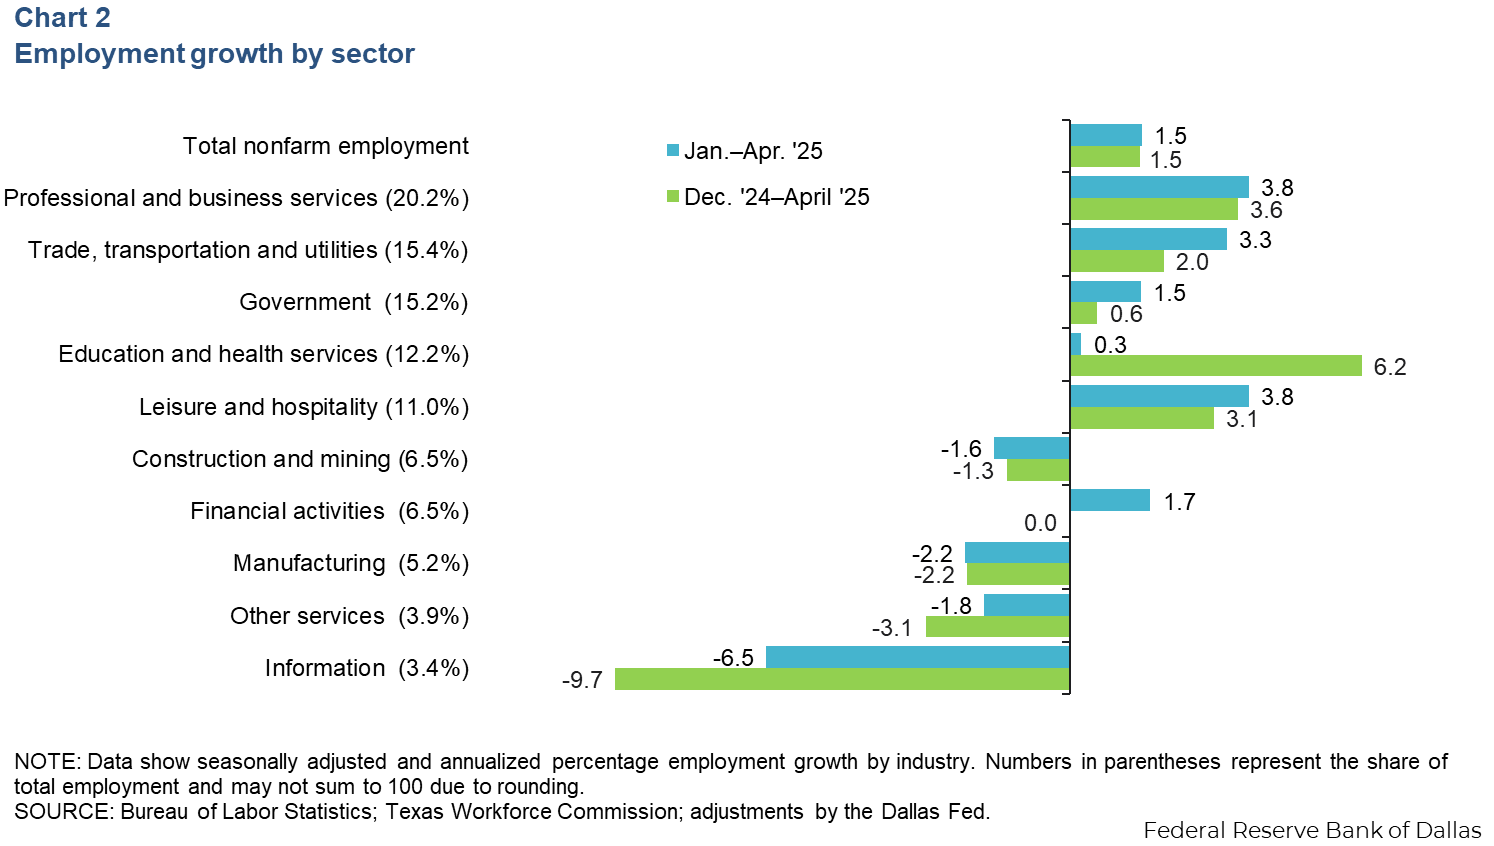
Austin employment increased an annualized 3.6 percent in April—faster than the 0.6 percent growth in March. In the three months ending in April, employment increased 1.5 percent (Chart 2). The greatest gains were in professional and business services (2,550 jobs) and leisure and hospitality (1,470 jobs). Sectors that declined include information (790 jobs) and manufacturing (430 jobs). Austin’s year-to-date employment in April grew 1.5 percent and was slower than Texas,’ which boasted 2.6 percent growth, but was faster than the nation’s, which was 1.1 percent.
Sales tax collections
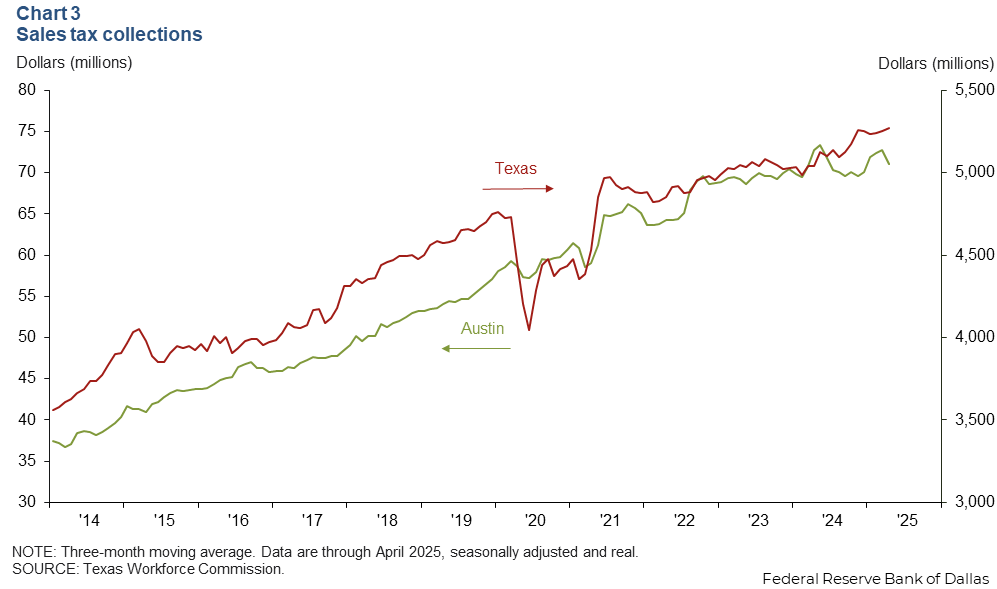
In April, the three-month moving average of Austin’s inflation-adjusted sales tax collections decreased 2.4 percent, while the state’s collections grew 0.4 percent (Chart 3). Year over year, the metro’s sales tax collections were down 2.4 percent, but Texas’ collections rose 4.6 percent.
Housing
Housing prices fall as inventories rise
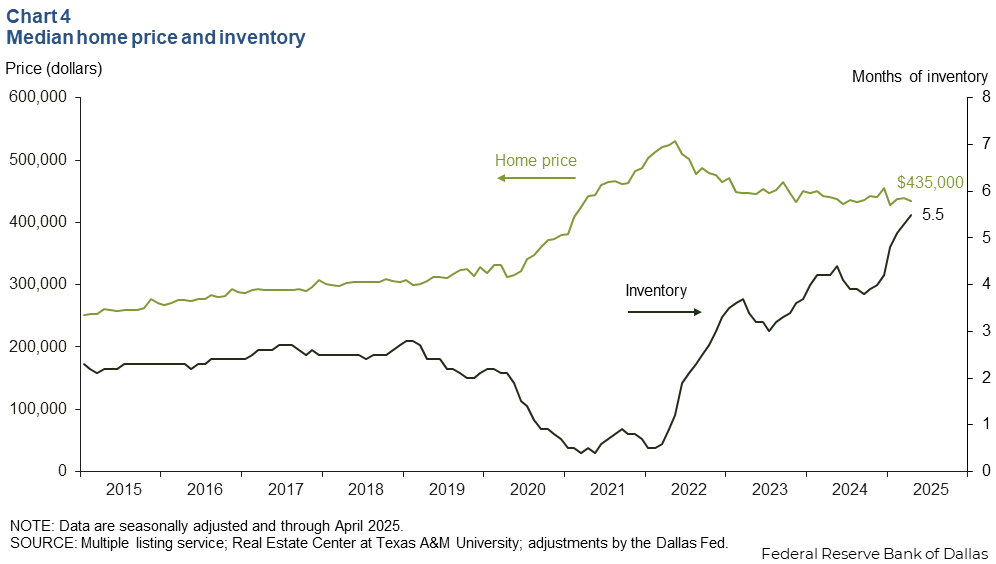
Austin’s median home price decreased 1.1 percent in April (Chart 4). Year over year, median home prices fell 1.4 percent in the metro area and were flat in Texas. Austin home inventories ticked up to 5.5 months in April, remaining below six months, which is generally considered a balanced housing market. A year ago, home inventory levels in Austin were 4.2 months.
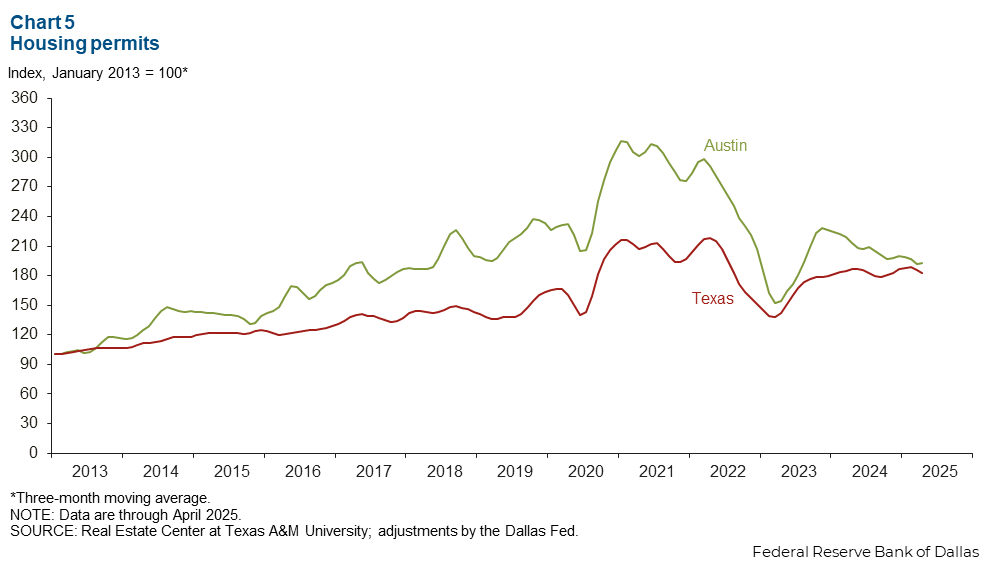
Downward trend observed in housing permits
The three-month moving average of Austin’s single-family home permits increased 3.2 percent in April, greater than the 1.4 percent decrease seen across the state (Chart 5). Year over year in April, the three-month moving average of single-family home permits dropped 4.1 percent, and the state’s fell 5.2 percent.
NOTE: Data may not match previously published numbers due to revisions.
About Austin Economic Indicators
Questions or suggestions can be addressed to Isabel Dhillon at Isabel.Dhillon@dal.frb.org.
Austin Economic Indicators is released on the first Thursday of every month.