Austin Economic Indicators

| Austin economy dashboard (June 2025) | |||
| Job growth (annualized) March–June '25 |
Unemployment rate |
Avg. hourly earnings |
Avg. hourly earnings growth y/y |
| 0.6% | 3.2% | $36.11 | 4.2% |
Austin employment fell in June and the unemployment rate declined, while wages increased. Sales tax receipts slowed in June.
Labor market
Unemployment falls
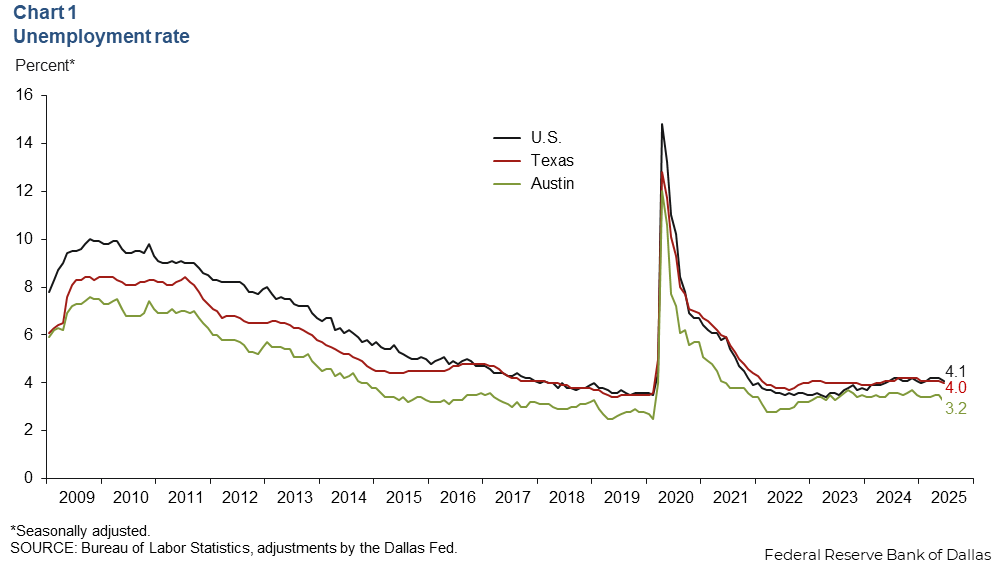
Austin’s unemployment rate fell to 3.2 percent in June, below the state rate of 4.0 percent and the national rate of 4.1 percent (Chart 1). In June, the local labor force decreased an annualized 4.1 percent, while the state’s increased 0.8 percent, and the nation’s fell 0.9 percent.
Jobs decline
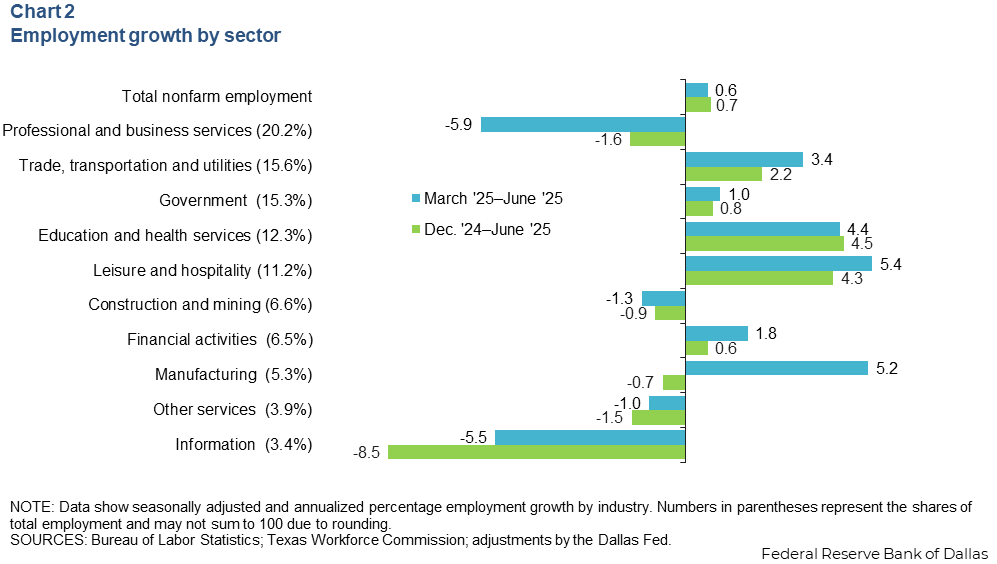
Austin employment decreased an annualized 2.6 percent in June, slower than the 2.2 percent growth in May. In the three months ending in June, employment increased an annualized 0.6 percent (Chart 2). The greatest gains were in leisure and hospitality (2,000 jobs), education and health services (1,800 jobs) and trade, transportation and utilities (1,800 jobs). Sectors that declined include professional and business services (-4,200 jobs) and information (-700 jobs). Austin’s employment grew 0.7 percent from December to June, slower than for Texas, which rose 1.8 percent. National employment rose 0.7 percent.
Earnings rise but at a slower pace
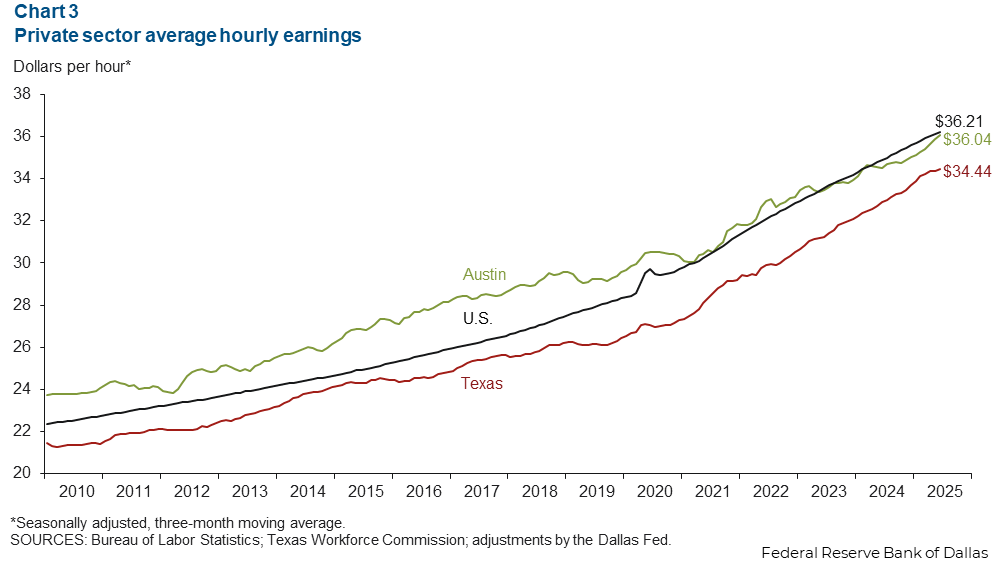
Austin’s average hourly wage was $36.11 in June, down from May. The three-month moving average for wages increased an annualized 4.2 percent in May to $36.04, lower than the nation’s average of $36.21 but higher than the state’s average of $34.44 (Chart 3). Year over year, Austin’s 4.2 percent wage growth was slower than Texas’ gains of 4.9 percent and faster than the nation’s gains of 3.8 percent.
Sales tax revenue rises slightly
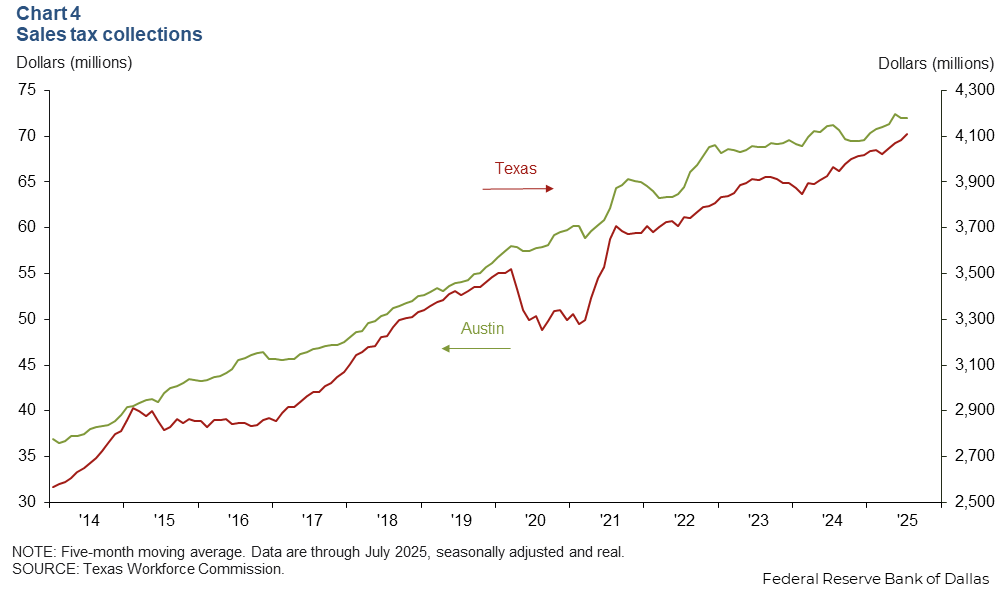
Sales tax receipts are a proxy for consumer spending patterns. Austin sales tax revenue, smoothed and adjusted for inflation, fell 0.1 percent from June to July, while Texas receipts rose 0.6 percent. From July 2024 to July 2025, Austin receipts increased 1.0 percent and Texas’ receipts rose 3.6 percent (Chart 4).
NOTE: Data may not match previously published numbers due to revisions.
About Austin Economic Indicators
Questions or suggestions can be addressed to Isabel Dhillon at Isabel.Dhillon@dal.frb.org.
Austin Economic Indicators is released on the first Thursday of every month.