Dallas-Fort Worth Economic Indicators

Dallas–Fort Worth economic growth was moderate in January. Revised data indicate that DFW employment expanded 2.4 percent in 2017—the second-fastest rate among Texas’ large metro areas, providing some momentum for continued sound growth in 2018. Unemployment remained low, and the Dallas and Fort Worth business-cycle indexes expanded in January following solid growth in 2017. Continued healthy job creation has been the driver for the DFW office and industrial markets.
Labor Market
Payrolls Expand in January
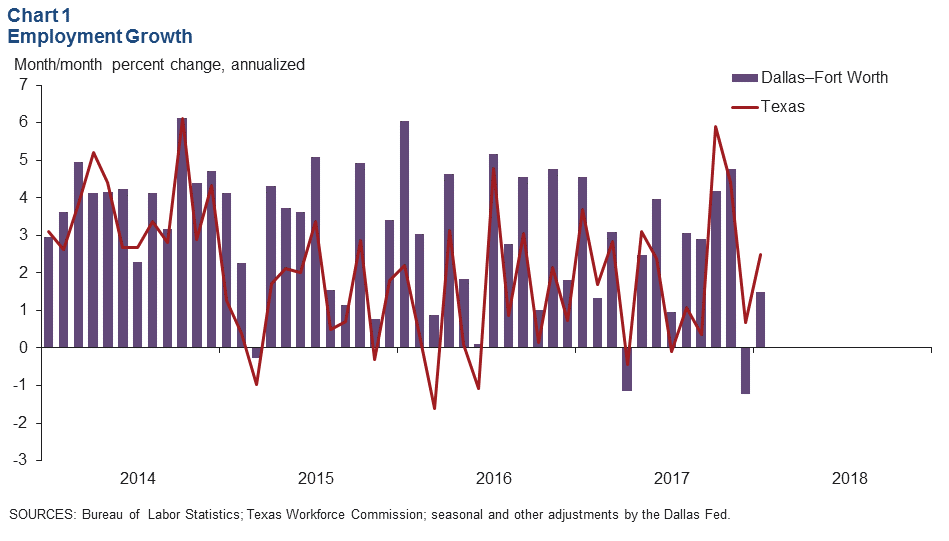
DFW employment rebounded in January, expanding an annualized 1.5 percent (4,530 jobs) following a 1.2 percent decline in December (Chart 1). Payrolls in Dallas rose 2.5 percent (5,310 jobs), more than offsetting a 0.9 percent (780 jobs) decline in Fort Worth.
2017 Job Growth Outperforms Most Major Texas Metros
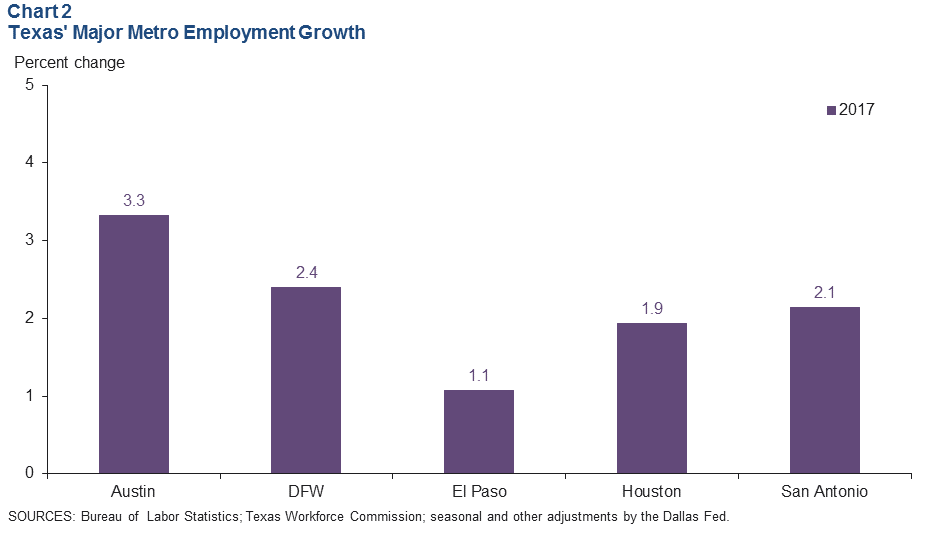
With the Bureau of Labor Statistics’ annual benchmark revisions, DFW job growth was 2.4 percent in 2017, up slightly from the previous estimate of 2.3 percent. This revision makes DFW the second-fastest-growing large metro area in Texas last year (Chart 2).
Unemployment Remains Low
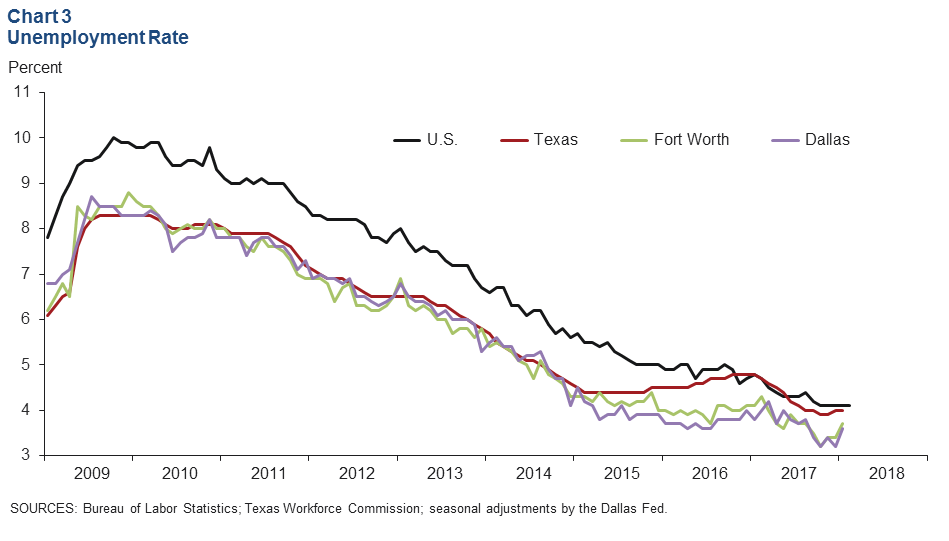
The labor market remained tight. Unemployment in January edged up to 3.6 percent in Dallas and 3.7 percent in Fort Worth but remains below its January 2017 levels and near historic lows (Chart 3). Jobless rates in both metros were lower than the state and U.S. rates. Unemployment held steady at 4.0 percent in Texas and 4.1 percent in the U.S.
Business-Cycle Indexes
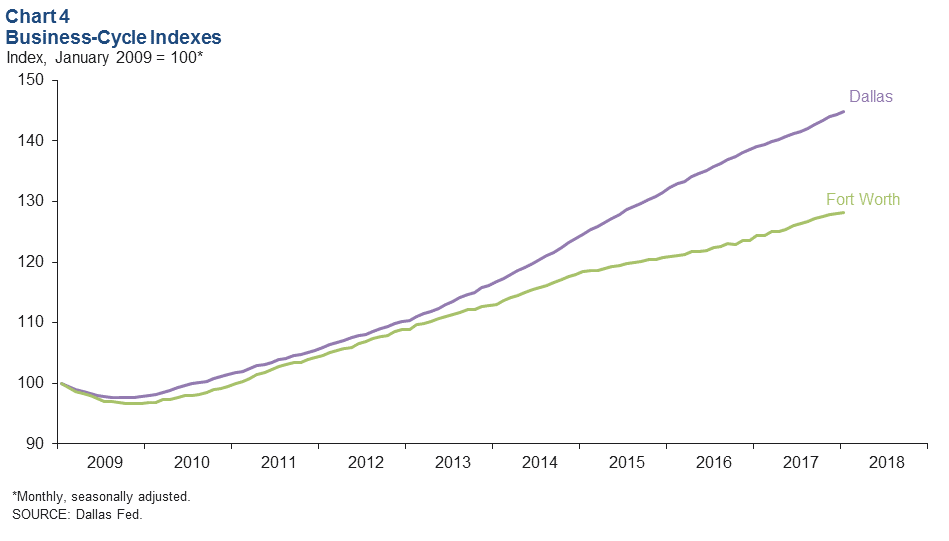
The Dallas Business-Cycle Index continued to expand in January, up an annualized 4.1 percent and faster than December’s 1.5 percent pace (Chart 4). Growth in the Fort Worth index slowed to 0.6 percent in January, following December’s solid 2.3 percent increase. Revised data indicate that the Dallas index grew 4.1 percent in 2017, and the Fort Worth index was 3.6 percent higher in part due to continued healthy job creation in the metroplex.
Office Market
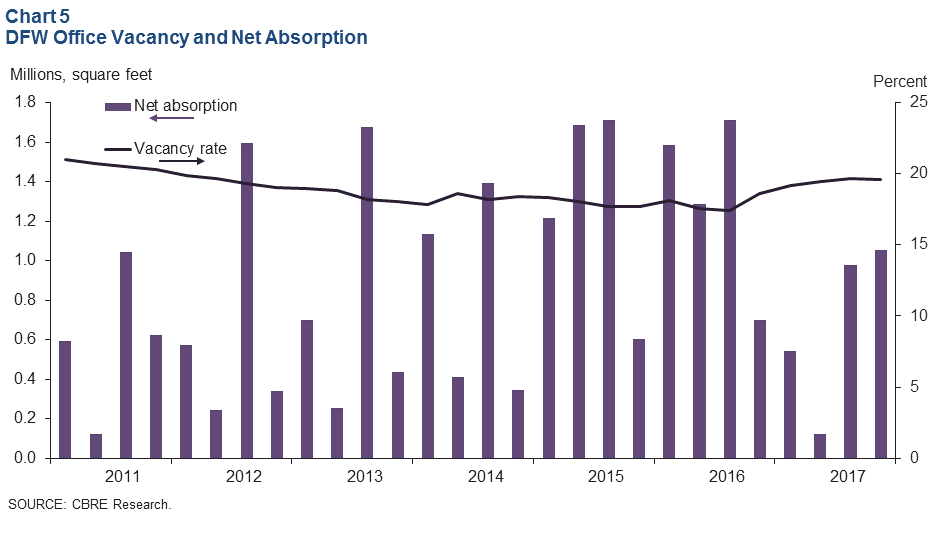
The DFW office market continued to experience solid leasing activity as healthy job creation further drove demand for office space. Net absorption was just over 1 million square feet in the fourth quarter, and average asking rents increased, according to data from CBRE (Chart 5). Office vacancy dipped in the fourth quarter. Office construction remained active but dipped to 4.4 million square feet in the fourth quarter, the lowest level of DFW office space under construction since mid-2013.
Industrial Market
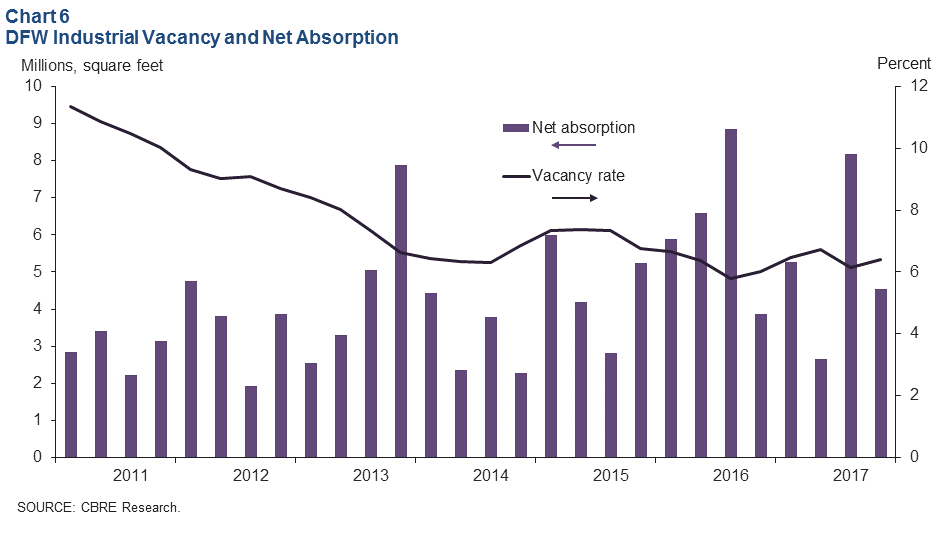
Industrial leasing activity continued to be solid. Net absorption was 4.5 million square feet in fourth quarter 2017, bringing the 2017 total to 20.6 million square feet—the second-highest level of annual absorption in this expansion cycle, according to data from CBRE (Chart 6). Consumer goods, e-commerce and third-party logistics firms led demand last year. Industrial vacancy edged up to 6.4 percent in the fourth quarter but remained close to historic lows. The construction pipeline expanded to 19.2 million square feet toward year-end.
NOTE: Data may not match previously published numbers due to revisions.
About Dallas–Fort Worth Economic Indicators
Questions can be addressed to Laila Assanie at laila.assanie@dal.frb.org. Dallas–Fort Worth Economic Indicators is published every month on the Tuesday after state and metro employment data are released.