Dallas-Fort Worth Economic Indicators

DFW economic growth continued in February, with payroll employment expanding and unemployment staying low. Looking at the two-month period, employment growth has been strong at 3.0 percent. The Dallas and Fort Worth business-cycle indexes expanded last month. Housing affordability remained low in Dallas but improved slightly in Fort Worth in the fourth quarter. DFW house price gains outstripped those nationally last year, and home inventories remained very tight in February.
Labor Market
DFW employment continued to post strong growth in February, expanding an annualized 2.7 percent (8,000 jobs) following an upwardly revised 3.4 percent increase in January (Chart 1). Payrolls rose 2.2 percent (4,750 jobs) in Dallas and 3.9 percent (3,300 jobs) in Fort Worth last month.
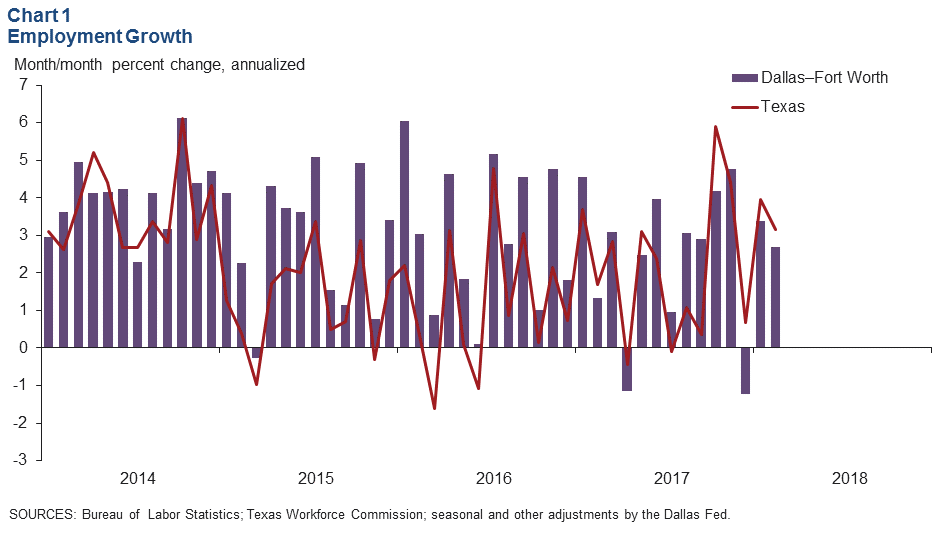
The labor market continued to be tight. Unemployment in February edged up to 3.6 percent in Dallas and in Fort Worth; however, the jobless rate in both metros remains near historic lows and is lower than the state and U.S. rates.
Business-Cycle Indexes
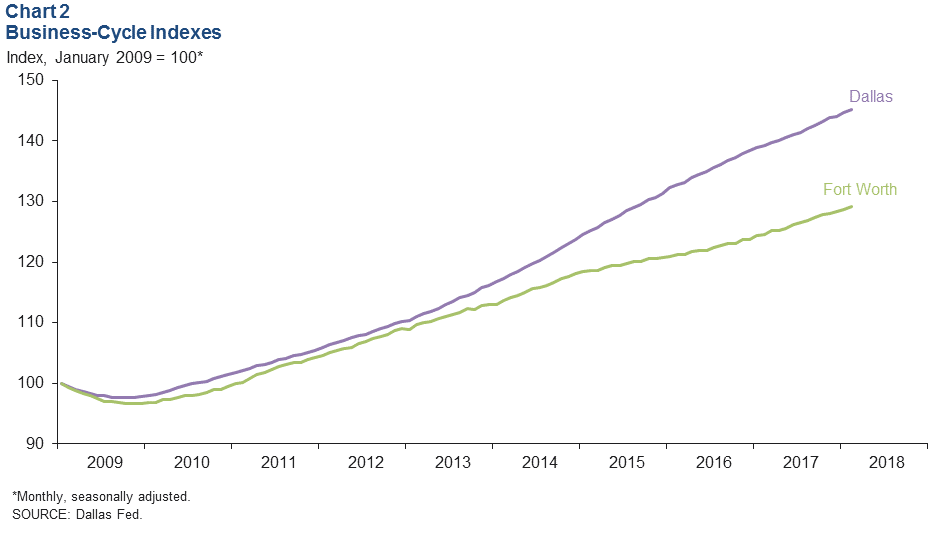
The business-cycle indexes for Dallas and Fort Worth continued to expand in February (Chart 2). The Dallas index rose 4.1 percent, and growth in the Fort Worth index accelerated to 4.4 percent in February following January’s 2.9 percent increase. The Dallas index was up 4.3 percent and the Fort Worth index was 3.6 percent higher from year-ago levels, in part due to continued healthy job creation in the metroplex.
Population
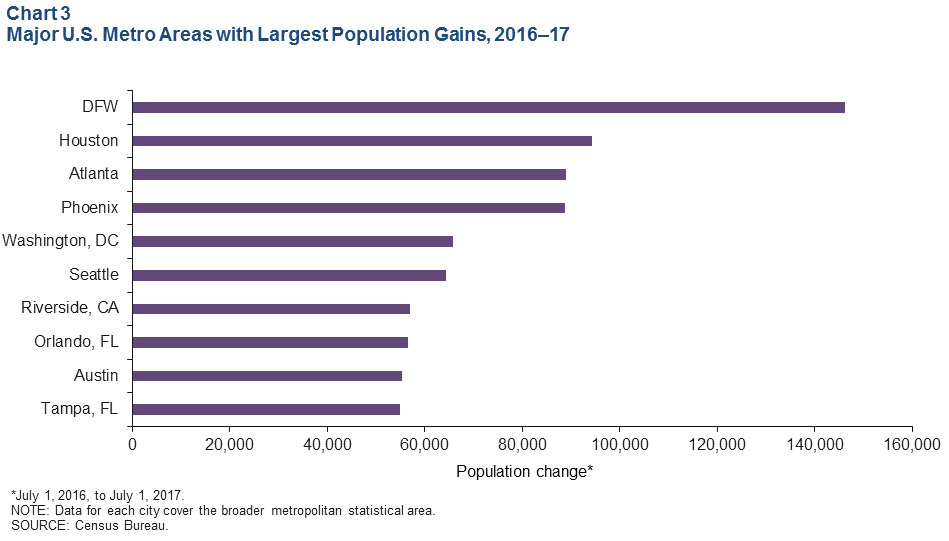
The Dallas–Fort Worth population continued to climb in 2017. Recently released census data show that from July 2016 to July 2017, the metroplex grew by 146,000 people—the largest numerical increase among metro areas in the U.S. (Chart 3). DFW’s 2 percent gain was ahead of Texas’ 1.4 percent increase last year. Net domestic migration accounted for 41 percent of the growth in DFW’s population in 2017, and international migrants made up nearly 18 percent. This means that approximately 235 people moved to DFW every day last year. Collin, Dallas, Denton and Tarrant counties placed among the nation’s top 10 counties with the largest numerical increase. DFW is the fourth-largest metropolitan statistical area in the U.S., with a population of 7.4 million in 2017.
Housing Market
Home Prices Climb Further
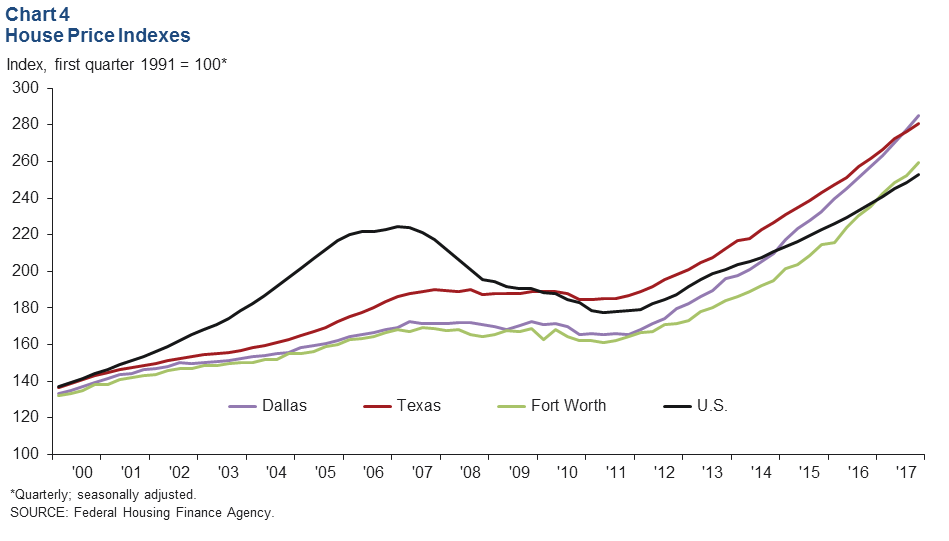
Home price gains in the metroplex continue to outpace those in the U.S. (Chart 4). Prices rose 2.7 percent in both Dallas and Fort Worth in fourth quarter 2017, faster than the state’s 1.7 percent gain and the nation’s 1.6 percent increase, according to the most recent Federal Housing Finance Agency purchase-only house price index. On a year-over-year basis, prices rose 10.8 percent in Dallas and 10.3 percent in Fort Worth—both faster than the Texas rate of 7.3 percent and the nation’s 6.7 percent figure. Continued healthy job creation and tight home inventories have propelled price increases in the area.
Affordability in Dallas Remains Low
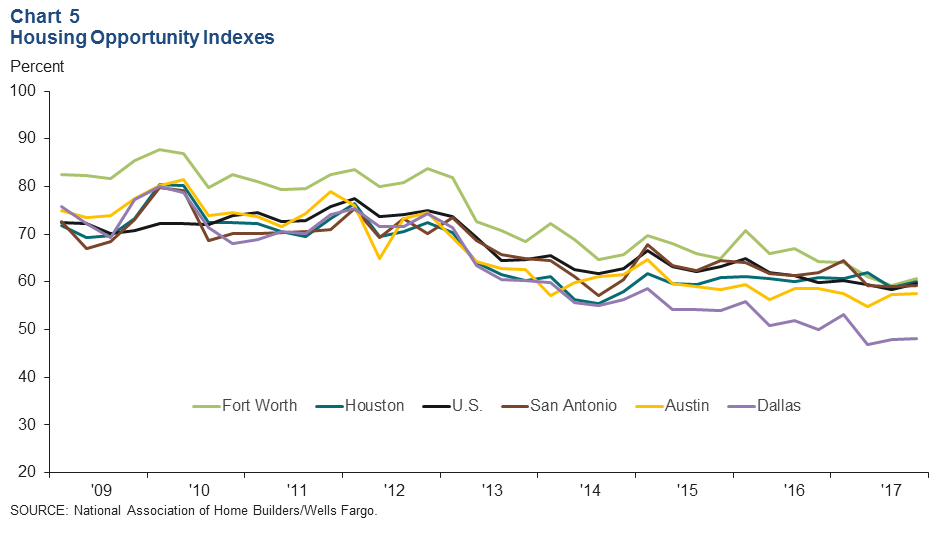
Record home-price appreciation following the Great Recession has eroded housing affordability in the metroplex. According to the National Association of Home Builders/Wells Fargo Housing Opportunity indexes, 48.2 percent of the homes (new and existing) sold in Dallas in fourth quarter 2017 were affordable for a median-income family (Chart 5). This is well below the national figure of 59.6 percent. Affordability has been declining in Dallas since 2010, and the index has dropped markedly from its peak, set in first quarter 2010. Despite having a lower median home sales price than Austin, Dallas has the lowest affordability among major Texas metros. Affordability in Fort Worth improved slightly to 60.7 percent in the fourth quarter.
Existing-Home Inventories Still Very Tight
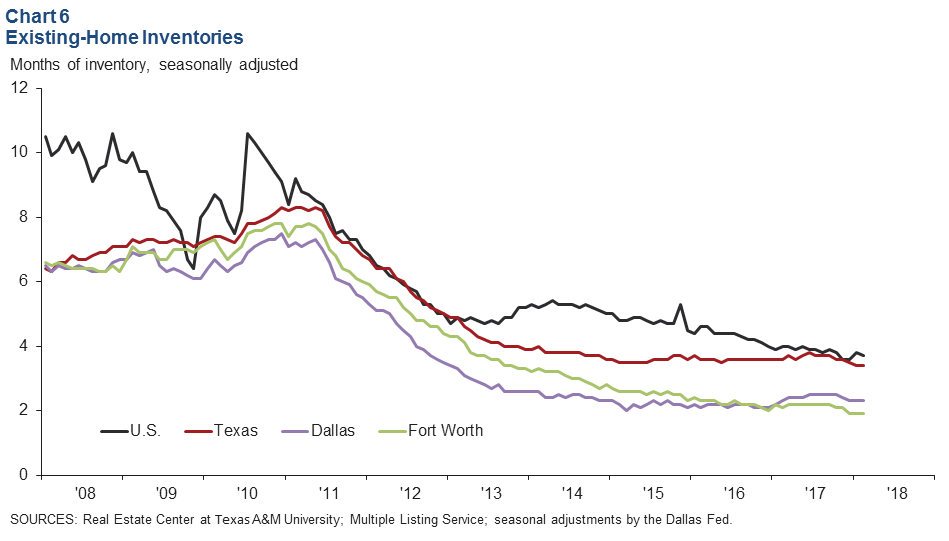
DFW existing-home inventories remain tight at around two months, well below the six months’ supply typically associated with a balanced market. In February, inventories were at 2.3 months in Dallas and 1.9 months in Fort Worth (Chart 6). Inventories in both Dallas and Fort Worth are the lowest among Texas’ major metros and have been under three months since late 2014.
NOTE: Data may not match previously published numbers due to revisions.
About Dallas–Fort Worth Economic Indicators
Questions can be addressed to Laila Assanie at laila.assanie@dal.frb.org. Dallas–Fort Worth Economic Indicators is published every month on the Tuesday after state and metro employment data are released.