Dallas-Fort Worth Economic Indicators

Dallas–Fort Worth economic growth continued to be healthy in March. Payroll employment in the first quarter expanded at its fastest rate in a year and a half. Unemployment remained near multiyear lows, and the Dallas and Fort Worth business-cycle indexes expanded further. Office leasing activity moderated in the first quarter, while industrial demand remained solid.
Labor Market
Payroll Expansion Continues
DFW employment rose an annualized 1.9 percent in March (Chart 1). Payrolls in Dallas grew at a faster clip of 2.2 percent (4,830 jobs), while Fort Worth saw a 1.2 percent (1,040 jobs) increase last month.
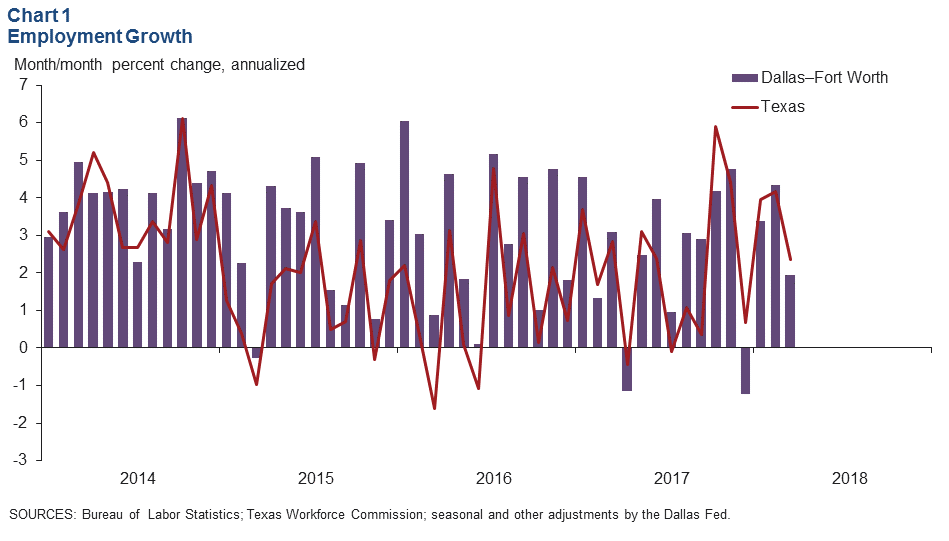
The labor market remained tight. Unemployment in March edged up to 3.6 percent in Dallas but held steady in Fort Worth at 3.6 percent. Jobless rates in both metros were near multiyear lows as well as below state and U.S. rates.
Job Gains Accelerate in First Quarter
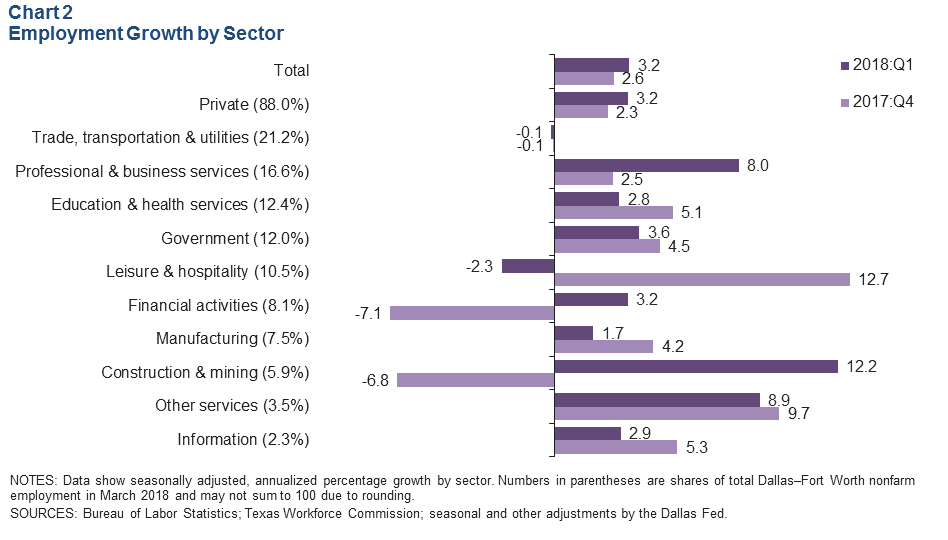
Jobs in DFW grew at a 3.2 percent annualized rate in first quarter 2018—the fastest pace since third quarter 2016, when employment expanded 4.2 percent. Growth was broad based, led by a surge in professional and business services employment (Chart 2). Hiring in construction and mining was also strong, particularly in Dallas. Job growth accelerated in financial activities in the quarter but moderated in education and health services as well as in government. Leisure and hospitality employment contracted due to a slowdown in food services hiring. Trade, transportation and utilities employment was flat as declines in retail payrolls were nearly offset by increases in transportation services and wholesale trade jobs.
Dallas Outperforms Fort Worth in Job Growth
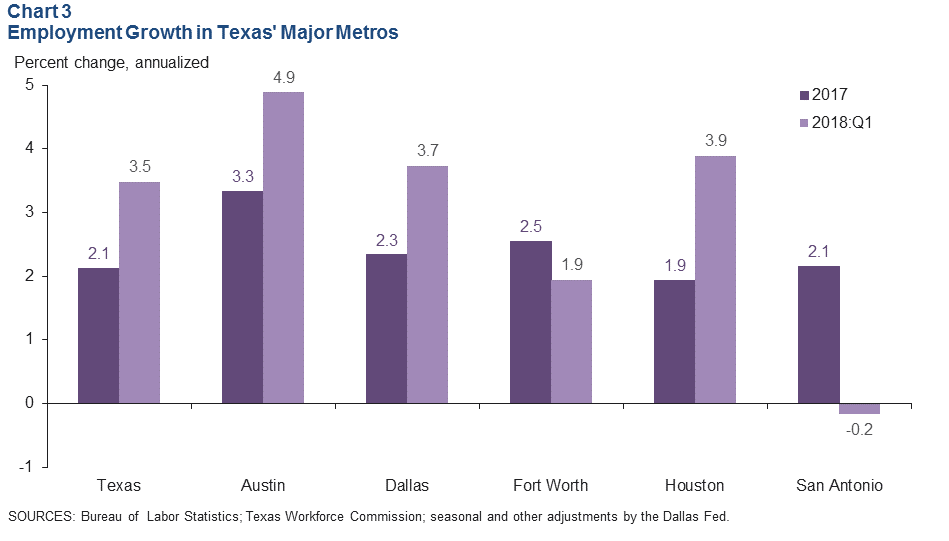
Job growth in Dallas accelerated to an annualized 3.7 percent over the first quarter, compared with last year’s performance of 2.3 percent (Chart 3). In contrast, growth moderated in Fort Worth from 2.5 percent in 2017 to an annualized 1.9 percent in the first quarter. Among the major Texas metros, Austin leads in year-to-date job growth, followed by Houston and Dallas.
Business-Cycle Indexes
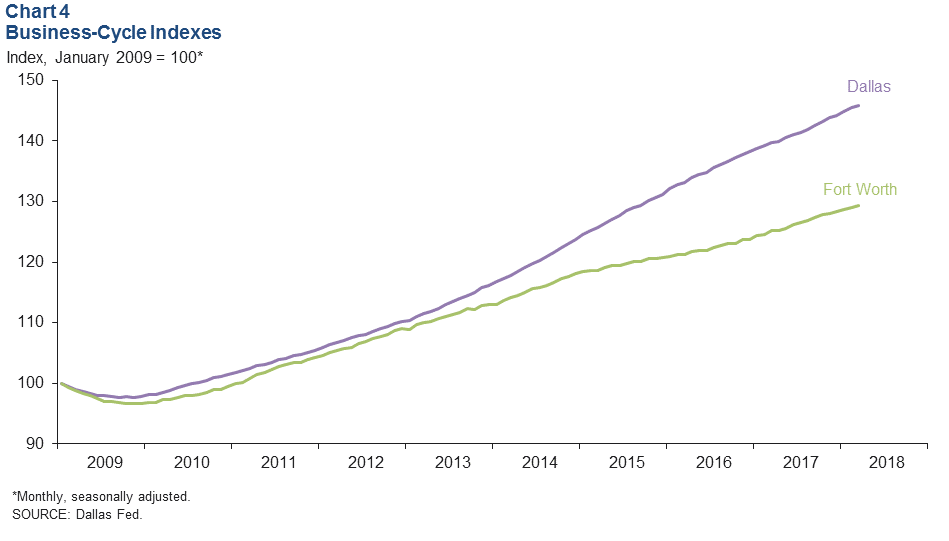
The Dallas and Fort Worth business-cycle indexes expanded further last month (Chart 4). The Dallas index rose an annualized 3.6 percent in March, in line with its long-term average over the past two decades. The Fort Worth index grew 2.3 percent in March, slower than both February’s 3.8 percent rate and its long-term average pace. In first quarter 2018, the Dallas index was up an annualized 5.1 percent, and the Fort Worth index was 3.0 percent higher as a result of continued healthy job creation and low unemployment in the metroplex.
Commercial Real Estate
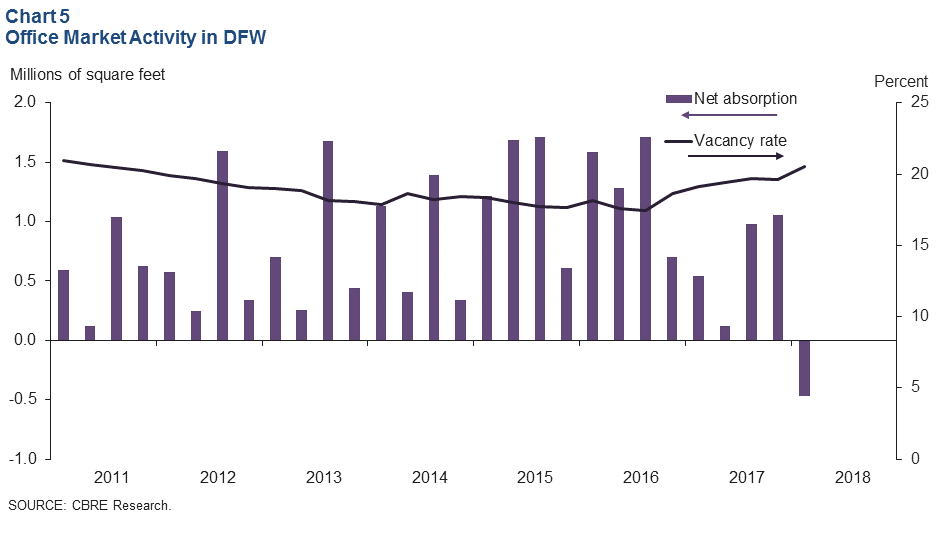
Office Leasing Slows
Activity in the DFW office market moderated in the first quarter. Net absorption was negative for the first time since second quarter 2010, pushing the vacancy rate up to 20.5 percent, according to data from CBRE (Chart 5). Average asking rents dipped as well. Construction ticked up to 4.9 million square feet in the first quarter, with a large share of the space under construction being speculative.
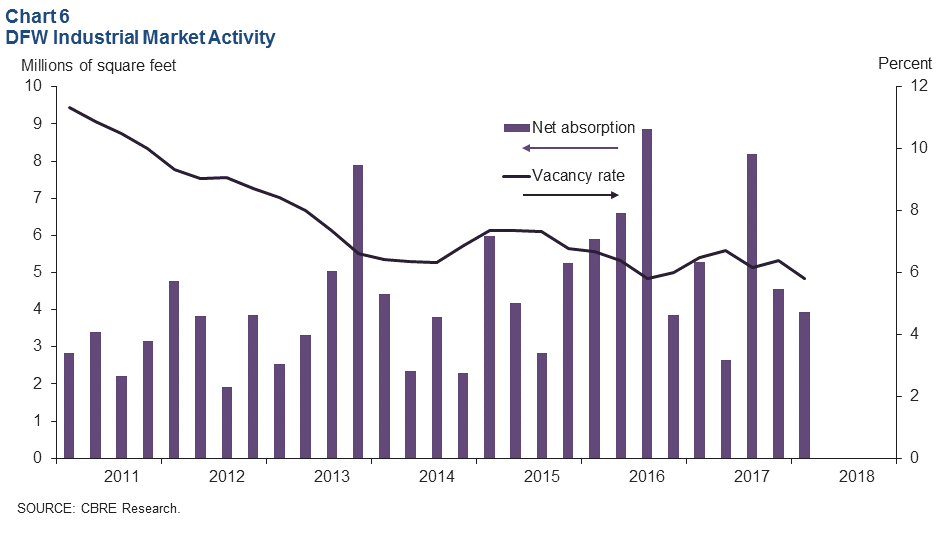
Industrial Demand Remains Healthy
Leasing activity continued to be solid for industrial space, with positive absorption and a decline in the vacancy rate in first quarter 2018, according to CBRE (Chart 6). Net absorption was 3.9 million square feet, driven by demand from consumer goods, e-commerce and third-party logistics firms. The vacancy rate fell from 6.4 percent to 5.8 percent. The construction pipeline remained flat at 19.3 million square feet, and prelease commitments for product under construction were higher than the historical average.
NOTE: Data may not match previously published numbers due to revisions.
About Dallas–Fort Worth Economic Indicators
Questions can be addressed to Laila Assanie at laila.assanie@dal.frb.org. Dallas–Fort Worth Economic Indicators is published every month on the Tuesday after state and metro employment data are released.