Dallas-Fort Worth Economic Indicators

The Dallas–Fort Worth economy continued to expand at a torrid pace. The May jobs report showed the metro area growing at a 3.7 percent annualized rate in the first five months of the year, adding a total of 55,500 net new jobs. The unemployment rate remained near record lows, and the Dallas and Fort Worth business-cycle indexes posted above-trend growth. Home-price appreciation moderated in Dallas in the first quarter but stayed strong in Fort Worth. Housing affordability improved slightly in the first quarter but was lower in Dallas relative to other major Texas metros as well as the U.S.
Labor Market
Solid Payroll Expansion Ongoing
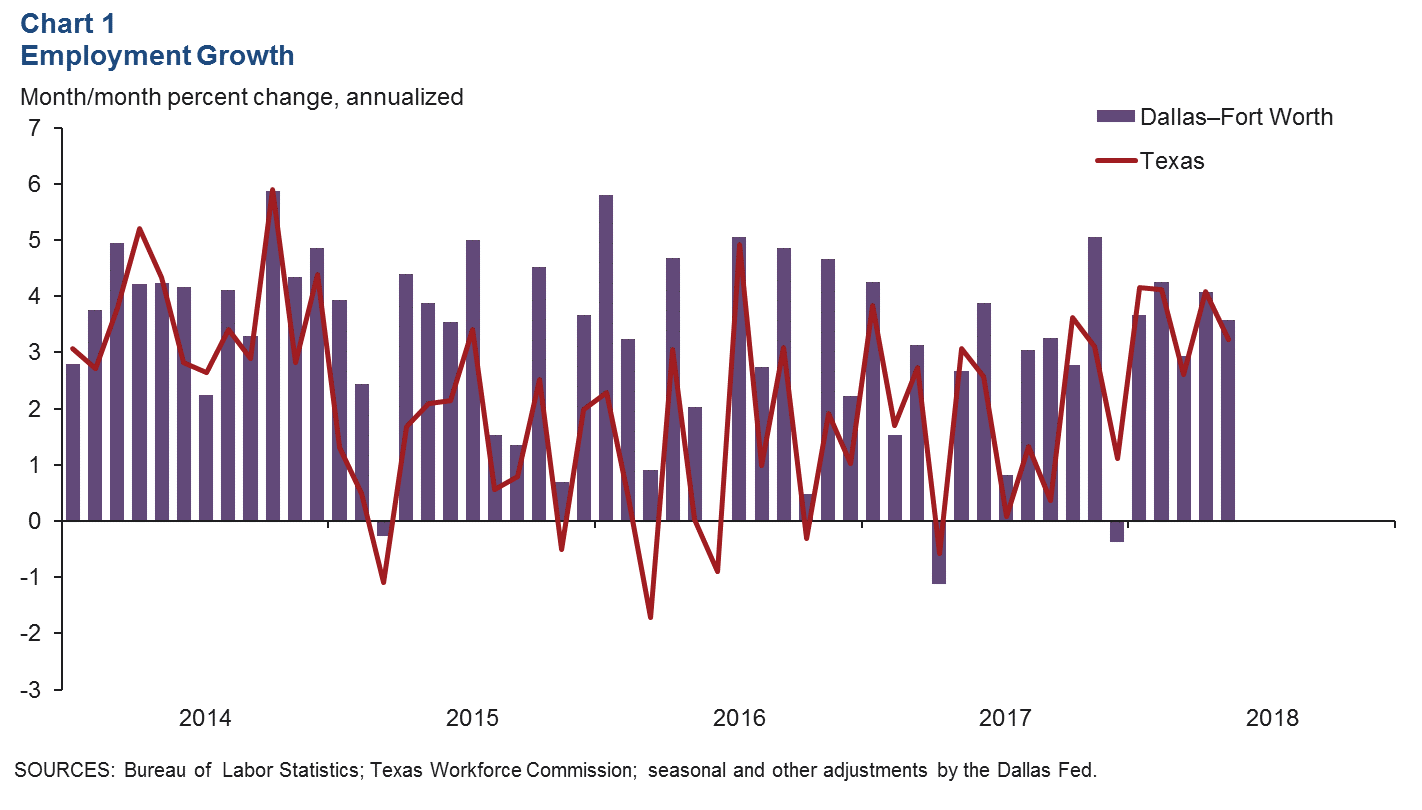
DFW payrolls grew by 10,800 jobs in May or a 3.6 percent annualized increase following gains of over 12,000 in April (Chart 1). Employment in Dallas rose an annualized 3.5 percent (7,600 jobs), and Fort Worth saw 3.7 percent growth (3,200 jobs) last month. DFW year-to-date employment growth of 3.7 percent (annual rate) is ahead of last year’s 2.4 percent pace and second only to Houston among the major Texas metros.
Employment Growth Broad Based
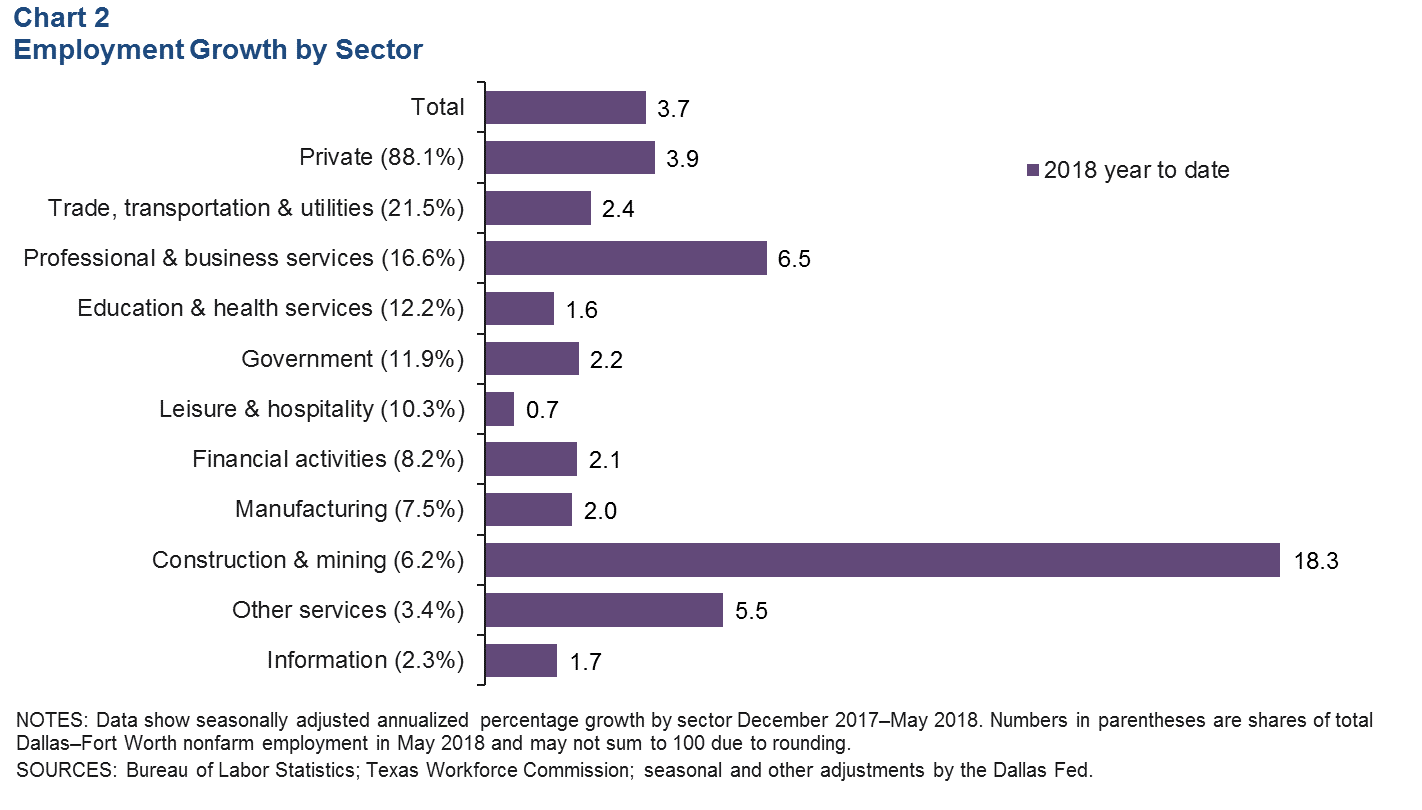
Employment gains have been widespread across sectors, with payrolls in construction and mining leading growth (Chart 2). Dallas serves as the business and financial services hub of the state, and the metroplex has posted rapid growth in professional and business services (15,800 jobs) thus far in 2018. Trade, transportation and utilities, financial activities, manufacturing and government have all added jobs at a healthy clip. Employment growth in education and health services and leisure and hospitality has slowed from last year’s pace.
Unemployment Dips
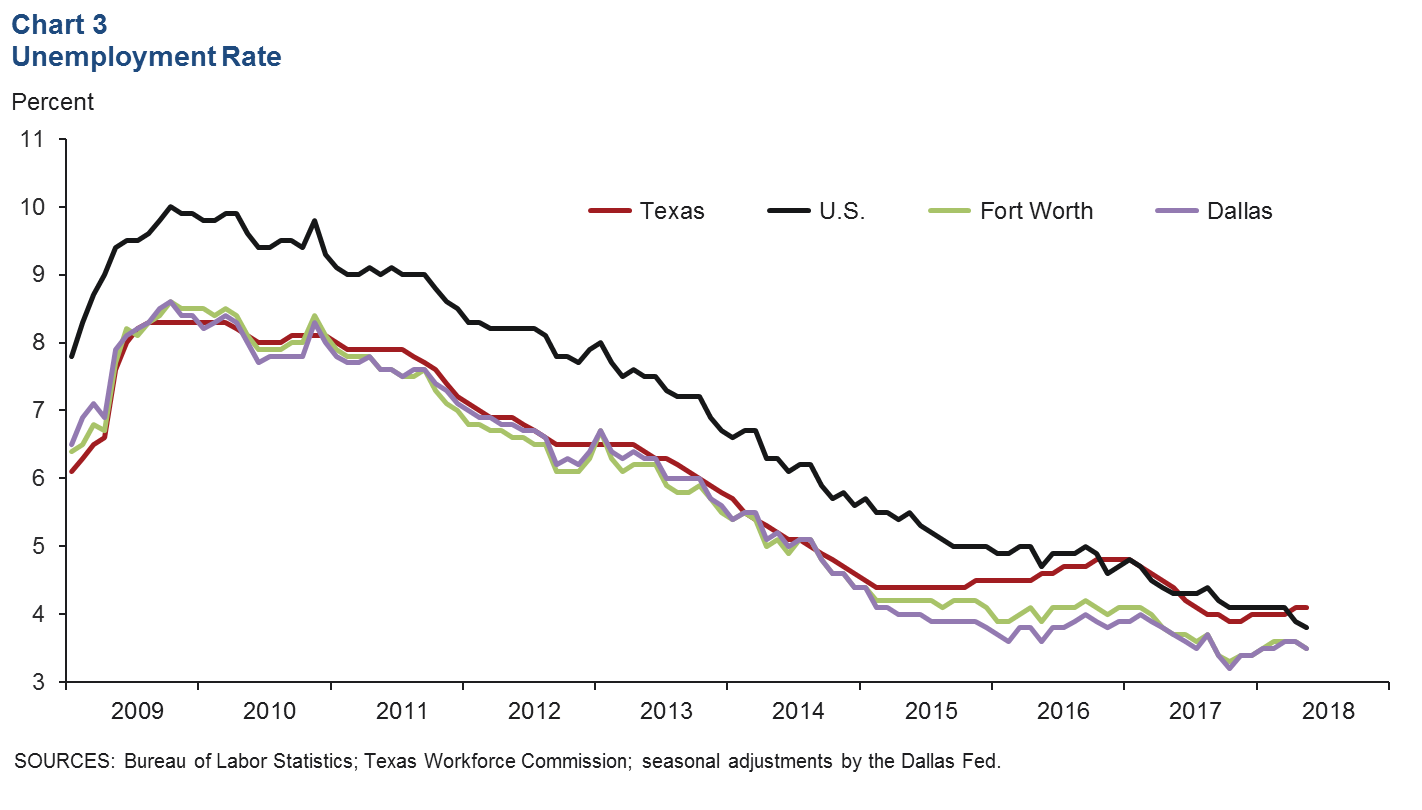
The labor market remained tight. The jobless rate in Dallas and Fort Worth dipped to 3.5 percent in May, a low level not seen consistently since the high-tech boom (Chart 3). Unemployment in both metros remains lower than the state and U.S. rates. Unemployment held steady at 4.1 percent in Texas but edged down to 3.8 percent in the U.S.
Business-Cycle Indexes
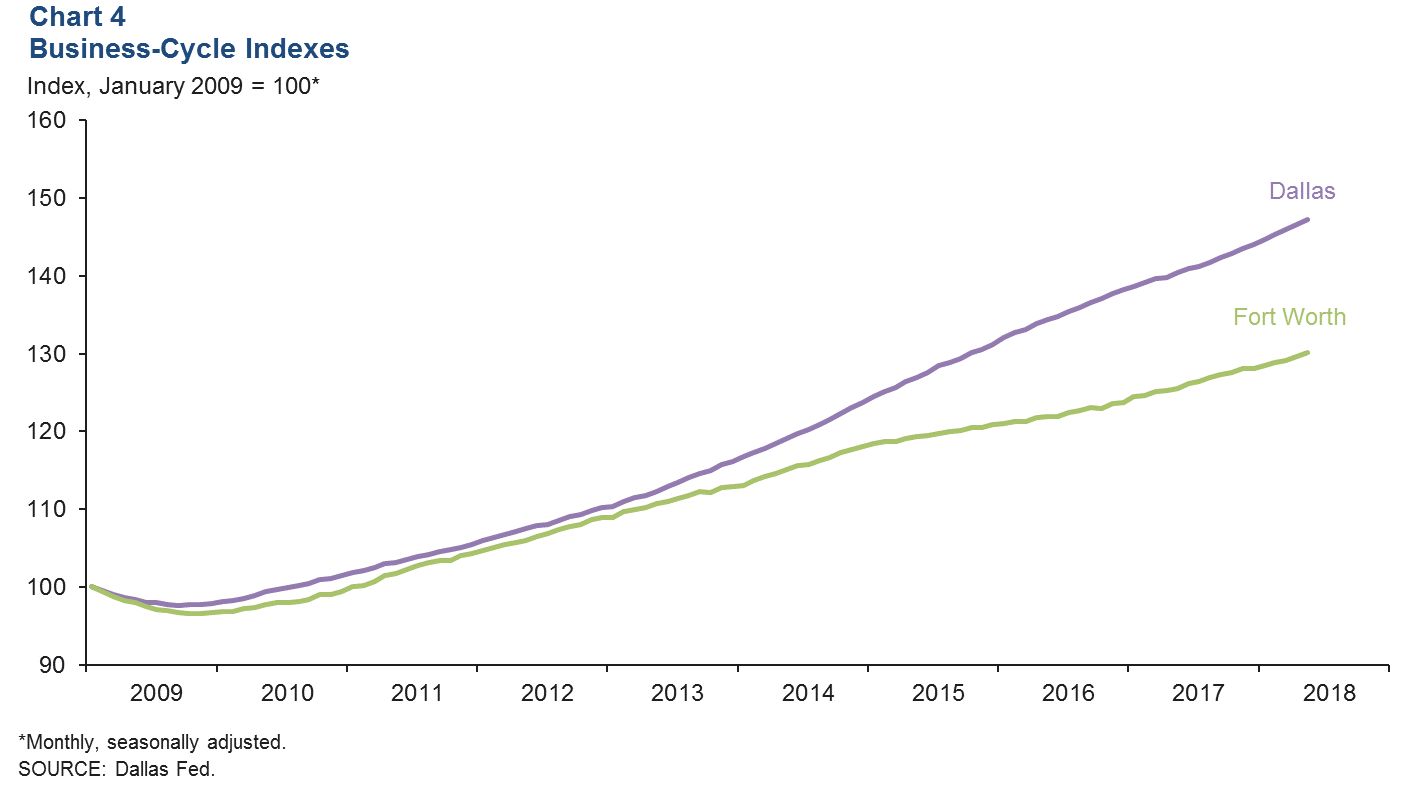
Growth in the Dallas and Fort Worth business-cycle indexes remained strong in May, supported by solid job growth and low unemployment in the metroplex (Chart 4). The Dallas index expanded an annualized 5.5 percent in May, following April’s 6.0 percent increase. Growth in the Fort Worth index came in at 4.8 percent, faster than April’s 4.1 percent rate. Expansion in both indexes was above their long-term averages. Year over year in May, the Dallas index was up 4.9 percent, and the Fort Worth index rose 3.6 percent.
Housing Market
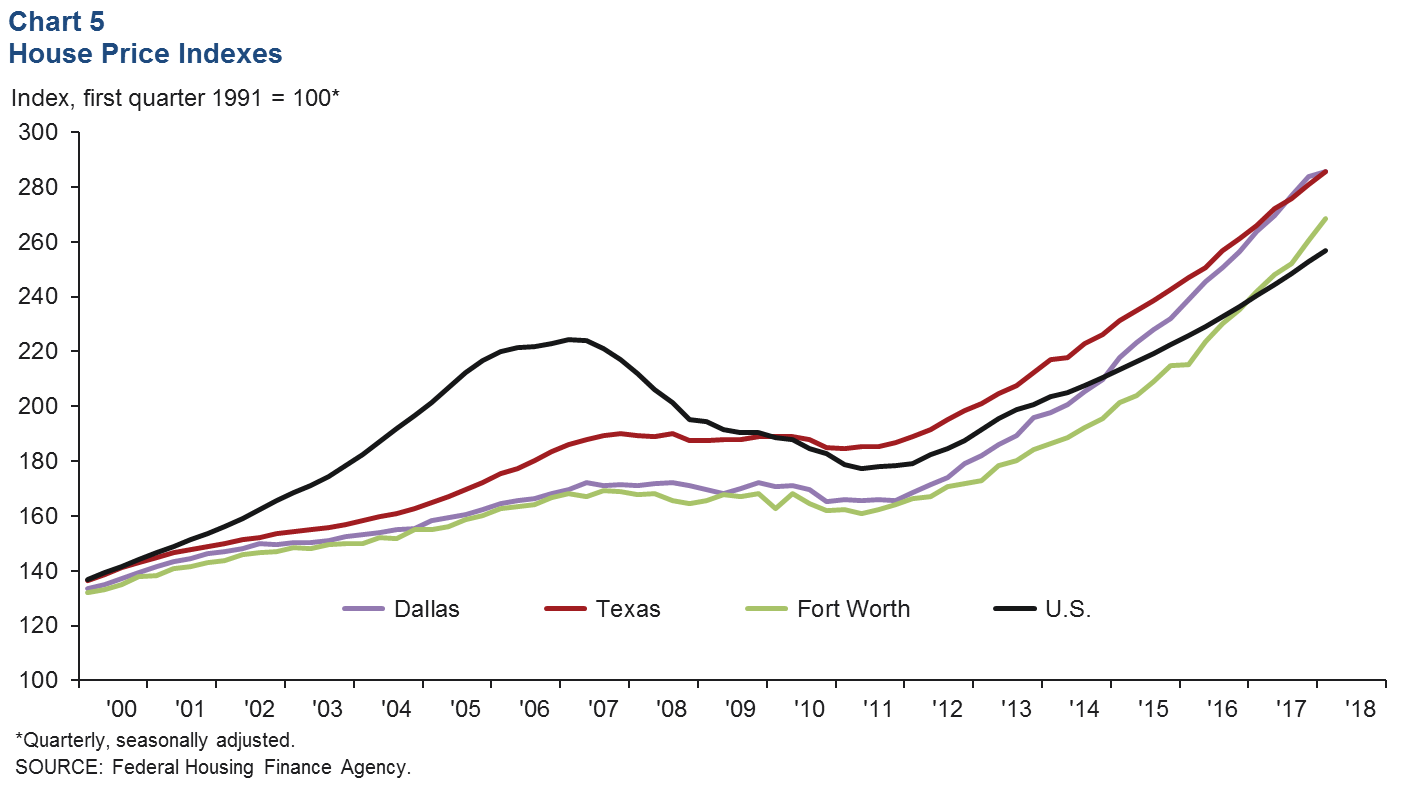
Home Prices Climb Further
DFW home prices continued to rise in first quarter 2018, but gains in Dallas lagged the nation’s increase for the first time in four years (Chart 5). Prices rose 0.6 percent in Dallas in the first quarter, slower than the state’s and nation’s 1.7 percent gain each, according to the Federal Housing Finance Agency purchase-only house price index. Conversely, prices in Fort Worth rose 3.0 percent, eclipsing growth at the state and national level. On a year-over-year basis, prices were up 8.3 percent in Dallas and 11.0 percent in Fort Worth—both faster than the Texas rate of 7.4 percent and the nation’s 6.9 percent figure. Continued healthy job creation and tight home inventories have propelled price increases in the area.
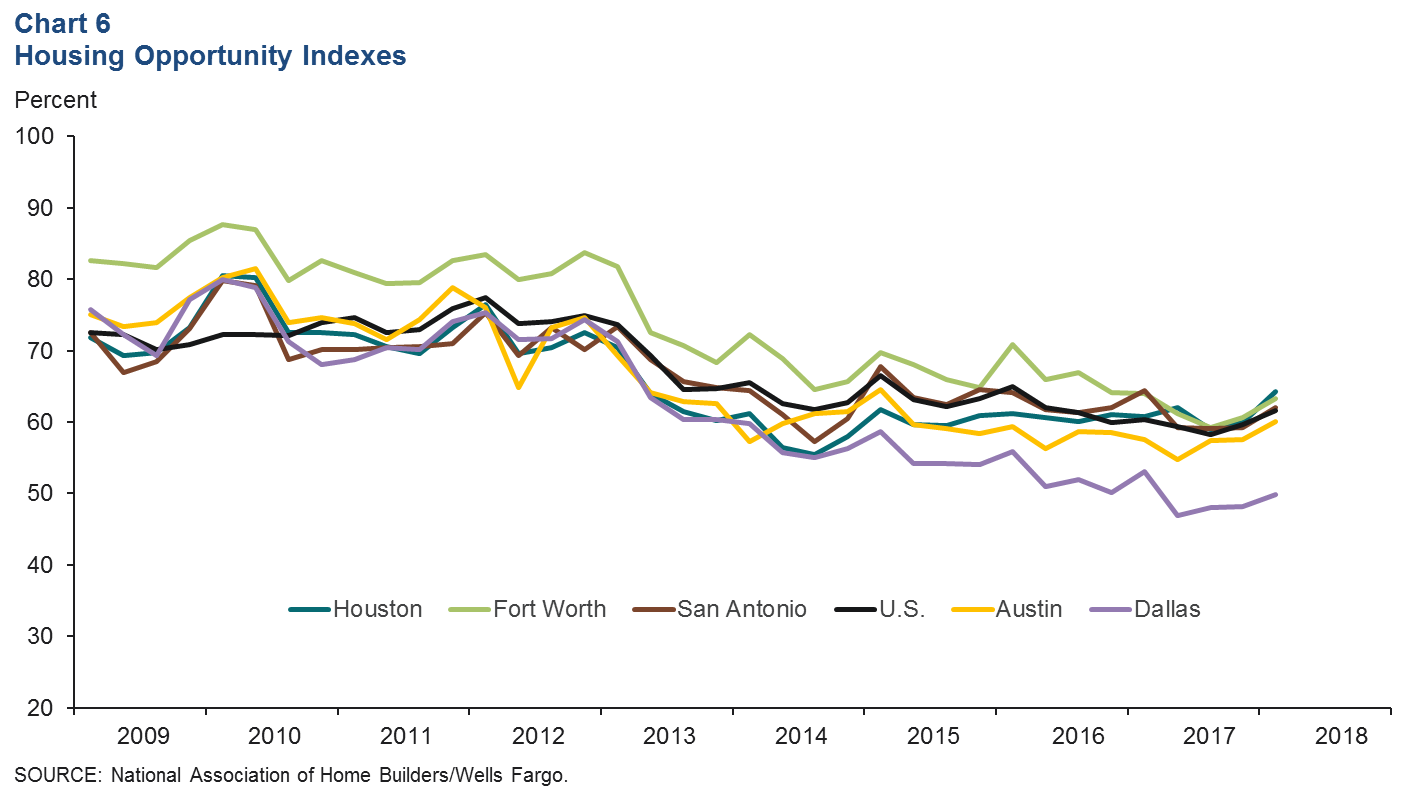
Affordability in Dallas Remains Low
Housing affordability remains low due to record home-price appreciation in the metroplex, particularly in Dallas, following the Great Recession. According to the National Association of Home Builders/Wells Fargo Housing Opportunity indexes, half of the homes (new and existing) sold in Dallas in first quarter 2018 were affordable for a median-income family (Chart 6). This is well below the national figure of 61.6 percent. Affordability has been declining in Dallas since 2010. Despite having a lower median home sales price than Austin, Dallas has the lowest affordability among major Texas metros. Affordability in Fort Worth improved in the first quarter, with the percentage of homes sold that the median-income family could afford rising to 63.3 percent from 60.7 percent in fourth quarter 2017.
NOTE: Data may not match previously published numbers due to revisions.
About Dallas–Fort Worth Economic Indicators
Questions can be addressed to Laila Assanie at laila.assanie@dal.frb.org. Dallas–Fort Worth Economic Indicators is published every month on the Tuesday after state and metro employment data are released.