Dallas-Fort Worth Economic Indicators

The Dallas–Fort Worth economy continued its expansion in January. Job growth was moderate, and the Dallas Business-Cycle Index rose. However, the Fort Worth Business-Cycle Index fell following robust growth in 2018. Revised data indicate that DFW employment grew 2.5 percent in 2018—above its long-term average rate. Home-price appreciation has decelerated, and housing affordability remains low in Dallas. Home inventories ticked up in January.
Labor Market
Job Growth Moderates
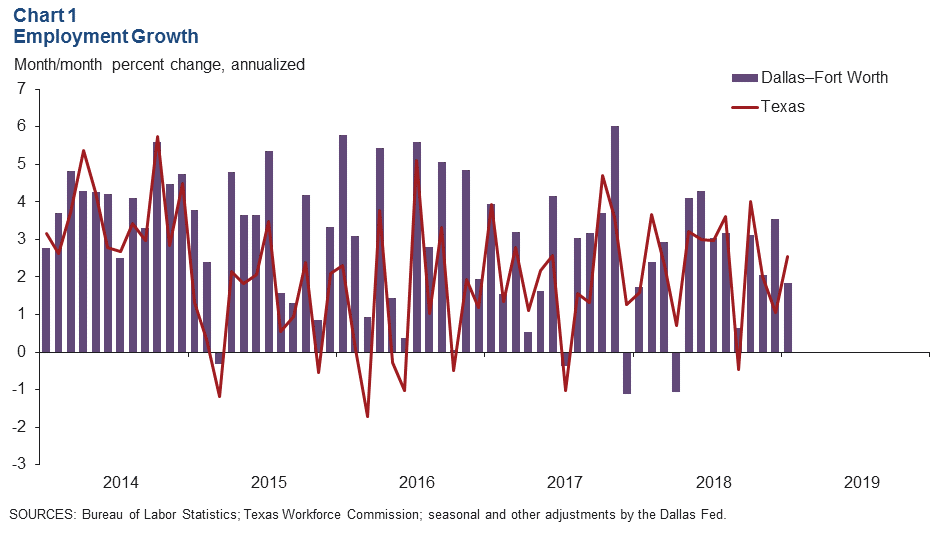
DFW employment expanded an annualized 1.8 percent in January, and growth for December was revised down to 3.5 percent (Chart 1). Payrolls rose 4.8 percent (10,500 jobs) in Dallas but contracted 5.3 percent (4,800 jobs) in Fort Worth. Unemployment rose to 3.7 percent in Dallas and 4.0 percent in Fort Worth in January.
Benchmarked Data Indicate Solid Job Gains in 2018
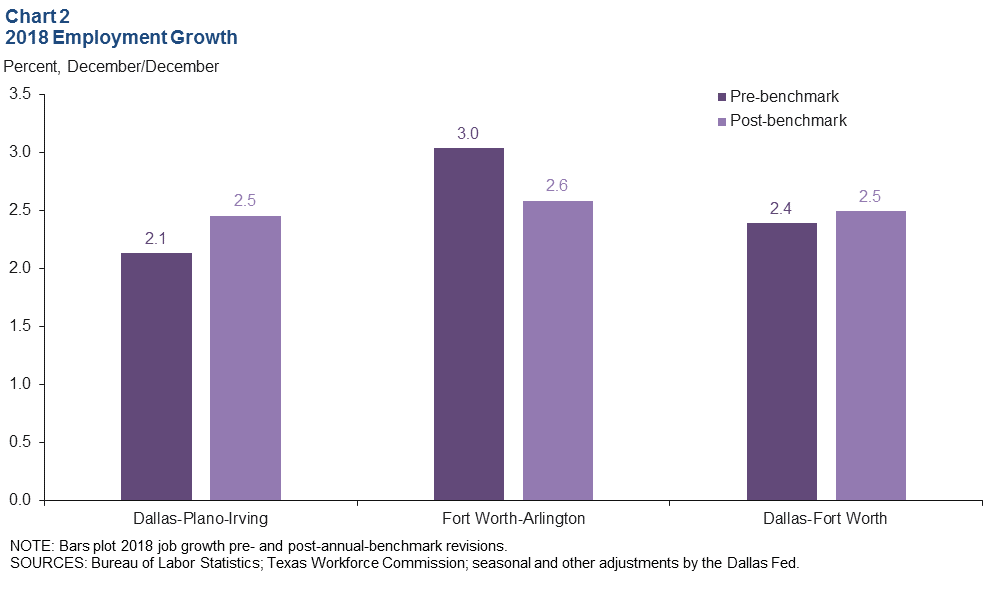
With the Bureau of Labor Statistics’ annual benchmark revisions, DFW job growth was revised up to 2.5 percent from its previous estimate of 2.4 percent in 2018 (Chart 2). In the Dallas–Plano–Irving metropolitan division, employment grew by 2.5 percent last year—faster than its earlier estimate of 2.1 percent. Meanwhile, job gains in Fort Worth–Arlington were revised down from 3.0 percent to 2.6 percent—still above their long-term average pace.
Business-Cycle Indexes
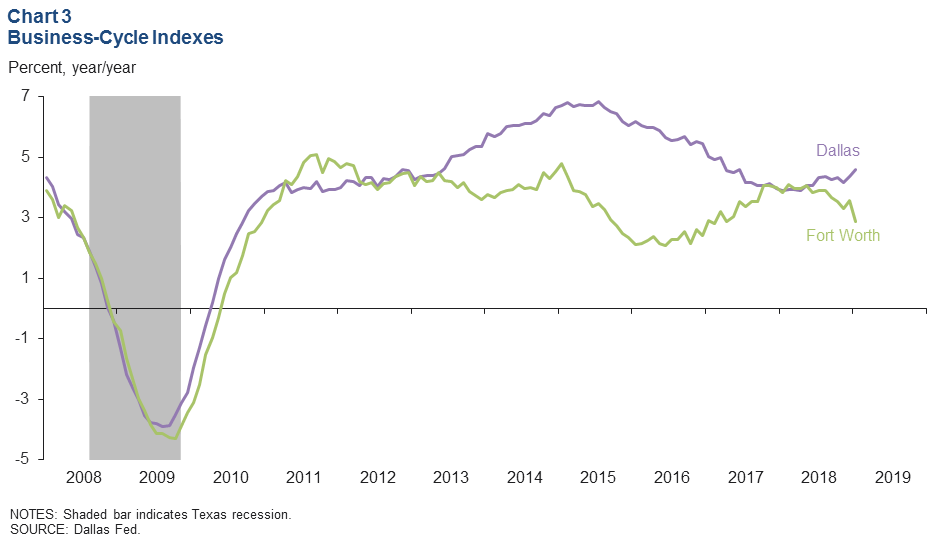
The Dallas Business-Cycle Index strengthened in January as job growth improved (Chart 3). The Dallas index rose an annualized 5.7 percent in January, quicker than December’s 4.6 percent rate. Due to declining payrolls and rising unemployment in January, the Fort Worth index fell 3.4 percent, following December’s 3.9 percent increase. Year-over-year growth in both indexes is in line with or above its long-term average.
Housing
Home-Price Appreciation Slows
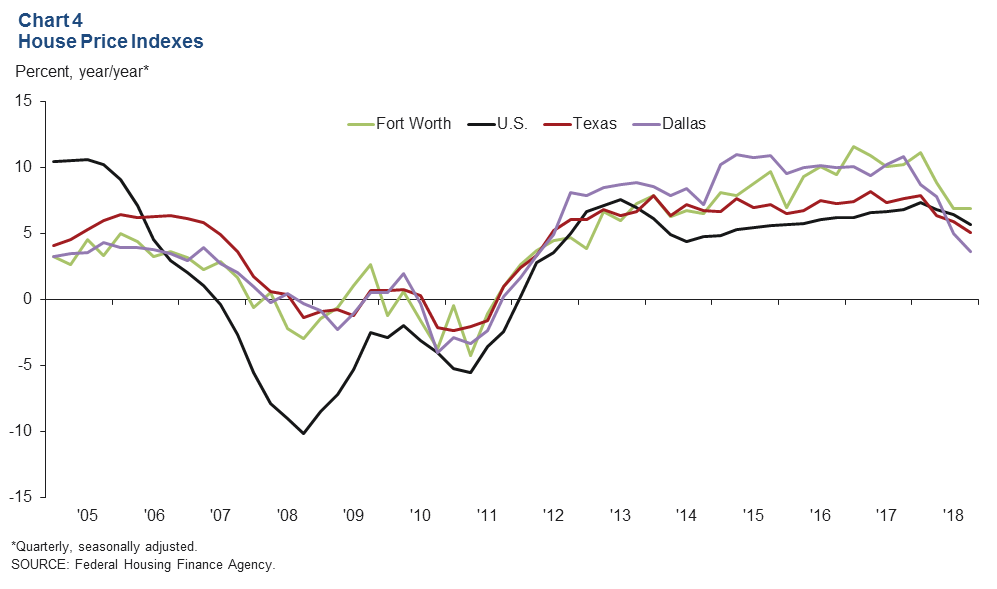
DFW home prices rose at year-end 2018 as continued job creation and tight home inventories propelled increases in the area. House prices rose 1.1 percent in Dallas and 2.4 percent in Fort Worth in the fourth quarter, according to the Federal Housing Finance Agency’s house price purchase-only index. On a year-over-year basis, prices were up 3.6 percent in Dallas—slower than the Texas rate of 5.1 percent and the nation’s 5.7 percent (Chart 4). Conversely, an annual increase of 6.9 percent in Fort Worth is ahead of both the state and national figures. Home-price appreciation in the metroplex has slowed from its torrid pace in 2015–17, when prices in both Dallas and Fort Worth rose by 10 percent annually.
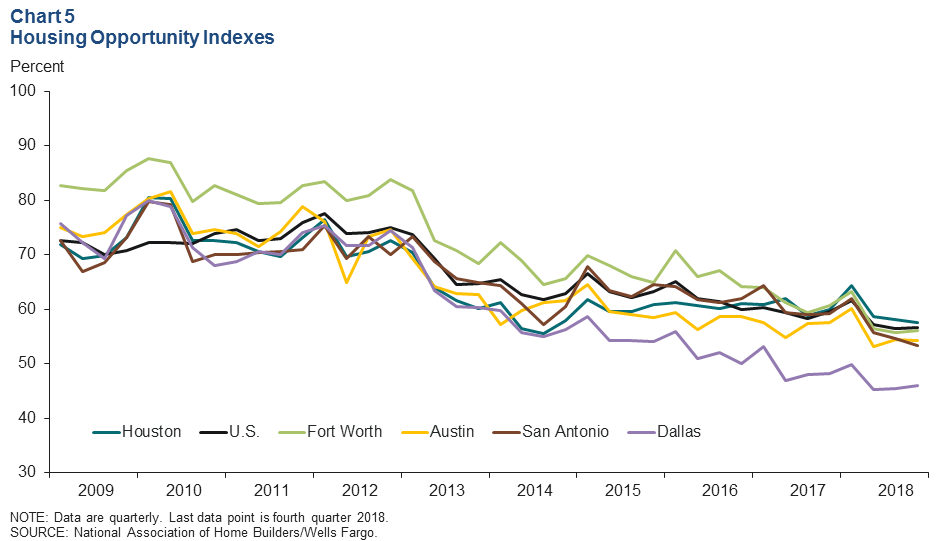
Housing Affordability in Dallas Stays near Record Low
Housing affordability in Dallas has reached historic lows, according to the National Association of Home Builders/Wells Fargo Housing Opportunity indexes. Only 46 percent of the homes (new and existing) sold in Dallas in the fourth quarter were affordable for the median-income family—nearly unchanged from 45.5 percent in the third quarter (Chart 5). This is well below the national figure of 56.6 percent. Housing affordability in Dallas is the lowest among major Texas metros, including Austin, which has a slightly higher median sales price; affordability in Dallas was eight percentage points lower than Austin. Affordability in Fort Worth stood at 56 percent at the end of 2018, similar to other major Texas metros.
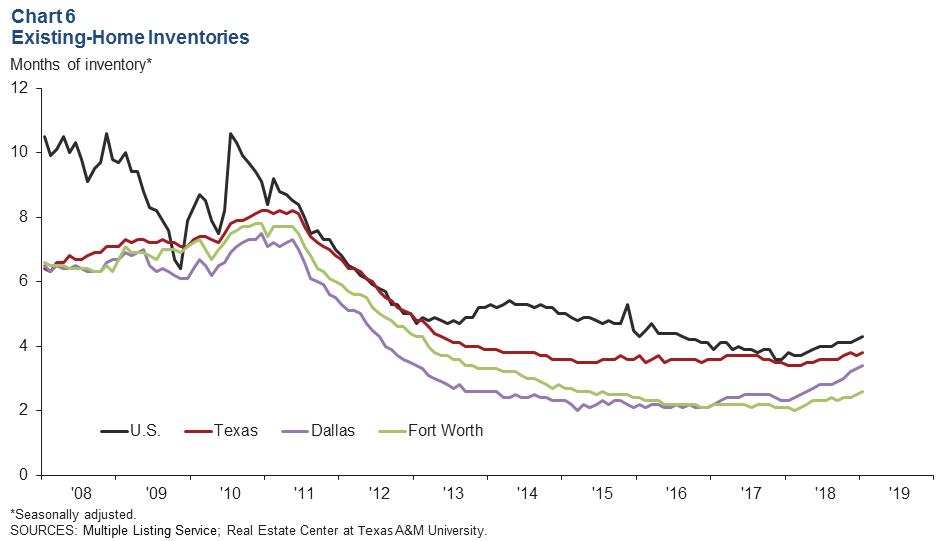
Home Inventories Edge Up
DFW existing-home inventories continued to be tight and well below the six months’ supply typically associated with a balanced market. In January, overall inventories edged up to 3.4 months in Dallas and 2.6 months in Fort Worth but remained below U.S. and Texas levels (Chart 6). Inventories of entry-level homes (those priced below $200,000) were the tightest at 1.6 months of supply. Inventories of mid-priced homes ($300,000–$499,999) were also low but have been inching up since early 2018.
NOTE: Data may not match previously published numbers due to revisions.
About Dallas–Fort Worth Economic Indicators
Questions can be addressed to Laila Assanie at laila.assanie@dal.frb.org. Dallas–Fort Worth Economic Indicators is published every month on the Tuesday after state and metro employment data are released.