Dallas-Fort Worth Economic Indicators

Dallas–Fort Worth economic growth continued in May. Payroll employment rose, and unemployment remained at a 20-year low. The Dallas and Fort Worth business-cycle indexes expanded further. Home prices rose in the first quarter, and housing affordability improved, likely due to a drop in mortgage rates.
Labor Market
Payroll Expansion Continues
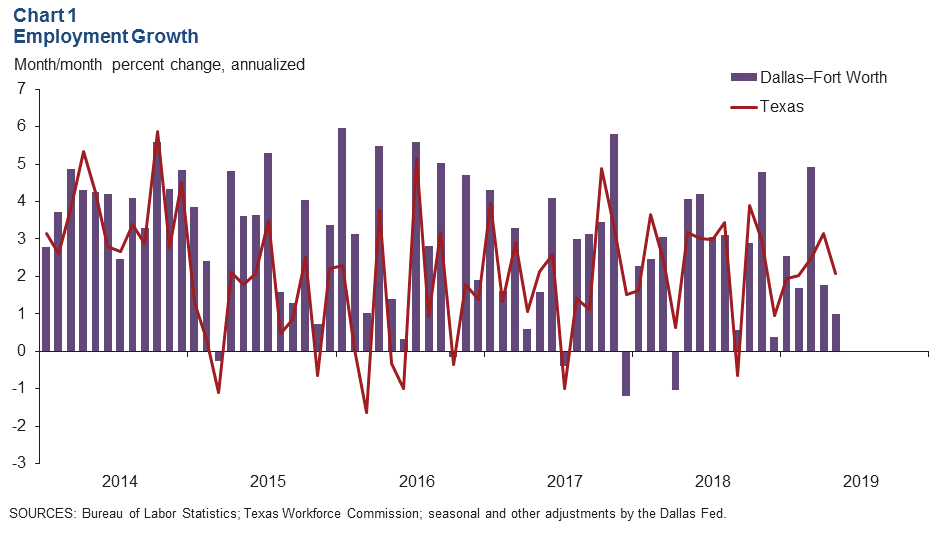
DFW employment rose an annualized 1.0 percent in May, and job growth in April was revised up to 1.8 percent (Chart 1). Payroll expansion slowed to 1.1 percent in Dallas, and employment grew 0.8 percent in Fort Worth following a decline in April. Through May, Dallas has added jobs at a 3.7 percent annual rate (40,290 jobs), while employment in Fort Worth has edged down 0.8 percent (3,690 jobs).
Unemployment Remains at Two-Decade Low
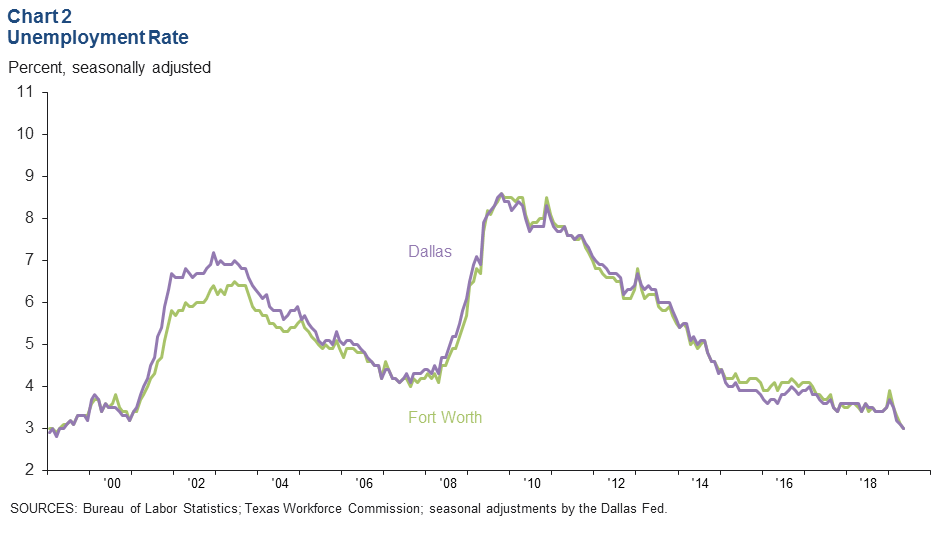
The labor market continues to be tight, with unemployment in Dallas and Fort Worth at its lowest level since spring 1999. The unemployment rate dipped to 3.0 percent in Dallas and Fort Worth (Chart 2). Jobless rates in both metros remained below the state rate, which hit a record low of 3.5 percent last month. U.S. unemployment held steady at a five-decade low of 3.6 percent.
Business-Cycle Indexes
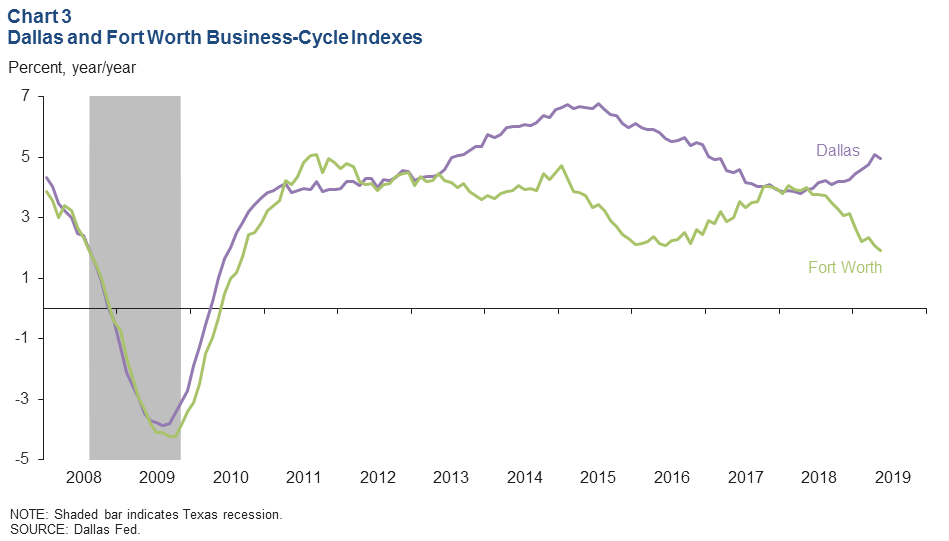
The Dallas and Fort Worth business-cycle indexes expanded in May. The Dallas index rose an annualized 4.2 percent in May, slower than April’s 6.1 percent rate. The Fort Worth index edged up 1.7 percent after dipping in April. The two metropolitan divisions’ indexes followed similar patterns from late 2017 through mid-2018 before diverging, in part due to stronger job growth in Dallas (Chart 3). The Dallas index expanded 5 percent year over year in May—more than double the pace of growth seen in the Fort Worth index.
Housing
Single-Family Construction Rises
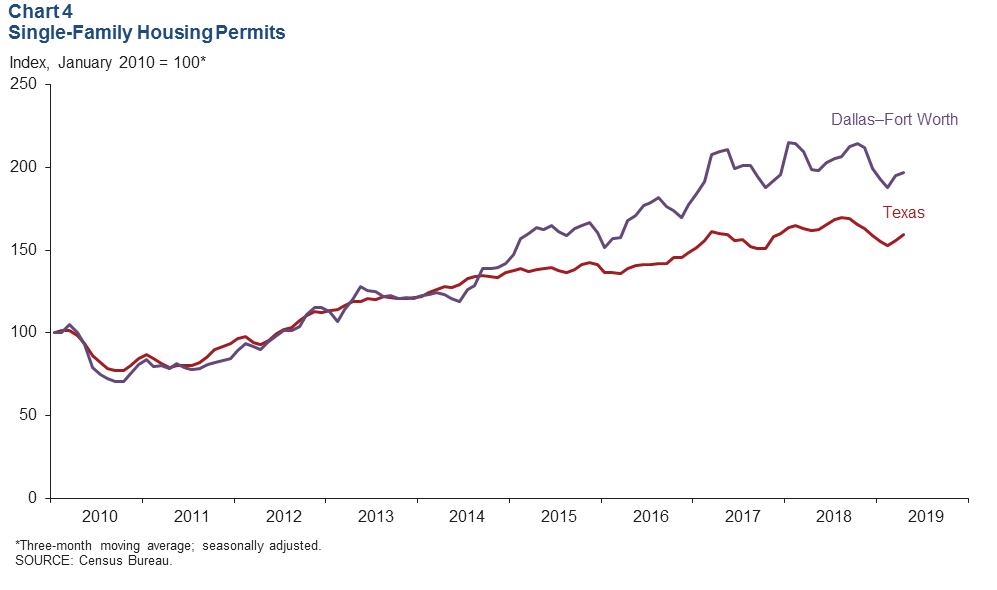
Homebuilding continues to expand in the metroplex, buoyed by housing demand. DFW single-family housing permits rose for the second straight month in April, and the three-month moving average also shows continued growth (Chart 4). Through April, total single-family permits issued were trailing issuance for the same period last year by 5.3 percent in DFW and 3.9 percent in Texas. DFW single-family permit growth decelerated to 3.4 percent last year after growing 15.8 percent in 2017.
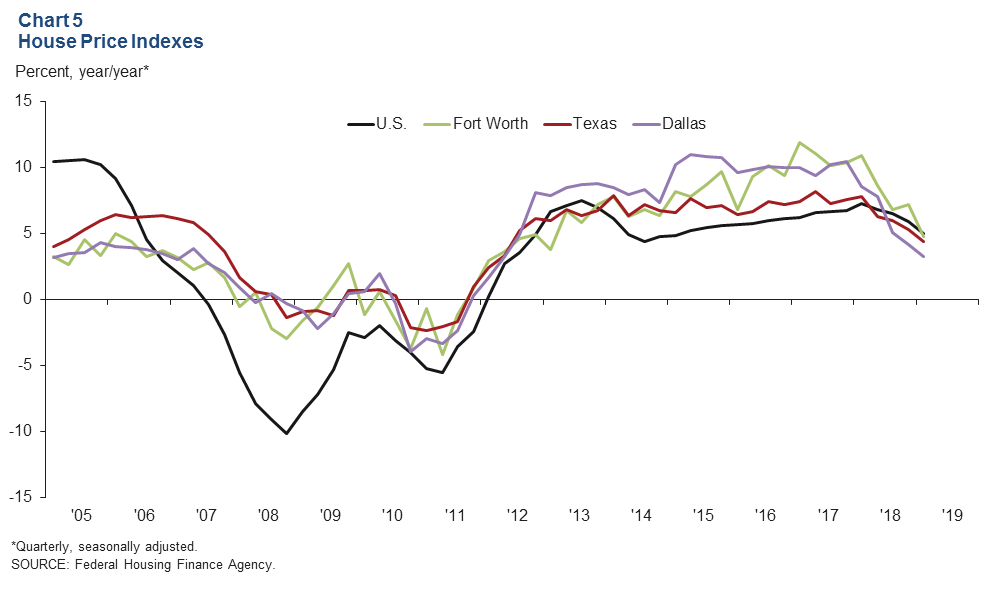
Home Price Appreciation Decelerates
DFW home prices rose in the first quarter as continued solid job creation and tight home inventories propelled increases. House prices rose 0.3 percent in Dallas and 0.8 percent in Fort Worth in the first quarter, according to the Federal Housing Finance Agency’s house price purchase-only index. On a year-over-year basis, prices were up 3.3 percent in Dallas and 4.8 percent in Fort Worth—slower than the nation’s 5.1 percent increase (Chart 5). Home-price appreciation in the metroplex has slowed from its torrid pace in 2015–17, when prices in both Dallas and Fort Worth rose by 10 percent annually.
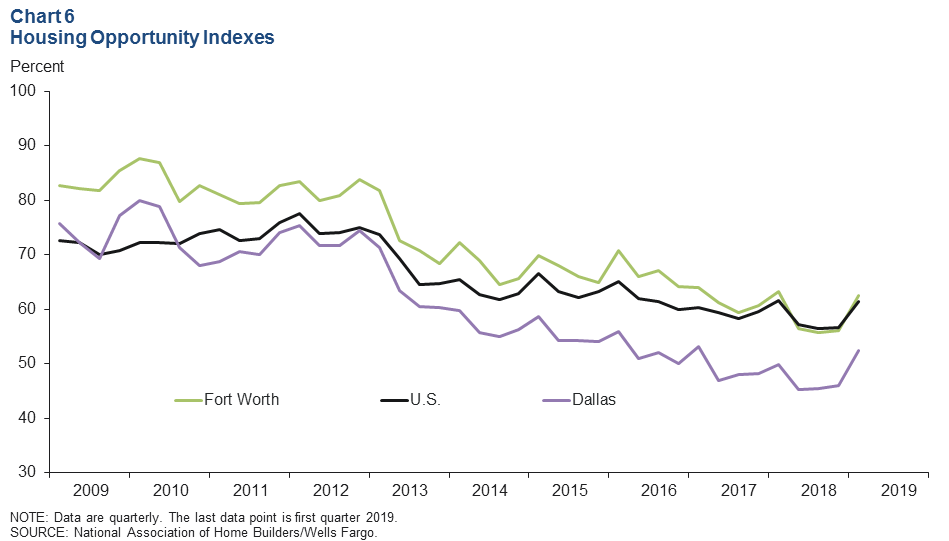
Housing Affordability Improves
Housing affordability improved in all major Texas metros and the U.S. in first quarter 2019, according to the National Association of Home Builders/Wells Fargo Housing Opportunity Indexes. Just over half (52 percent) of new and existing homes sold in Dallas in the first quarter were affordable for the median-income family—up from 46 percent in the fourth quarter (Chart 6). Affordability in Dallas remains well below the national figure of 61.4 percent. Housing affordability in Dallas is the lowest among major Texas metros, including Austin, which has a slightly higher median sales price. Affordability in Dallas was 12 percentage points lower than in Austin and 8 percentage points below Houston and San Antonio. Affordability in Fort Worth stood at 62.5 percent in the first quarter, similar to the U.S. and most other major Texas metros.
NOTE: Data may not match previously published numbers due to revisions.
About Dallas–Fort Worth Economic Indicators
Questions can be addressed to Laila Assanie at laila.assanie@dal.frb.org. Dallas–Fort Worth Economic Indicators is published every month on the Tuesday after state and metro employment data are released.