Dallas-Fort Worth Economic Indicators

January 3, 2020
Dallas–Fort Worth economic growth remained on track in November. Payroll employment grew at a rapid clip, and unemployment stayed low. The Dallas and Fort Worth business-cycle indexes expanded at an above-average pace. Housing market indicators suggest steady home-price appreciation and continued homebuilding activity. Home inventories remained tight, particularly at the lower price points.
Labor Market
Payrolls Expansion Robust
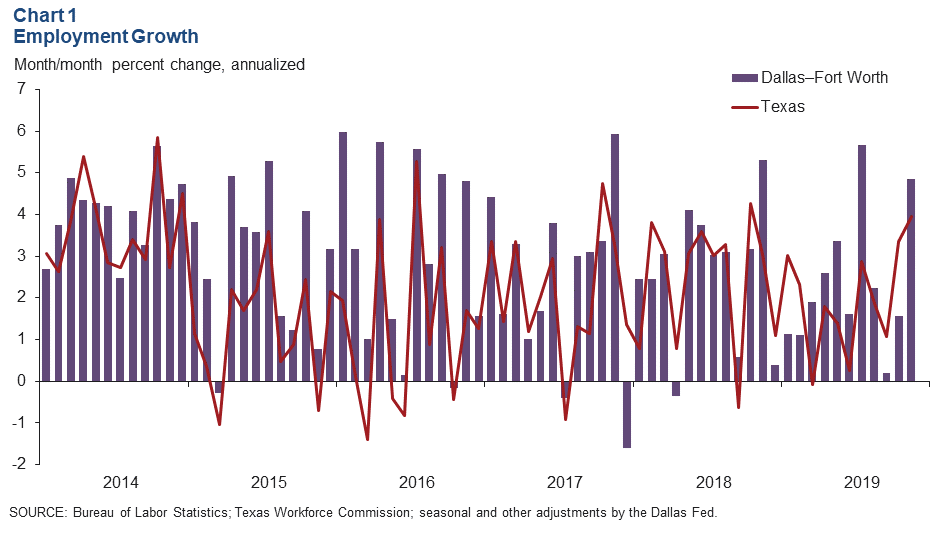
DFW employment rose an annualized 4.8 percent in November (Chart 1). Payroll expansion moderated to 1.8 percent in Dallas, while employment grew 12.8 percent in Fort Worth after declining for three months. Through November, Dallas has added jobs at a 2.2 percent annual rate, and Fort Worth employment has grown 2.8 percent.
Unemployment Remains Low
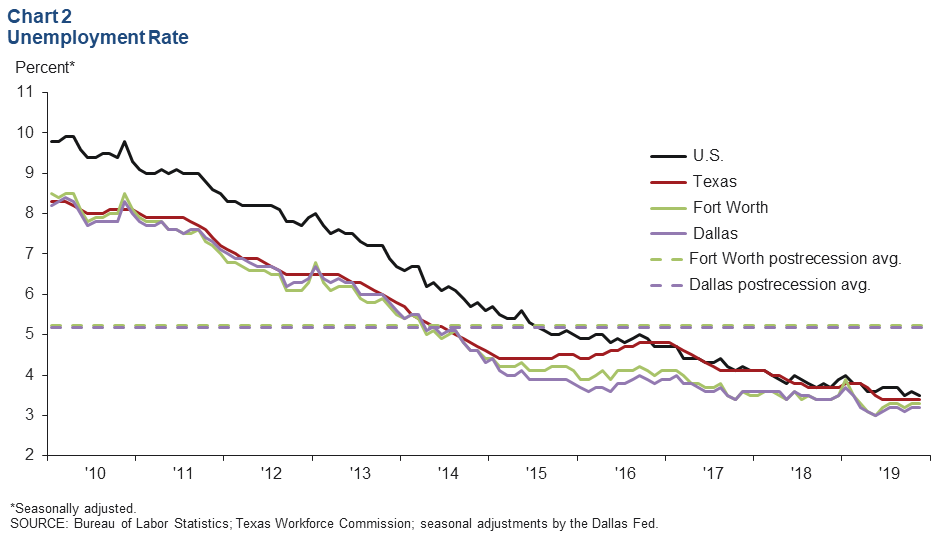
The DFW labor market continued to be tight, with unemployment close to multiyear lows. In November, the unemployment rate remained at 3.2 percent in Dallas and 3.3 percent in Fort Worth (Chart 2). Unemployment remains below the state and U.S. rates.
Business-Cycle Indexes
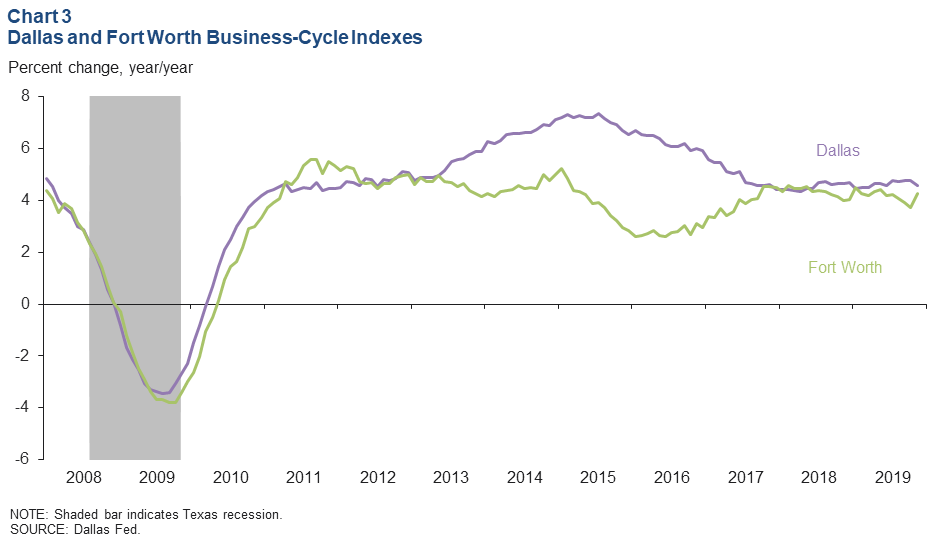
Expansion in the Dallas and Fort Worth business-cycle indexes continued in November, supported by strong job growth. The Dallas index rose an annualized 4.4 percent, slightly slower than October’s rate. Growth in the Fort Worth index was strong at 11.1 percent. Year over year in November, the Dallas index rose 4.6 percent, and the Fort Worth index was up 4.3 percent (Chart 3).
Housing Market
Single-Family Construction Rises
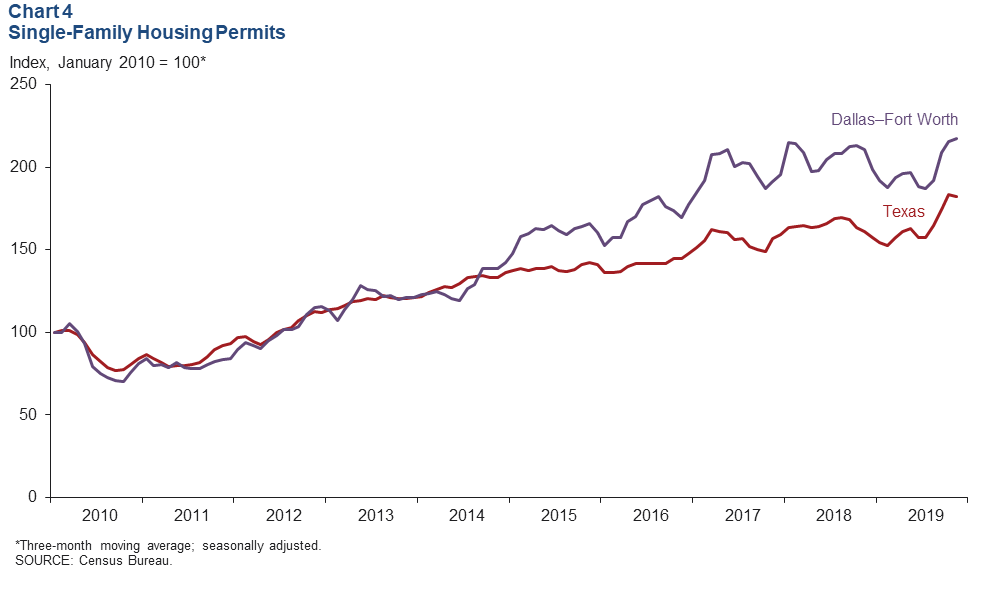
Homebuilding remained active in the metroplex, buoyed by housing demand. DFW single-family housing permits dipped slightly in October and November after rising strongly during the summer, and the three-month moving average showed continued growth (Chart 4). Through November, total single-family permits were trailing issuance for the same period last year by 4.0 percent in DFW but were 1.0 percent higher in Texas. DFW single-family permit growth decelerated to 3.4 percent last year after growing 15.8 percent in 2017.
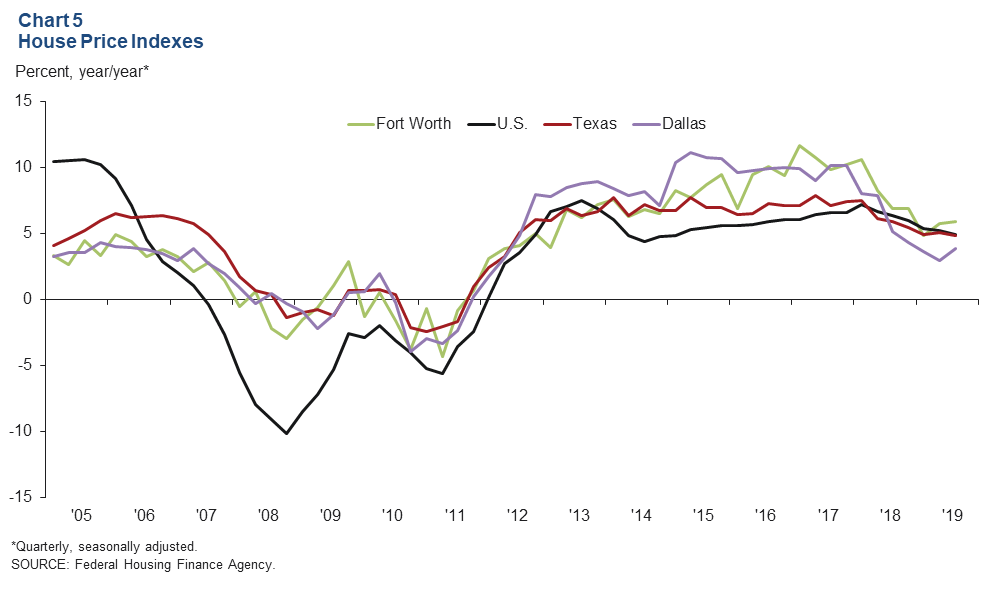
Home-Price Appreciation Holds Steady
DFW home prices rose in the third quarter as solid job creation and tight home inventories propelled increases. House prices rose 1.3 percent in Dallas and 1.2 percent in Fort Worth in the third quarter, according to the Federal Housing Finance Agency’s house price purchase-only index. On a year-over-year basis, prices were up 3.8 percent in Dallas and 5.9 percent in Fort Worth, while U.S. and Texas prices both increased 4.9 percent (Chart 5). Home-price appreciation in the metroplex has slowed from its torrid pace in 2015–17, when prices in both Dallas and Fort Worth rose by 10 percent annually.
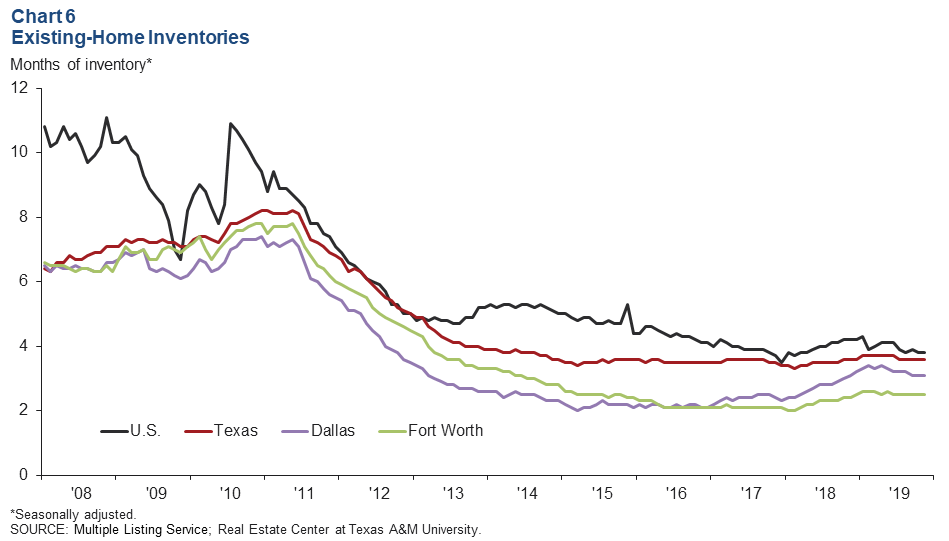
Home Inventories Stay Tight
DFW existing-home inventories remained tight and well below the six months’ supply typically associated with a balanced market. Inventories inched up in 2018 but have been fairly stable this year; in November 2019, they were at 3.1 months in Dallas and 2.5 months in Fort Worth, slightly below the Texas and U.S levels of 3.6 months and 3.8 months, respectively (Chart 6). Inventories of entry-level homes (priced below $200,000) were the tightest around 1.6 months of supply—a level that has changed little the past three years. Inventories of homes priced from $200,000 to $299,999 were just over two months.
NOTE: Data may not match previously published numbers due to revisions.
About Dallas–Fort Worth Economic Indicators
Questions can be addressed to Laila Assanie at laila.assanie@dal.frb.org. Dallas–Fort Worth Economic Indicators is published every month on the Tuesday after state and metro employment data are released.