Dallas-Fort Worth Economic Indicators

February 3, 2022
Dallas–Fort Worth’s economy ended 2021 on a healthy note. Payroll employment rose at a moderate clip, unemployment dipped, and the Dallas and Fort Worth business-cycle indexes advanced in December. Last year, the DFW economy recovered all jobs that were lost in spring 2020. However, COVID data took a turn for the worse as the omicron variant drove up case counts to new highs in mid-January. Dining out also fell below prepandemic levels in January. Demand for industrial space set a record last year, and office leasing activity improved in the fourth quarter, but overall demand remained subdued as tenants continued to downsize and/or reevaluate their space needs.
Labor market
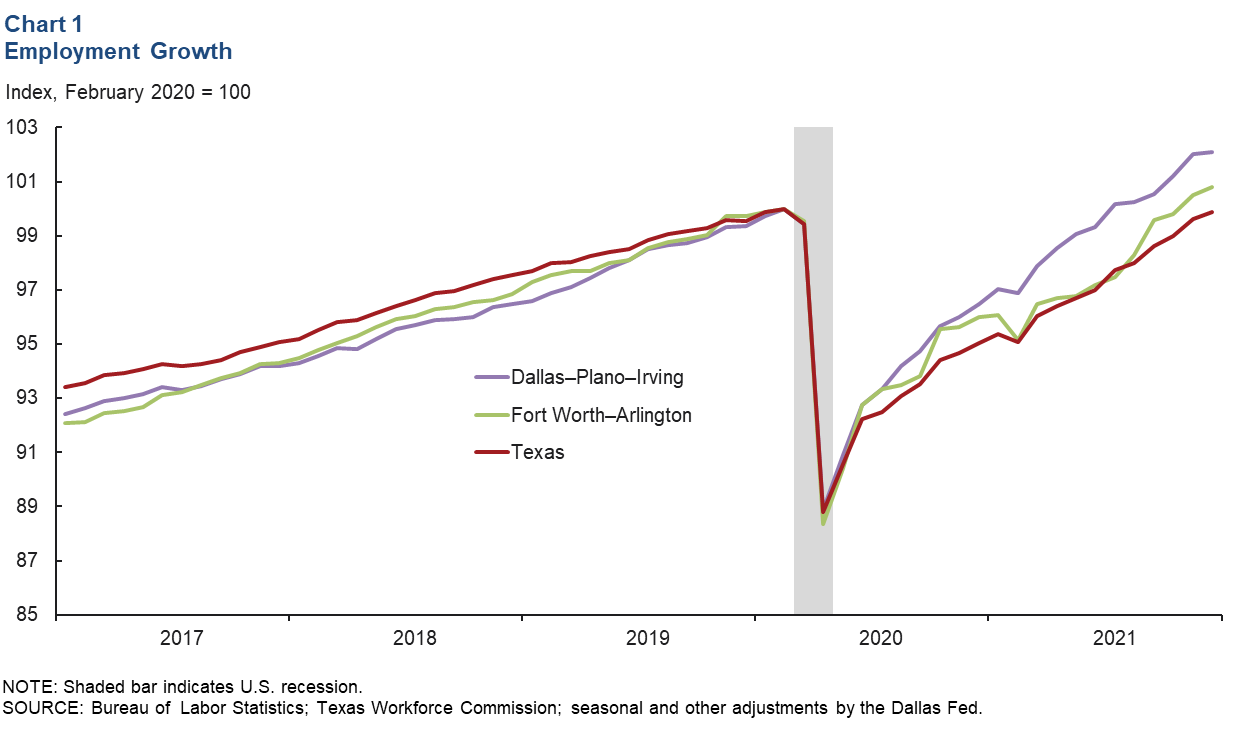
DFW employment rose an annualized 1.5 percent (4,700 jobs) in December, slower than November’s 9.9 percent (30,900 jobs) increase. Growth was mixed, with employment levels in the Dallas–Plano–Irving metro division little changed at an annualized 0.6 percent (1,500 jobs) but up a strong 3.6 percent (3,300 jobs) in Fort Worth–Arlington. At year-end 2021, DFW employment was 1.7 percent above its prepandemic level in February 2020. Employment in the Dallas–Plano–Irving metro division was 2.1 percent above prepandemic levels, and the Fort Worth–Arlington division’s employment was 0.8 percent higher than prepandemic levels (Chart 1). Payrolls in Texas were just shy (-0.1 percent) of their prepandemic high. Unemployment fell in December, with the jobless rate sliding by 0.2 percentage points to 4.1 percent in Dallas, 4.2 percent in Fort Worth and 5.0 percent in Texas.
Business-cycle index
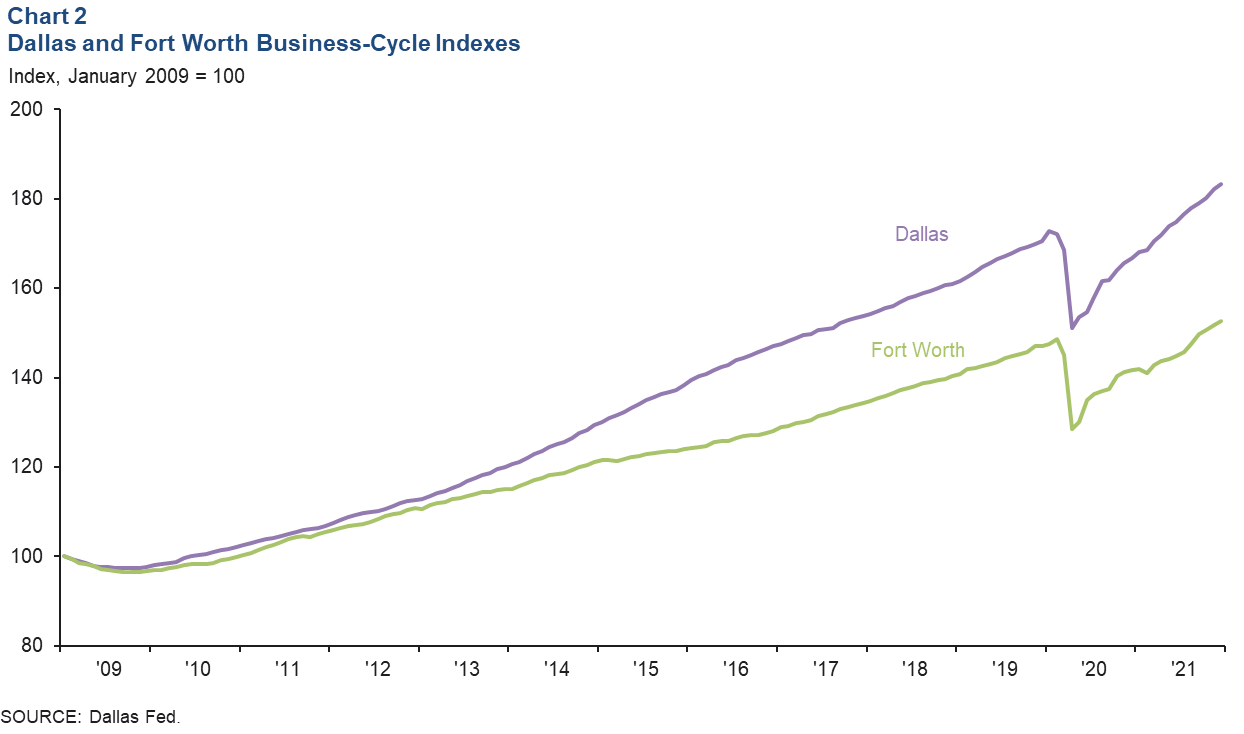
The Dallas and Fort Worth business-cycle indexes continued to expand strongly in December, buoyed by solid job growth and falling unemployment. The Dallas index rose an annualized 7.3 percent, marking the 20th straight month of growth, and was up 6.5 percent from its February 2020 level (Chart 2). The Fort Worth index climbed an annualized 7.3 percent in December, its 10th successive month of expansion, and eclipsed its prepandemic high by 2.7 percent.
COVID-19
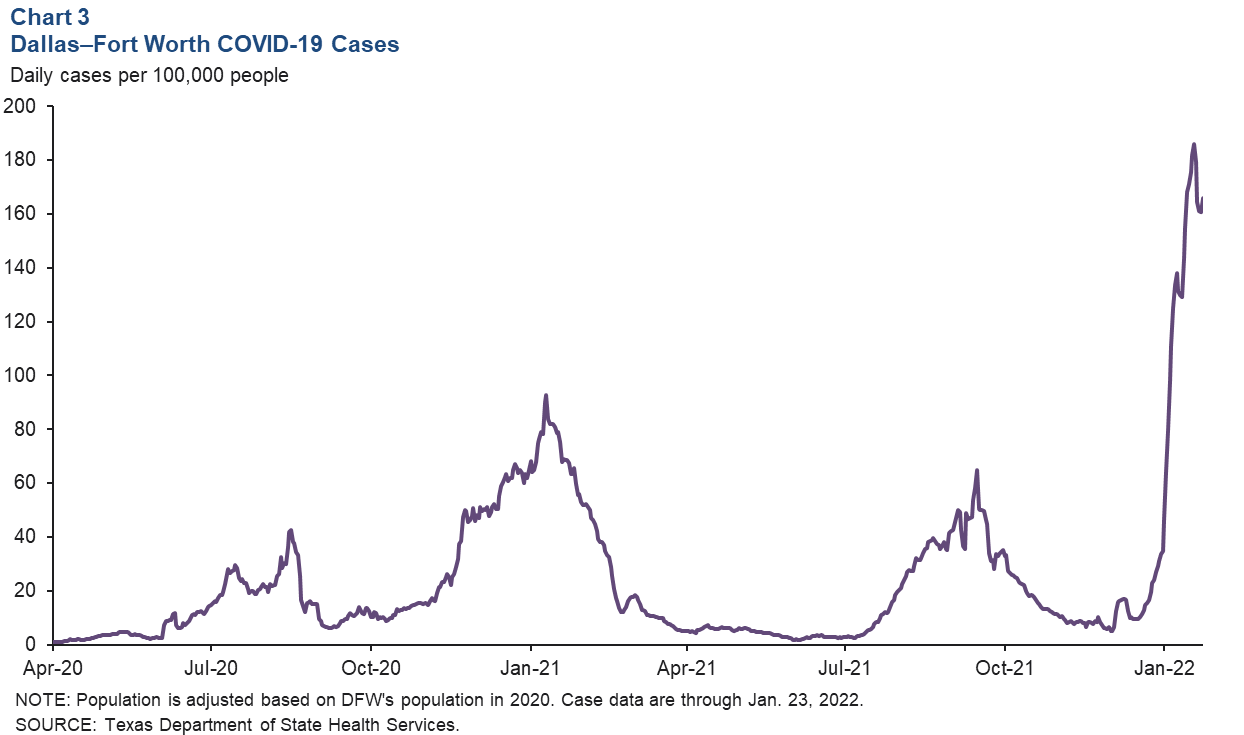
New COVID-19 cases are surging as the omicron variant spreads rapidly through the metroplex. The seven-day average of daily cases per 100,000 residents set a new high of 186 on Jan. 18 (Chart 3). It has since dipped to 166 on Jan. 23. Staff absenteeism is becoming problematic in some industries, such as leisure and hospitality, according to comments from business contacts. The current wave of infections is also impacting schools, with several North Texas school districts having to shut down campuses due to a sizable number of staff being out sick.
Dining out
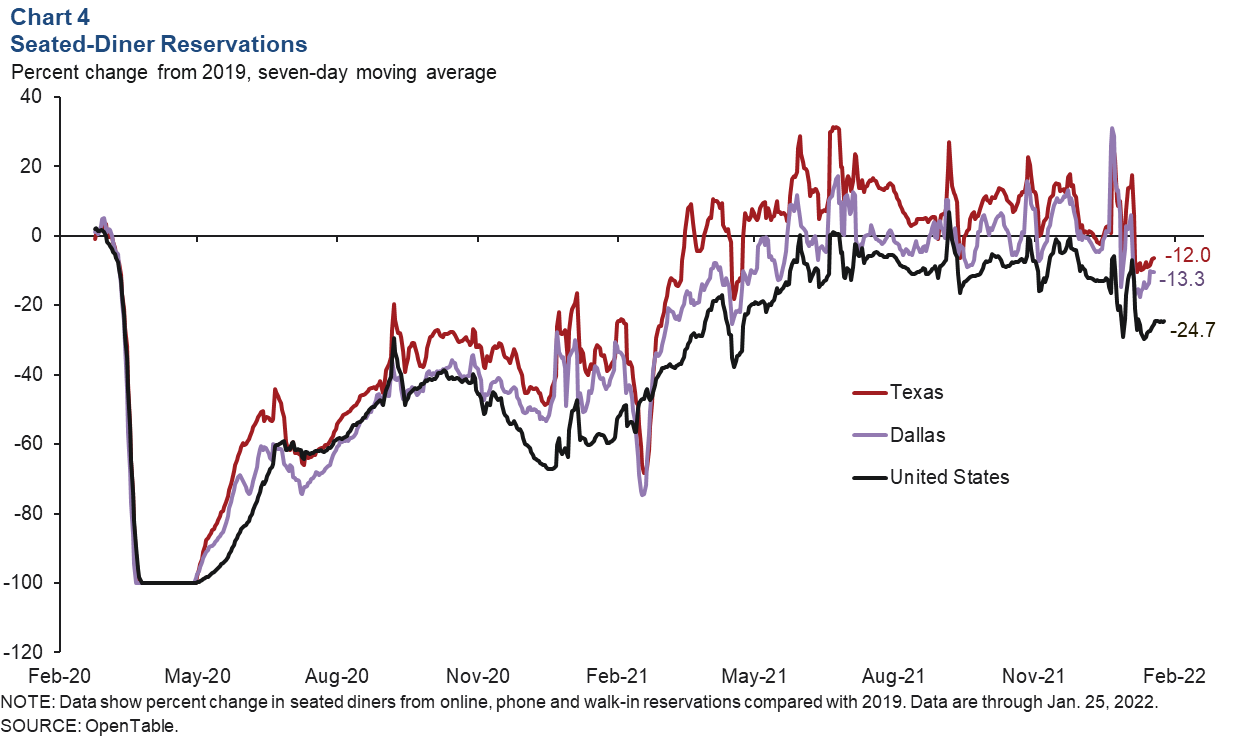
At the start of the new year as the omicron variant surged, the number of seated-diner reservations at restaurants in Dallas turned negative—falling below prepandemic levels. As of Jan. 25, the figures for Dallas, Texas and the U.S. were below 2019 levels by 13.3 percent, 12.0 percent, and 24.7 percent, respectively, based on a seven-day moving average (Chart 4). Barring the recent drop, the Dallas figure has mostly been close to or above prepandemic levels since summer 2021.
Commercial real estate
Office leasing picks up
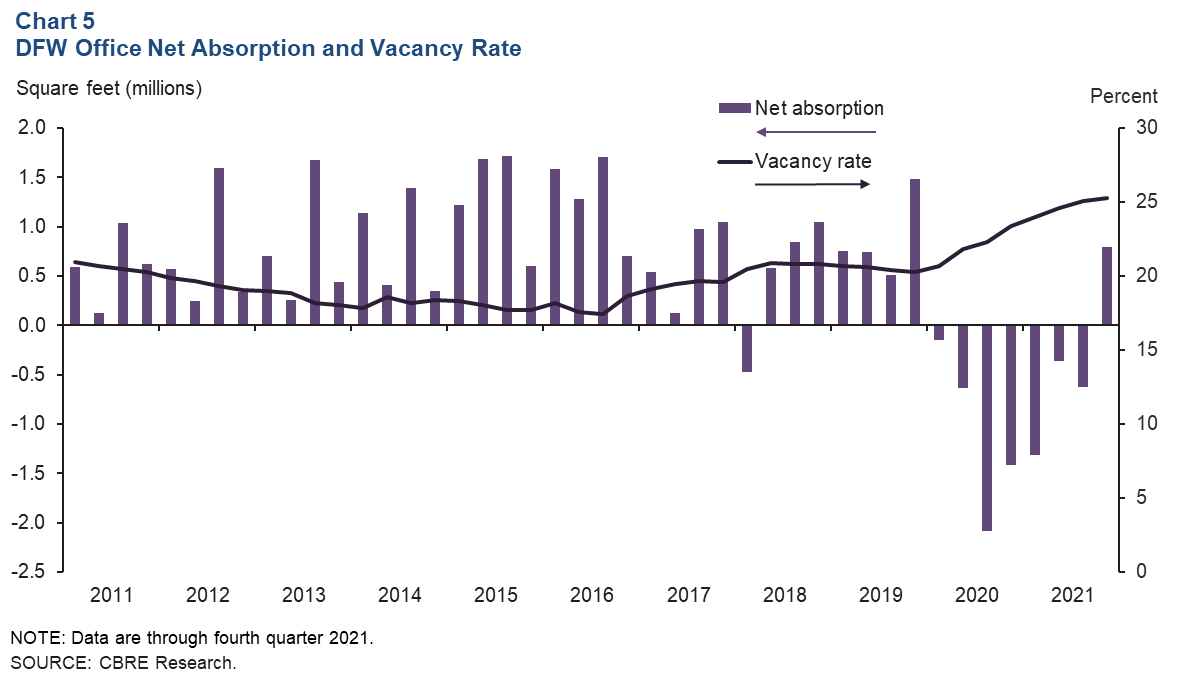
Demand for office space in DFW rose in fourth quarter 2021. Net absorption turned positive for the first time in nearly two years, coming in at just over 790,000 square feet, according to data from CBRE Research (Chart 5). Still, the vacancy rate ticked up to 25.3 percent due to a sizeable amount of new space being delivered. Net absorption last year was -1.3 million square feet. Availability of sublease space edged down to 9 million square feet, or 13.9 percent of total available space, with Class A properties continuing to comprise well over two-thirds of sublease listings. The volume of space under construction rose to 4.4 million square feet. Business contacts expect demand to continue recovering this year.
Boom in industrial activity endures
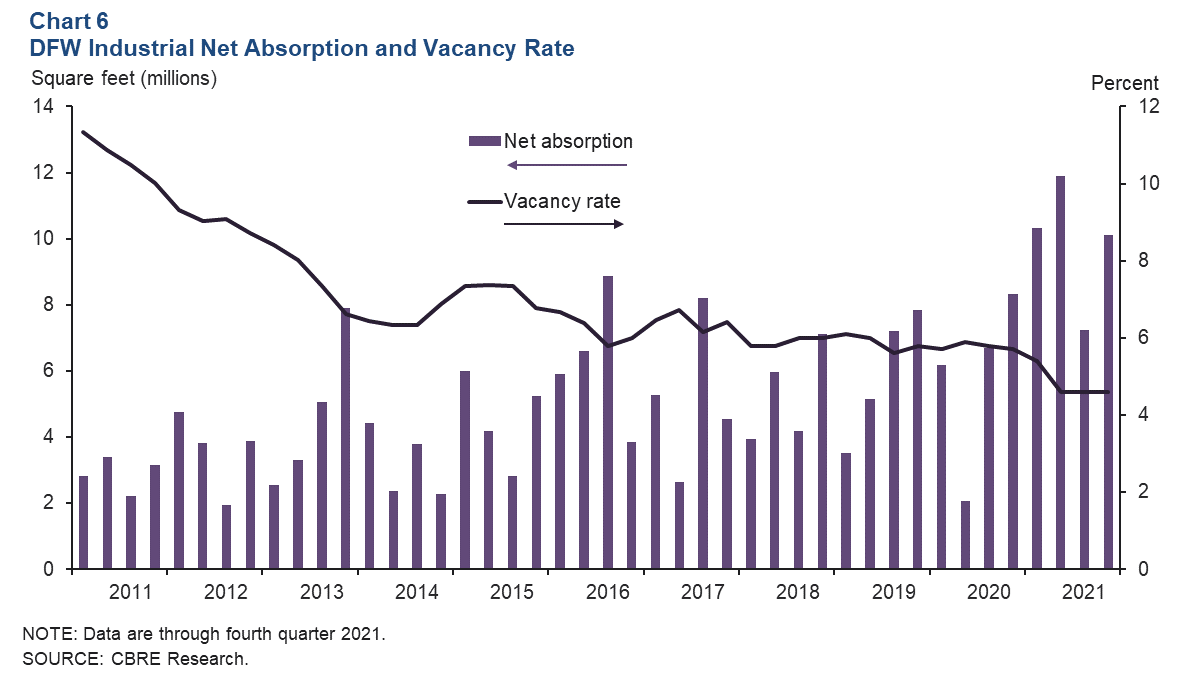
Leasing activity for industrial space stayed relentlessly strong in the fourth quarter, driven by demand from consumer goods, e-commerce, and logistics and manufacturing firms. Net absorption exceeded 10 million square feet in the fourth quarter, bringing the 2021 total to 39.6 million square feet, according to CBRE (Chart 6). Absorption in 2021 eclipsed the previous annual high of 25.3 million in 2016, with DFW the top market nationally for net absorption last year. The vacancy rate held steady at 4.6 percent, sustained by persistent strong demand. The pandemic has boosted online sales growth, which has been a boon to distribution hubs such as DFW. Industrial construction soared from 31.3 million square feet in the third quarter to 54.5 million square feet in the fourth, with DFW again taking the top spot among U.S. metros.
NOTE: Data may not match previously published numbers due to revisions.
About Dallas–Fort Worth Economic Indicators
Questions can be addressed to Laila Assanie at laila.assanie@dal.frb.org. Dallas–Fort Worth Economic Indicators is published every month after state and metro employment data are released.