Dallas-Fort Worth Economic Indicators

June 8, 2022
The Dallas–Fort Worth economy expanded robustly in April. Payroll employment grew swiftly, and unemployment dipped further, bolstering growth in the Dallas and Fort Worth business-cycle indexes. Fourth-quarter benchmark revisions indicate that in 2021, DFW payrolls grew nearly 1 percentage point more than previously estimated. Home sales ticked up in April, and housing affordability improved in the first quarter. DFW population growth picked up in 2021 after slowing in 2020.
Labor market
Employment gains remain robust
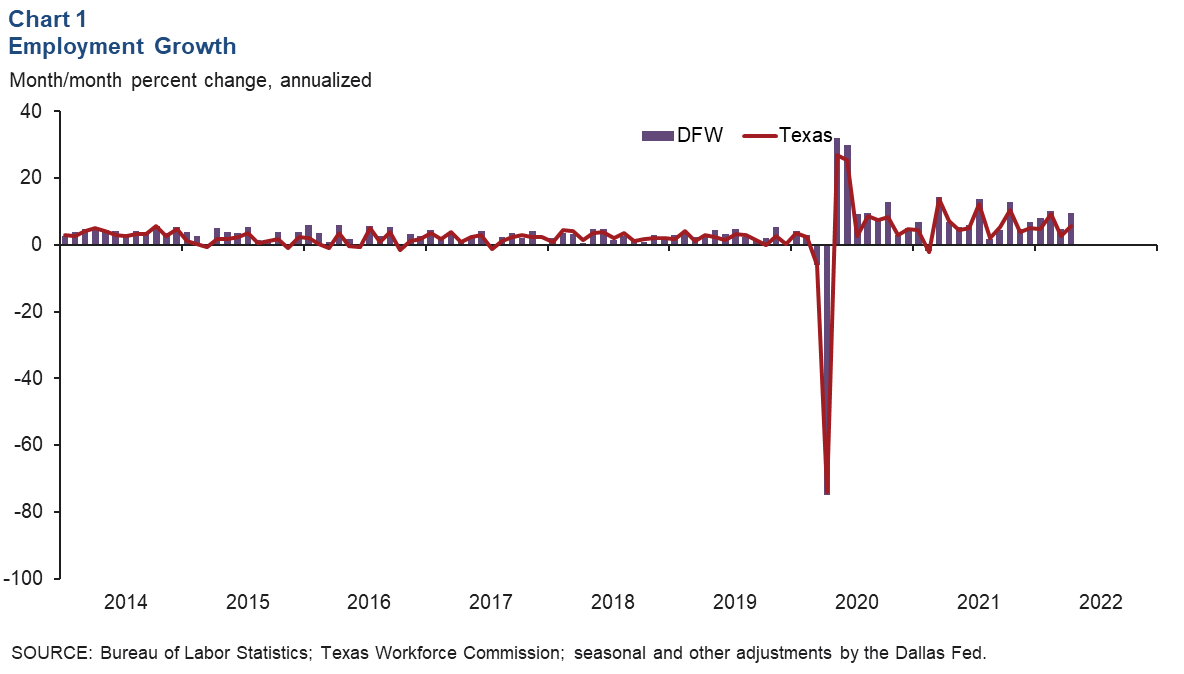
Payrolls in DFW expanded an annualized 9.5 percent (30,800 jobs) in April (Chart 1). The three-month change was robust at an annualized 8.1 percent (78,400 jobs), with growth broad based across sectors. Employment expanded 12.5 percent in the goods sector and 7.5 percent in services. For the three months ending in April, employment levels expanded 8.9 percent (61,750) in the Dallas–Plano–Irving metro division and 6.1 percent (16,650) in Fort Worth–Arlington. The unemployment rate dipped to 3.7 percent in Dallas and 3.8 percent in Fort Worth. The jobless rate in both metro divisions remained below the Texas (4.3 percent) figure.
Job growth in 2021 stronger than estimated
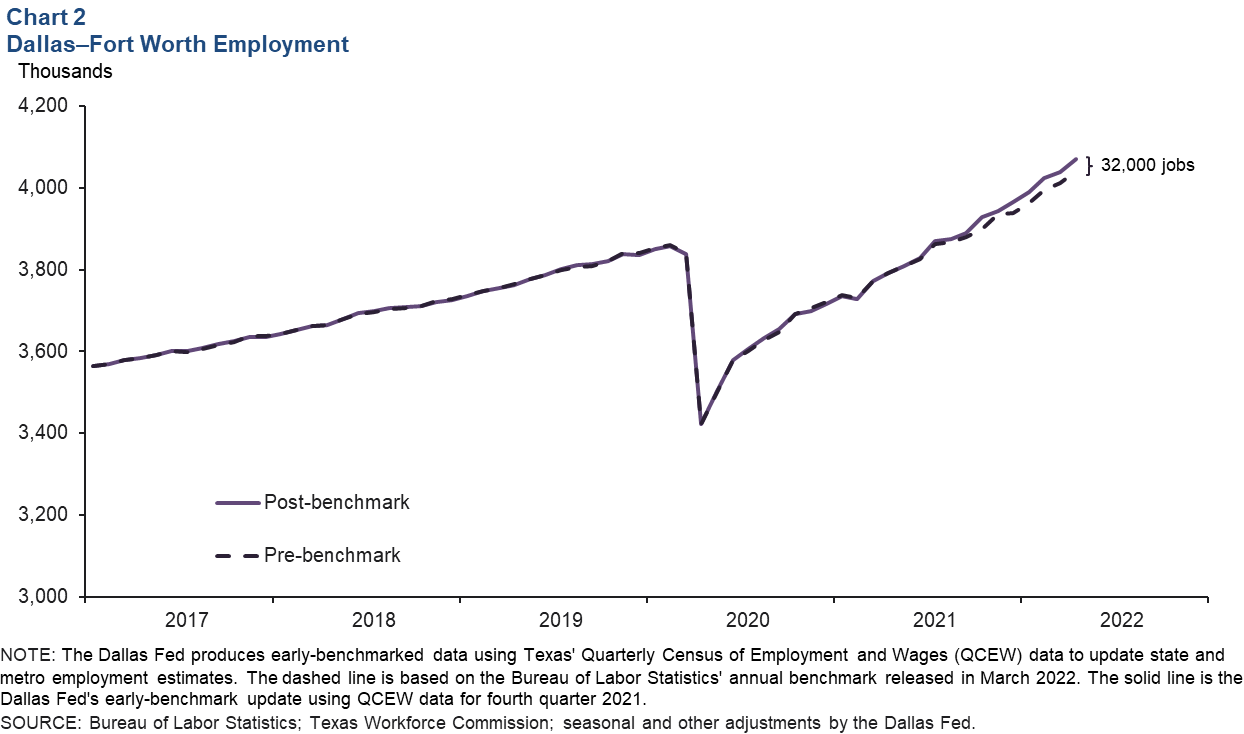
The Dallas Fed benchmarks both state and metro employment numbers quarterly using preliminary releases of the Quarterly Census of Employment and Wages (QCEW) data. Incorporating the fourth quarter 2021 QCEW data, DFW employment growth for 2021 was revised up 0.9 percentage points to 6.7 percent (250,000 jobs) (Chart 2). Employment growth in Dallas was revised up 1.1 percentage points from previous estimates to 7.4 percent—the largest revision among the state’s major metros—and payrolls in Fort Worth–Arlington were revised up 0.4 percentage points to 5.1 percent.
Business-cycle index
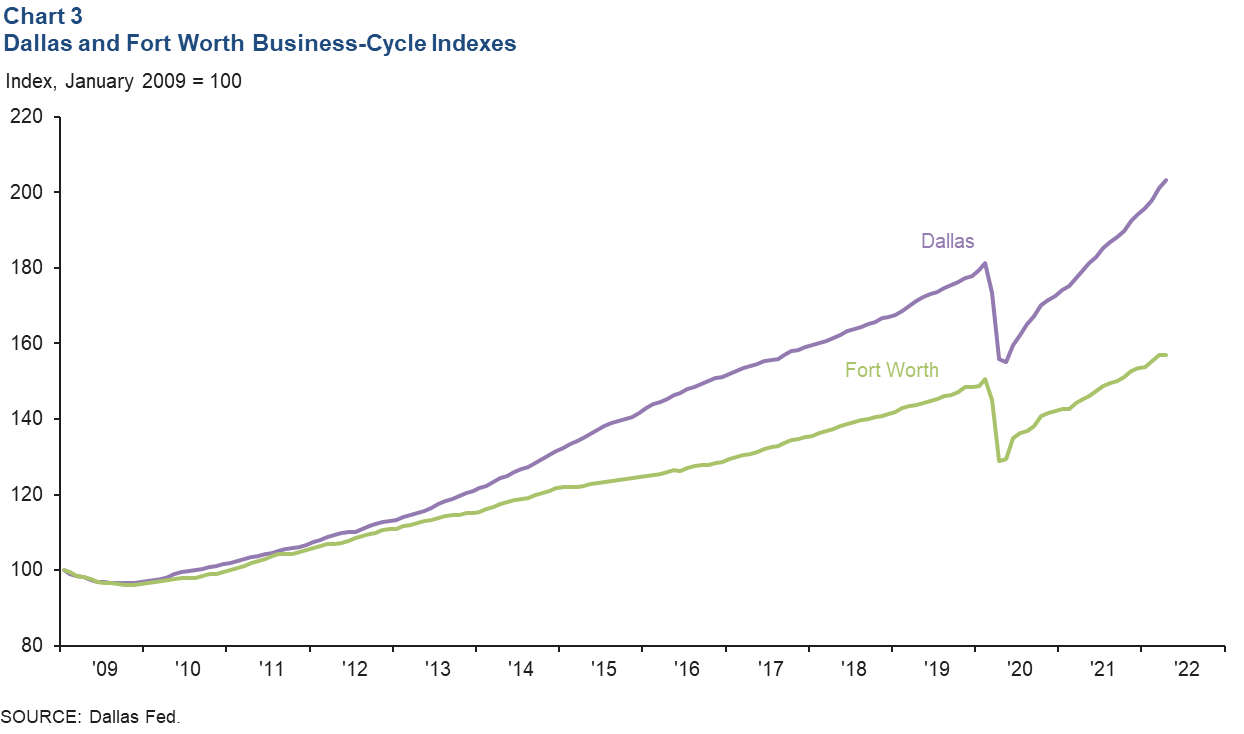
The Dallas and Fort Worth business-cycle indexes continued to expand in April, buoyed by sustained job growth. The Dallas index rose an annualized 14.3 percent, marking the 23rd straight month of growth (Chart 3). The Fort Worth index edged up an annualized 0.9 percent, marking its 14th successive month of expansion and surpassing its prepandemic high by 4.3 percent.
Housing
Existing-home sales tick up in April
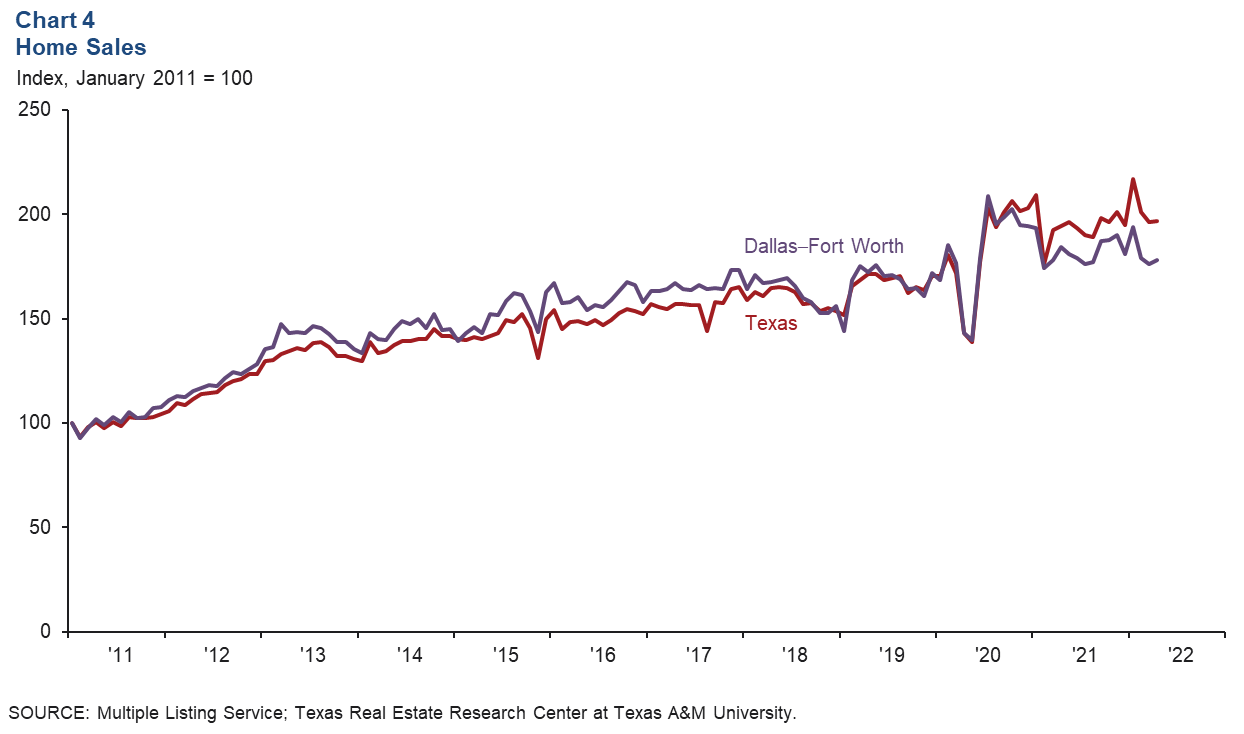
DFW existing-home sales rose 1.2 percent in April following declines in the prior two months (Chart 4). Statewide, existing-home sales were essentially flat, up 0.2 percent. Year over year in April, sales were down 3.2 percent in DFW. According to business contacts, new-home sales have slowed notably, dampened by higher mortgage rates and record-high prices. Cancellations are up, buyer waiting lists are shrinking and incentives are being reintroduced to buoy sales. DFW existing-home inventories stayed extremely tight at one month of supply.
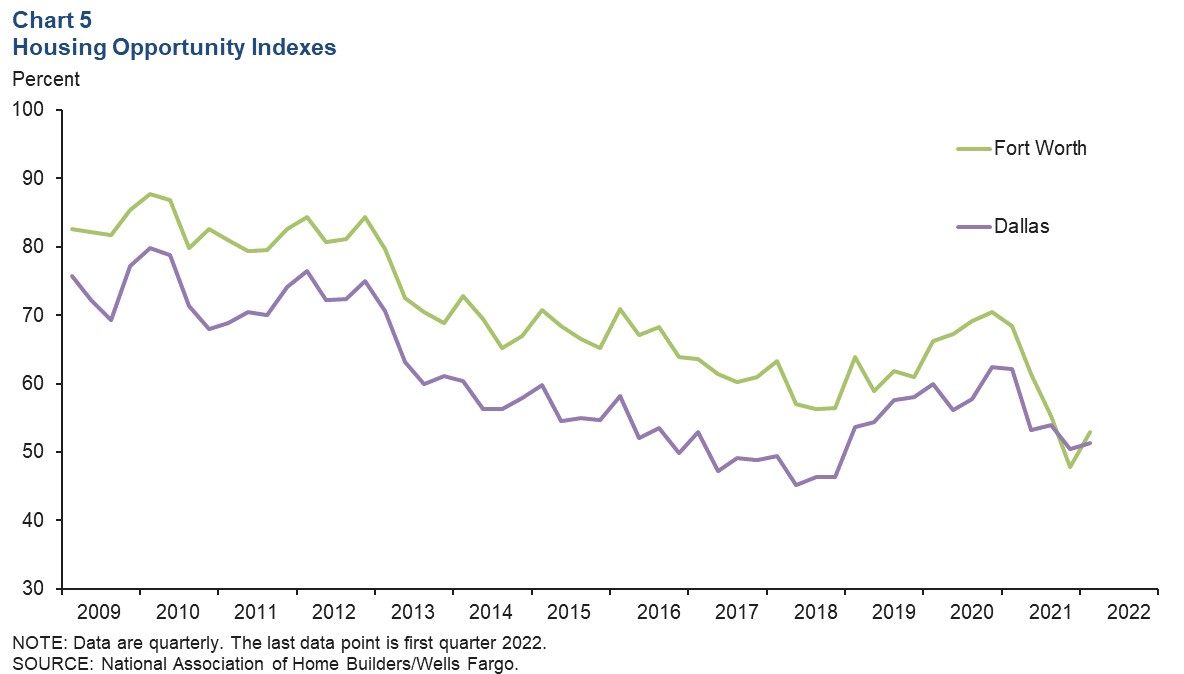
Affordability improves in first quarter
Despite continued rapid home-price appreciation in DFW, affordability improved in the first quarter of the year (Chart 5). In Dallas, the share of homes sold that the median-income household could afford increased from 50.4 percent in fourth quarter 2021 to 51.3 percent in the first quarter. Affordability in Fort Worth rose 5.2 percentage points to 53.0 percent in the first quarter. The increase in home prices has been partially offset by rising incomes so far in 2022. In April, median home prices climbed to an all-time high of $436,700 in Dallas and $369,300 in Fort Worth—year-over-year increases of 14.2 percent and 17.4 percent, respectively.
Population
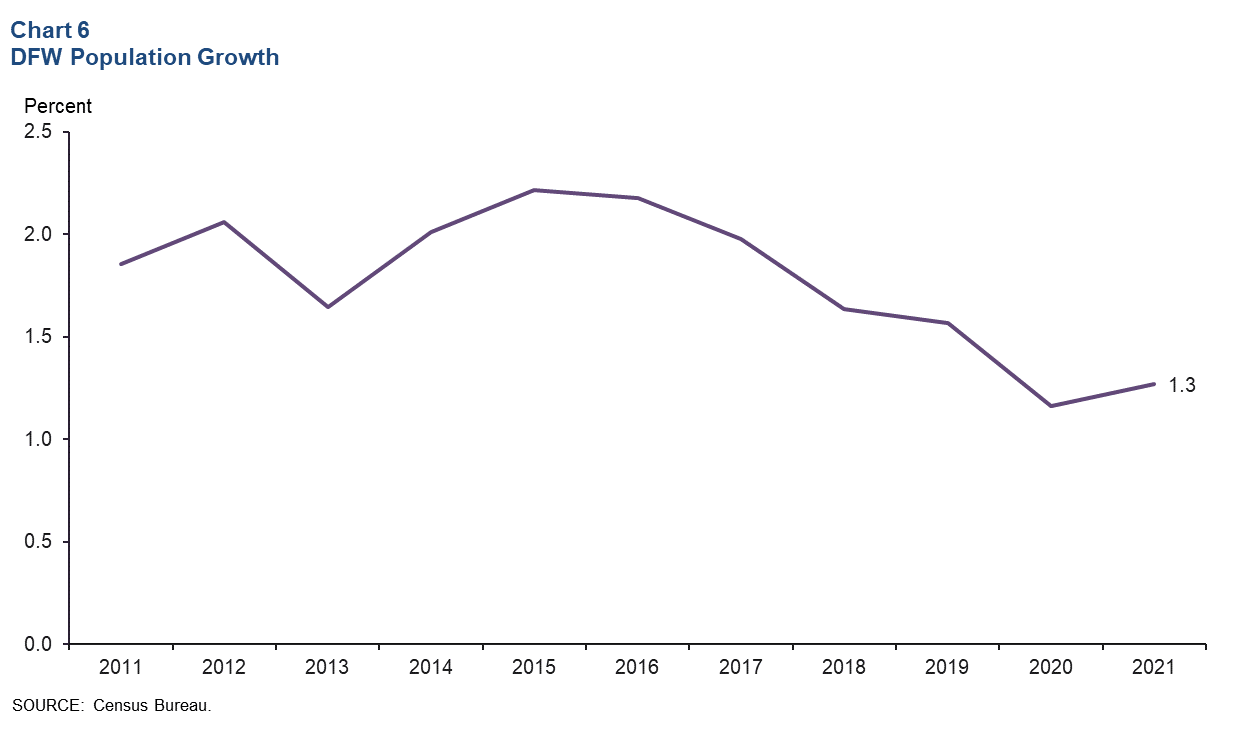
According to recently released census data, DFW’s population increased by 97,300 from July 2020 to July 2021 thanks to continuing in-migration, which accounted for 65 percent of the increase. In fact, the metro area saw the second-largest domestic in-migration gains among U.S. metros at 54,319, trailing only Phoenix. DFW’s population growth was 1.3 percent in 2021, up slightly from 1.2 percent in 2020—when it slowed due to the pandemic (Chart 6). Still, growth in 2021 was shy of its long-term average of 1.8 percent and has been moderating since peaking in 2015. In Dallas, population growth was little changed at 1.3 percent, while in Fort Worth, growth picked up to 1.1 percent from 0.9 percent in 2020. Growth at the state level was 1.1 percent in 2021, up from 2020’s 0.8 percent.
NOTE: Data may not match previously published numbers due to revisions.
About Dallas–Fort Worth Economic Indicators
Questions can be addressed to Laila Assanie at laila.assanie@dal.frb.org. Dallas–Fort Worth Economic Indicators is published every month after state and metro employment data are released.